Introduction
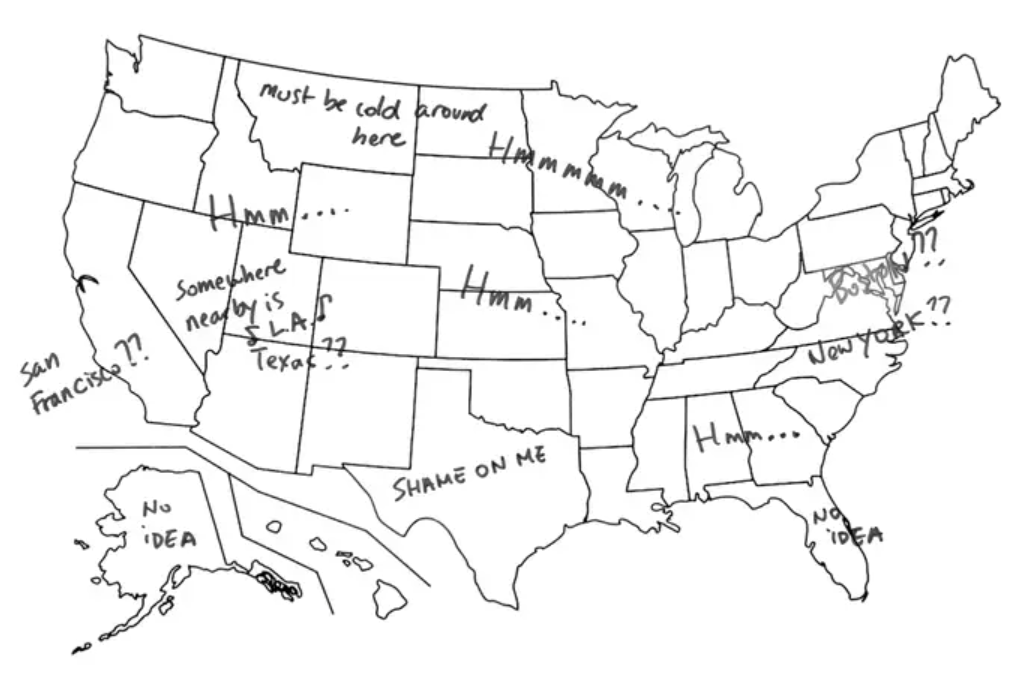
While surfing the internet, you come across a BuzzFeed article called “28 Things That Will Teach You A Damn Thing About Your State For Once.” Intrigued, you click through and explore the various maps, learning lessons from “The Most Popular TV Show by State.” As you hope that the British don't think of your home state in embarrassing terms, you begin to wonder how these maps were compiled. The answer, as you may have guessed from reading the “Introduction to GIS” text, is GIS - a science that can do remarkable things, from pinpointing patient zero during a disease outbreak to compiling and representing “The Most Googled Term by State.”
Maps are a scaled, graphic representation of reality, much like a map displaying the terms someone from a foreign country thinks about a particular region of the United States. As Americans, we know that Texas cannot be summed up with the terms “guns, oil, and cowboys.” Since this is just a stereotypical representation, we understand that no single map can fully represent every location, object, or the entire history of any specific place. The challenge faced by GIS users is to represent the world in a compact and concise way while keeping the data simple enough to understand at a glance.
In this class, we will examine GIS as a system. We'll learn not only how to use the software but also why it performs as it does by exploring the concepts behind it. We'll explore why GIS is only a tool at our disposal, capable of powerful calculations and map creation. Still, we'll also see that understanding geography, earth science, mathematics, and the science to which we wish to apply GIS is essential. From defining GIS to submitting your final project, your comprehension of the software and the world surrounding it will grow and become more defined.
| BuzzFeed: We Had Our Colleagues In Japan Label Maps Of America And The Results Were Hilarious |
|---|
 |
Throughout this semester, we will focus on a seven-part model of GIS, which includes Reality, Conception, Representation, Analysis, Documentation, Storage, and Distribution. This model will help us understand GIS as a process rather than a single idea. Reality refers to the world as we experience it, while conception involves our ideas, goals, and objectives before we represent digital map data. Analysis involves using GIS tools to solve spatial problems, and documentation and storage are crucial for data management based on industry standards. Finally, we will distribute the data in a standardized format for the world to use.
It's important to note that GIS requires more than just creating maps and ideas. As a GIS technician, you will learn how to apply a set of tools to a problem, question, or idea. It is crucial to look beyond your part in the process to your agency as a whole and the world beyond. By understanding the ideas that make GIS what it is, you will be able to find patterns and ideas that are "hidden" in the data with software assistance. While becoming proficient in the software is essential, it is equally important to grasp what drives GIS and where your data will go after you've completed your tasks.
This class will use the model to teach you all aspects of GIS, and you will complete a project using the skills you've learned throughout the semester. You will need to decide on a project idea, find or create data to represent real-world objects, use the tools learned in the lab to solve that problem, document your findings, keep your project data organized, and turn in a completed product. The steps you take for this project will be similar to those taken in the real world to complete a GIS project. The skills you learn along the way will guide you in creating a project that can be built upon in future GIS classes and jobs.