The first data model we will examine is vector data in any sort of digital science or art, is simply denoting a type of graphical representation using straight lines to construct the outlines of objects , which serves as a foundational element throughout your GIS Geographic Information Systems the software used to create, store, and manage spatial data, analyze spatial problems, and display the data in cartographic layouts Geographic Information Sciences career. The term 'vector' is not confined to GIS Geographic Information Systems the software used to create, store, and manage spatial data, analyze spatial problems, and display the data in cartographic layouts Geographic Information Sciences ; it also applies in fields like CAD and digital drawing, familiar to those with experience in these areas. Vector files, in any sort of digital science or art, are simply denoting a type of graphical representation using straight lines to construct the outlines of objects. Make the straight lines short enough and clustered together, and you can draw curves.
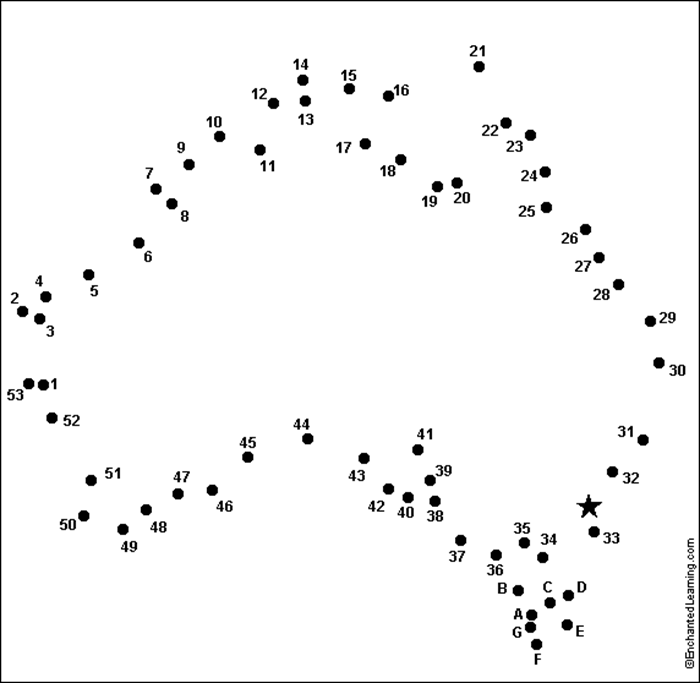 IIn fact, you have had many experiences with vector drawings in the past: dot-to-dots. These enjoyable grade school activities served not only as a learning tool for counting and letters but also allowed us to connect dots into recognizable images. Vector data in
GIS
Geographic Information Systems
the software used to create, store, and manage spatial data, analyze spatial problems, and display the data in cartographic layouts
Geographic Information Sciences
mirrors the concept of dot-to-dot activities from childhood, where connecting points creates coherent images. We establish each 'dot,' referred to as a '
vertex
pl. vertices
One of a set of ordered x,y coordinate pairs that defines the shape of a line or polygon feature.
,' and create useful data by connecting these vertices together. A vector file which creates a street in the
GIS
Geographic Information Systems
the software used to create, store, and manage spatial data, analyze spatial problems, and display the data in cartographic layouts
Geographic Information Sciences
is made up of a series of vertices (the plural of "
vertex
pl. vertices
One of a set of ordered x,y coordinate pairs that defines the shape of a line or polygon feature.
") connected together.
IIn fact, you have had many experiences with vector drawings in the past: dot-to-dots. These enjoyable grade school activities served not only as a learning tool for counting and letters but also allowed us to connect dots into recognizable images. Vector data in
GIS
Geographic Information Systems
the software used to create, store, and manage spatial data, analyze spatial problems, and display the data in cartographic layouts
Geographic Information Sciences
mirrors the concept of dot-to-dot activities from childhood, where connecting points creates coherent images. We establish each 'dot,' referred to as a '
vertex
pl. vertices
One of a set of ordered x,y coordinate pairs that defines the shape of a line or polygon feature.
,' and create useful data by connecting these vertices together. A vector file which creates a street in the
GIS
Geographic Information Systems
the software used to create, store, and manage spatial data, analyze spatial problems, and display the data in cartographic layouts
Geographic Information Sciences
is made up of a series of vertices (the plural of "
vertex
pl. vertices
One of a set of ordered x,y coordinate pairs that defines the shape of a line or polygon feature.
") connected together.
Within the GIS Geographic Information Systems the software used to create, store, and manage spatial data, analyze spatial problems, and display the data in cartographic layouts Geographic Information Sciences and vector data in any sort of digital science or art, is simply denoting a type of graphical representation using straight lines to construct the outlines of objects , the job of the every vertex pl. vertices One of a set of ordered x,y coordinate pairs that defines the shape of a line or polygon feature. is to 1. mark an XY coordinate pair in some coordinate system, geographic or projected and 2. know it's place in the order of all the other vertices. It plays a crucial role in forming graphic representations by establishing connections with other vertices. Vertices serve as the foundation of vector data in any sort of digital science or art, is simply denoting a type of graphical representation using straight lines to construct the outlines of objects in GIS Geographic Information Systems the software used to create, store, and manage spatial data, analyze spatial problems, and display the data in cartographic layouts Geographic Information Sciences , leading us to understand that these products manifest as three distinct geometry types. Understanding the three geometry types—points, polylines, and polygons—equips us with tools to effectively analyze and manipulate spatial data. Geometry types refer to specific shapes: a point A GIS vector data in any sort of digital science or art, is simply denoting a type of graphical representation using straight lines to construct the outlines of objects geometry type which is made up of just one vertex pl. vertices One of a set of ordered x,y coordinate pairs that defines the shape of a line or polygon feature. , marking a single XY location in any given geographic or projected coordinate system. (single location), a polyline A GIS vector data in any sort of digital science or art, is simply denoting a type of graphical representation using straight lines to construct the outlines of objects geometry type which is made up of two or more vertices connected by straight lines. Often used to represent objects such as roads, river, and boundaries. (connecting vertices along a path), or a polygon (a closed area). These three geometry types are used to represent real-world objects on a map.
Looking back and comparing the dot-to-dot analogy with vector data in any sort of digital science or art, is simply denoting a type of graphical representation using straight lines to construct the outlines of objects , we see the same outcome of creating polygons - a geometry type which connects three or more vertices in a closed shape, capable of measuring area - which represent not shoes, unicorns, or cats, but buildings, lakes, parking lots, and forested areas. The part about the 'ability to measure area' is key when it comes to polygon data because it is what sets it apart from polyline A GIS vector data in any sort of digital science or art, is simply denoting a type of graphical representation using straight lines to construct the outlines of objects geometry type which is made up of two or more vertices connected by straight lines. Often used to represent objects such as roads, river, and boundaries. data. Polylines are made up of two or more vertices connected together in a line to represent streets, rivers, and trails. Polylines can create a closed shape, like in the case of a round-about road, but regardless of the polyline A GIS vector data in any sort of digital science or art, is simply denoting a type of graphical representation using straight lines to construct the outlines of objects geometry type which is made up of two or more vertices connected by straight lines. Often used to represent objects such as roads, river, and boundaries. closing, the GIS Geographic Information Systems the software used to create, store, and manage spatial data, analyze spatial problems, and display the data in cartographic layouts Geographic Information Sciences is not capable of measuring the areas of, for example, the inside of the roundabout without first converting the closed polyline A GIS vector data in any sort of digital science or art, is simply denoting a type of graphical representation using straight lines to construct the outlines of objects geometry type which is made up of two or more vertices connected by straight lines. Often used to represent objects such as roads, river, and boundaries. to a polygon via a geoprocessing tool. The third geometry type is point A GIS vector data in any sort of digital science or art, is simply denoting a type of graphical representation using straight lines to construct the outlines of objects geometry type which is made up of just one vertex pl. vertices One of a set of ordered x,y coordinate pairs that defines the shape of a line or polygon feature. , marking a single XY location in any given geographic or projected coordinate system. , which is made of one vertex pl. vertices One of a set of ordered x,y coordinate pairs that defines the shape of a line or polygon feature. each, representing crime report locations, fire hydrants, and individual trees.
- It should be noted that while the geometry type " point A GIS vector data in any sort of digital science or art, is simply denoting a type of graphical representation using straight lines to construct the outlines of objects geometry type which is made up of just one vertex pl. vertices One of a set of ordered x,y coordinate pairs that defines the shape of a line or polygon feature. , marking a single XY location in any given geographic or projected coordinate system. " is made up of a single vertex pl. vertices One of a set of ordered x,y coordinate pairs that defines the shape of a line or polygon feature. - one for each point A GIS vector data in any sort of digital science or art, is simply denoting a type of graphical representation using straight lines to construct the outlines of objects geometry type which is made up of just one vertex pl. vertices One of a set of ordered x,y coordinate pairs that defines the shape of a line or polygon feature. , marking a single XY location in any given geographic or projected coordinate system. - the words are not interchangeable. "Vertex" is the building block, and " point A GIS vector data in any sort of digital science or art, is simply denoting a type of graphical representation using straight lines to construct the outlines of objects geometry type which is made up of just one vertex pl. vertices One of a set of ordered x,y coordinate pairs that defines the shape of a line or polygon feature. , marking a single XY location in any given geographic or projected coordinate system. " is the resulting geometry type. Remember that all vector files are made up not only the shape which you see, but the associated attributes as well. When our goal of GIS Geographic Information Systems the software used to create, store, and manage spatial data, analyze spatial problems, and display the data in cartographic layouts Geographic Information Sciences data is to combine the spatial and non-spatial, that is exactly what we must do. Points are geometry type - a file with associated non-spatial data Attributes related to a location but not describing its physical placement in space, such as information about a tree's age, type, and health. in the form of attribute tables (which will be covered in detail soon).
| Figure 3.1: Vector Data |
|---|
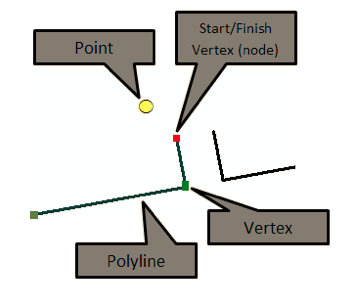 |
| In this image, we see two vertices (two in green and one in red) and the polyline A GIS vector data in any sort of digital science or art, is simply denoting a type of graphical representation using straight lines to construct the outlines of objects geometry type which is made up of two or more vertices connected by straight lines. Often used to represent objects such as roads, river, and boundaries. that is created by connected each vertex pl. vertices One of a set of ordered x,y coordinate pairs that defines the shape of a line or polygon feature. to the next. The red vertex pl. vertices One of a set of ordered x,y coordinate pairs that defines the shape of a line or polygon feature. is special in that it is the last vertex pl. vertices One of a set of ordered x,y coordinate pairs that defines the shape of a line or polygon feature. in the line (called a "node"). In polygon features, the node is the start and the finish vertex pl. vertices One of a set of ordered x,y coordinate pairs that defines the shape of a line or polygon feature. , since polygons are defined as a closed shape consisting of at least three vertices. |
Vector data is advantageous in the GIS Geographic Information Systems the software used to create, store, and manage spatial data, analyze spatial problems, and display the data in cartographic layouts Geographic Information Sciences for many reasons.
- The file itself is small, usually 50 kb - 200 mb, which is often small enough to be emailed in a zip format (to make it easy).
- When using vector features in the GIS Geographic Information Systems the software used to create, store, and manage spatial data, analyze spatial problems, and display the data in cartographic layouts Geographic Information Sciences , they create smooth, easily defined lines which can be scaled to any size without being skewed, distorted, or becoming pixelated.
- In GIS Geographic Information Systems the software used to create, store, and manage spatial data, analyze spatial problems, and display the data in cartographic layouts Geographic Information Sciences , all vector files are paired with a data table, or an attribute table, which can hold a large amount of information, or attributes, about each independent geospatial object, or feature, (one road, one tree, one building), from the feature’s name (ie. Colorado) to the population in 2015 (5.4 million), to the racial breakdown of residents by county. Merging spatial and non-spatial data Attributes related to a location but not describing its physical placement in space, such as information about a tree's age, type, and health. through vector files empowers valuable insights and problem-solving in GIS Geographic Information Systems the software used to create, store, and manage spatial data, analyze spatial problems, and display the data in cartographic layouts Geographic Information Sciences . When a polygon vector file contains representations of a series of lakes, each one was carefully drawn in the GIS Geographic Information Systems the software used to create, store, and manage spatial data, analyze spatial problems, and display the data in cartographic layouts Geographic Information Sciences with the mouse on top of an image, or digitized A term to describe data which was created through the act of digitizing The action of creating vector data in any sort of digital science or art, is simply denoting a type of graphical representation using straight lines to construct the outlines of objects by defining the location of each vertex pl. vertices One of a set of ordered x,y coordinate pairs that defines the shape of a line or polygon feature. utilizing drawing pad and puck (manual or hardcopy digitizing) or a computer with a mouse (heads-up or on-screen digitizing) while, most often, looking at and tracing aerial or satellite imagery. (Chapter Six), which means each one has a calculated area. And just like measuring the surface area of a lake (or any irregular object), there is a fair amount of calculus involved. Don’t worry, you do not have to solve for it, the GIS Geographic Information Systems the software used to create, store, and manage spatial data, analyze spatial problems, and display the data in cartographic layouts Geographic Information Sciences does it for us in a fraction of a second, but you should know that solving for the area of a curve uses integrals, a method of finding the area under a curve by solving for a large number of rectangles which fit under that curve. In short, finding the area under a curve is a very challenging thing to do and finding the area of a rectangle is pretty easy - it's the length multiplied by the width. If we place a whole bunch of very skinny rectangles under a curve, the rectangles can mimic the curve and we can solve for the area of each one, adding them all together. When we look at rasters in the next section, we will see that finding the area of objects is as easy as adding a bunch of squares together. While we haven't gotten to that yet, keep in mind how the area of vector polygons are solved vs how the area of pixels within rasters are solved.
3.2.2: Measuring Distances and Areas with Vectors
Since GIS Geographic Information Systems the software used to create, store, and manage spatial data Data that deals with location, such as lists of addresses, the footprint of a building, the boundaries of cities and counties, etc. , analyze spatial problems, and display the data in cartographic layouts Geographic Information Sciences vector files are representative of real-world objects (representation in the GIS Geographic Information Systems the software used to create, store, and manage spatial data Data that deals with location, such as lists of addresses, the footprint of a building, the boundaries of cities and counties, etc. , analyze spatial problems, and display the data in cartographic layouts Geographic Information Sciences model), they represent all factors of the real world - size, shape, length, area, and location. When a polygon vector file contains representations of a series of lakes, each one was carefully drawn in the GIS Geographic Information Systems the software used to create, store, and manage spatial data Data that deals with location, such as lists of addresses, the footprint of a building, the boundaries of cities and counties, etc. , analyze spatial problems, and display the data in cartographic layouts Geographic Information Sciences with the mouse on top of an image, or digitized A term to describe data which was created through the act of digitizing The action of creating vector data in any sort of digital science or art, is simply denoting a type of graphical representation using straight lines to construct the outlines of objects by defining the location of each vertex pl. vertices One of a set of ordered x,y coordinate pairs that defines the shape of a line or polygon feature. utilizing drawing pad and puck (manual or hardcopy digitizing) or a computer with a mouse (heads-up or on-screen digitizing) while, most often, looking at and tracing aerial or satellite imagery. (Chapter Six), which means each one has a calculated area. And just like measuring the surface area of a lake (or any irregular object), there is a fair amount of calculus involved. Don’t worry, you do not have to solve for it, the GIS Geographic Information Systems the software used to create, store, and manage spatial data Data that deals with location, such as lists of addresses, the footprint of a building, the boundaries of cities and counties, etc. , analyze spatial problems, and display the data in cartographic layouts Geographic Information Sciences does it for us in a fraction of a second, but you should know that solving for the area of a curve uses integrals, a method of finding the area under a curve by solving for a large number of rectangles which fit under that curve. In short, finding the area under a curve is a very challenging thing to do and finding the area of a rectangle is pretty easy - it's the length multiplied by the width. If we place a whole bunch of very skinny rectangles under a curve, the rectangles can mimic the curve and we can solve for the area of each one, adding them all together. When we look at rasters in the next section, we will see that finding the area of objects is as easy as adding a bunch of squares together. While we haven't gotten to that yet, keep in mind how the area of vector polygons are solved vs how the area of pixels within rasters are solved.
| Figure 3.2: Measuring the Area of Polygons using Integrals |
|---|
 |
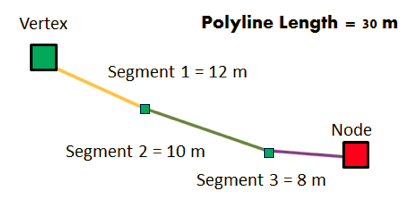
Measuring lengths of polylines is much easier and more straight forward then polygon areas. When digitizing The action of creating vector data in any sort of digital science or art, is simply denoting a type of graphical representation using straight lines to construct the outlines of objects by defining the location of each vertex pl. vertices One of a set of ordered x,y coordinate pairs that defines the shape of a line or polygon feature. utilizing drawing pad and puck (manual or hardcopy digitizing) or a computer with a mouse (heads-up or on-screen digitizing) while, most often, looking at and tracing aerial or satellite imagery. a polyline A GIS vector data in any sort of digital science or art, is simply denoting a type of graphical representation using straight lines to construct the outlines of objects geometry type which is made up of two or more vertices connected by straight lines. Often used to represent objects such as roads, river, and boundaries. for a series of roads, GIS Geographic Information Systems the software used to create, store, and manage spatial data Data that deals with location, such as lists of addresses, the footprint of a building, the boundaries of cities and counties, etc. , analyze spatial problems, and display the data in cartographic layouts Geographic Information Sciences measures the distance between each vertex pl. vertices One of a set of ordered x,y coordinate pairs that defines the shape of a line or polygon feature. , adhering to the definitions of vector features.
| Figure 3.3: Measuring the Length of Polylines by Adding the Lengths of the Individual Segments |
|---|
 |
Point vector data in any sort of digital science or art, is simply denoting a type of graphical representation using straight lines to construct the outlines of objects lacks measurable length or area, and consists solely of coordinate pairs on a geographic grid the result of using an established angular unit of measure to label the intersections of north-south and east-west lines on the surface of the Earth starting the labels at a principal meridian the north-south line from which the labeling begins. East-west lines have a very obvious start point: the equator. North-south lines must start somewhere, so when it is established for a particular geographic grid, it can be considered the principal meridian. . The values of a point A GIS vector data in any sort of digital science or art, is simply denoting a type of graphical representation using straight lines to construct the outlines of objects geometry type which is made up of just one vertex pl. vertices One of a set of ordered x,y coordinate pairs that defines the shape of a line or polygon feature. , marking a single XY location in any given geographic or projected coordinate system. are expressed via its X and Y coordinates, in degrees measurement of plane angle, representing 1⁄360 of a full rotation (circle). In full, a degree of arc or arc degree. Usually denoted by ° for geographic systems or in meters and feet for projected systems. The "address" of the point A GIS vector data in any sort of digital science or art, is simply denoting a type of graphical representation using straight lines to construct the outlines of objects geometry type which is made up of just one vertex pl. vertices One of a set of ordered x,y coordinate pairs that defines the shape of a line or polygon feature. , marking a single XY location in any given geographic or projected coordinate system. is a measurement from the origin of the system, with the X coordinate measuring the distance in degrees measurement of plane angle, representing 1⁄360 of a full rotation (circle). In full, a degree of arc or arc degree. Usually denoted by ° , meters, or feet along a line of longitude and the Y coordinate measuring along a line of latitude also known as 'parallels' the east-west portion of a geographic grid measured with angles between 0 and 90° (exactly like Cartesian Coordinate System when plotting points). These coordinates resolve distances from the origin (0,0) to any location within the coordinate system (again, exactly like Cartesian Coordinate Systems).
The unique properties of vector data in any sort of digital science or art, is simply denoting a type of graphical representation using straight lines to construct the outlines of objects —such as fluid feature representation and minimal storage requirements—make it ideal for GIS Geographic Information Systems the software used to create, store, and manage spatial data Data that deals with location, such as lists of addresses, the footprint of a building, the boundaries of cities and counties, etc. , analyze spatial problems, and display the data in cartographic layouts Geographic Information Sciences projects. We can cleanly represent data such as winding roads and rivers, peculiar shaped buildings, and objects which can be represented simply as points, such as fire hydrants - which is why 90% of the data we work with in this class, and with GIS Geographic Information Systems the software used to create, store, and manage spatial data Data that deals with location, such as lists of addresses, the footprint of a building, the boundaries of cities and counties, etc. , analyze spatial problems, and display the data in cartographic layouts Geographic Information Sciences as a whole, is vector data in any sort of digital science or art, is simply denoting a type of graphical representation using straight lines to construct the outlines of objects .
Concept Quiz
3.2.3: Recognizing Vector Data
In the last section, we looked at the idea that vector data in any sort of digital science or art, is simply denoting a type of graphical representation using straight lines to construct the outlines of objects come in three geometry types, built on a series of vertices placed at XY coordinates, and has associated non-spatial data Attributes related to a location but not describing its physical placement in space, such as information about a tree's age, type, and health. . In GIS Geographic Information Systems the software used to create, store, and manage spatial data, analyze spatial problems, and display the data in cartographic layouts Geographic Information Sciences , " vector data in any sort of digital science or art, is simply denoting a type of graphical representation using straight lines to construct the outlines of objects " is a category of data, one of the three main data models: vector, raster, and data tables. Within vector data in any sort of digital science or art, is simply denoting a type of graphical representation using straight lines to construct the outlines of objects , two of several sub-categories emerge: shapefiles and feature classes, each with distinct functionalities. Understanding the differences between shapefiles and feature classes is essential for effective GIS Geographic Information Systems the software used to create, store, and manage spatial data, analyze spatial problems, and display the data in cartographic layouts Geographic Information Sciences data management and project execution. ArcGIS Pro has a few ways to recognize both shapefiles and feature classes within the software, as well as some clues to the vector category in File Explorer.
Shapefiles vs Feature Classes
As we've stated, vector data in any sort of digital science or art, is simply denoting a type of graphical representation using straight lines to construct the outlines of objects can be broken into to main categories: shapefiles and feature classes. Both shapefiles and feature classes function in GIS Geographic Information Systems the software used to create, store, and manage spatial data, analyze spatial problems, and display the data in cartographic layouts Geographic Information Sciences to visualize vector data in any sort of digital science or art, is simply denoting a type of graphical representation using straight lines to construct the outlines of objects with smooth lines, though their storage and retrieval mechanisms differ fundamentally. Both are made up a series of vertices and both have non-spatial data Attributes related to a location but not describing its physical placement in space, such as information about a tree's age, type, and health. associated with them via attribute tables. Both shapefiles and feature classes occupy minimal space and can analyze spatial patterns, measuring areas and distances effectively. Both are small in size and do not distort when they are resized in the software. Both can be used as the inputs to geoprocessing tools (chapter seven). For the most part, they are almost exactly the same. So what distinguishes these two data types? Feature classes are a vector data in any sort of digital science or art, is simply denoting a type of graphical representation using straight lines to construct the outlines of objects model designed and owned by ESRI, creating unique operational capacities when linked with geodatabases. Historically, feature classes operated solely within ArcGIS environments, but the expansion of GIS Geographic Information Systems the software used to create, store, and manage spatial data, analyze spatial problems, and display the data in cartographic layouts Geographic Information Sciences technology now allows wider accessibility across multiple platforms. Many users grew frustrated with the need to use ESRI software to convert feature classes into shapefiles for broader software compatibility; this complexity often felt like an unnecessary hurdle. As a response, ESRI changed that, allowing non-ESRI software to open geodatabases and feature classes.
The power of feature classes come from, not their propitiatory nature, but from the fact that they must reside inside geodatabase electronic storage container specifically used to store geographic/spatial data with a top-down structure in which the items contained are related to each other and that relationship allows for the data to be quickly and efficiently queried and retrieved for use. . Geodatabases, as we will see in future chapter, are a special container made to hold certain kinds of spatial data, similar to a folder on your computer's desktop. Much like you save all of the papers you wrote in freshman English in a folder named something clever like "English 101", geodatabases are a way to store all of the spatial data for a particular GIS Geographic Information Systems the software used to create, store, and manage spatial data, analyze spatial problems, and display the data in cartographic layouts Geographic Information Sciences project. While folders organize files, geodatabases elevate spatial data management, enabling enhanced relationships between various data points for complex geospatial analysis. Not only are the contents related because they all are used in one project, there are ways to inter-connect those files so they interact with each other. These connections are very powerful in GIS Geographic Information Systems the software used to create, store, and manage spatial data, analyze spatial problems, and display the data in cartographic layouts Geographic Information Sciences , a science made up of a series of data models and non-spatial data Attributes related to a location but not describing its physical placement in space, such as information about a tree's age, type, and health. , which we use all together to solve spatial problems. We will take a deeper look at geodatabases later, so for now, just understand their basic concept - a special geo-container that allows for data to be stored in an interconnected way, and from those connections comes a deeper understanding of all the data models as a whole, not just individual files.
Shapefiles are a universal form of GIS Geographic Information Systems the software used to create, store, and manage spatial data, analyze spatial problems, and display the data in cartographic layouts Geographic Information Sciences vector data in any sort of digital science or art, is simply denoting a type of graphical representation using straight lines to construct the outlines of objects . No particular software company "owns" shapefiles. They can be seamlessly opened and edited in any GIS Geographic Information Systems the software used to create, store, and manage spatial data, analyze spatial problems, and display the data in cartographic layouts Geographic Information Sciences software, some CAD software, and even some graphic design software. However, their universal nature limits their power within any single GIS Geographic Information Systems the software used to create, store, and manage spatial data, analyze spatial problems, and display the data in cartographic layouts Geographic Information Sciences software. As we just saw, feature classes are a kind of vector file which resides inside a geodatabase electronic storage container specifically used to store geographic/spatial data with a top-down structure in which the items contained are related to each other and that relationship allows for the data to be quickly and efficiently queried and retrieved for use. , which gives the feature classes the power of relating to and working with other files inside that geodatabase electronic storage container specifically used to store geographic/spatial data with a top-down structure in which the items contained are related to each other and that relationship allows for the data to be quickly and efficiently queried and retrieved for use. . Shapefiles, which can only live inside folders, are each and independent object, even if many shapefiles live inside one folder. The geodatabase electronic storage container specifically used to store geographic/spatial data with a top-down structure in which the items contained are related to each other and that relationship allows for the data to be quickly and efficiently queried and retrieved for use. is the container with power, not the folder. Shapefiles, however, are easy to use, do not require any other spatial data containers to exist, do not need any other files to operate successfully, and can be opened with a wide variety of software without the need to convert or import the data in any way.
As time goes on, both in GIS Geographic Information Systems the software used to create, store, and manage spatial data, analyze spatial problems, and display the data in cartographic layouts Geographic Information Sciences 1040 and in your GIS Geographic Information Systems the software used to create, store, and manage spatial data, analyze spatial problems, and display the data in cartographic layouts Geographic Information Sciences career, the ability to recognize the difference between shapefiles and feature classes will become seamless. Recognizing the distinctions between shapefiles and feature classes is empowering for data management, influencing the methods used in all your GIS Geographic Information Systems the software used to create, store, and manage spatial data, analyze spatial problems, and display the data in cartographic layouts Geographic Information Sciences endeavors. For now, just understand the basic differences between the files: shapefiles are universal vector file type which live inside folders, and with that, they do not require any sort of conversion or importing to fully use them; and feature classes are a proprietary ESRI vector file type that live only inside geodatabases, and additionally, the geodatabase electronic storage container specifically used to store geographic/spatial data with a top-down structure in which the items contained are related to each other and that relationship allows for the data to be quickly and efficiently queried and retrieved for use. allows for creating relationships between data stored within (vector, raster, and data tables).
File Explorer ... What’s that?
Throughout this text and this class, we attempt to be clear about software and concepts. With this in mind, let us define what we mean by 'File Explorer' and how it facilitates file management. File Explorer is a file manager that displays the hierarchical structure of files, folders, and drives on your computer. In addition to local files, File Explorer also displays any network drives mapped to drive letters, making it easy for users to access shared resources. Using File Explorer, users can copy, move, rename, and search for (non-spatial) files and folders. For example, by using File Explorer, you can easily open a folder containing a Windows file, such as a Word document, and drag the file to another folder or drive, successfully copying it. You might also know File Explorer as 'My Computer' from earlier Windows versions. For Macintosh users, File Explorer is equivalent to 'Finder', while Linux users refer to it as Nautilus. Importantly, Windows (File) Explorer shouldn't be confused with Internet Explorer, despite being both developed by Microsoft. Internet Explorer is a web browser for browsing the internet, whereas File Explorer focuses on managing local files on your machine.
GIS Geographic Information Systems the software used to create, store, and manage spatial data, analyze spatial problems, and display the data in cartographic layouts Geographic Information Sciences data is distinct from standard data, as it's often not a single file, but rather a package composed of multiple interconnected files. Shapefiles are one of these 'packages' of data as it is not just one file; but comprises a package of three to eight related files. Due to this unique packaging of GIS Geographic Information Systems the software used to create, store, and manage spatial data, analyze spatial problems, and display the data in cartographic layouts Geographic Information Sciences data, File Explorer is generally unsuitable for opening, moving, renaming, or editing spatial data. The stakes are high; poorly managing GIS Geographic Information Systems the software used to create, store, and manage spatial data, analyze spatial problems, and display the data in cartographic layouts Geographic Information Sciences data through File Explorer can lead to irreversible corruption of crucial files. Improperly copying a GIS Geographic Information Systems the software used to create, store, and manage spatial data, analyze spatial problems, and display the data in cartographic layouts Geographic Information Sciences file—missing one of the necessary components—can render it unusable in ArcGIS, unintentionally leading to data corruption if spatial files are not managed properly. In GIS Geographic Information Systems the software used to create, store, and manage spatial data, analyze spatial problems, and display the data in cartographic layouts Geographic Information Sciences , various software suites provide methods for copying, deleting, renaming, or moving spatial data. However, when discussing data handling practices, exceptions do exist.
The key exception regarding GIS Geographic Information Systems the software used to create, store, and manage spatial data, analyze spatial problems, and display the data in cartographic layouts Geographic Information Sciences data handling arises when it needs to be delivered or stored efficiently, ideally in ZIP format. Since GIS Geographic Information Systems the software used to create, store, and manage spatial data, analyze spatial problems, and display the data in cartographic layouts Geographic Information Sciences data consists of multiple associated files, it is essential to deliver or store it using ZIP format for vector data in any sort of digital science or art, is simply denoting a type of graphical representation using straight lines to construct the outlines of objects and TAR format for raster data Raster data is a type of digital data that stores information about a location using a grid of pixels or cells. All spatial rasters are raster files, but not all raster files are spatial rasters. . This task can be accomplished in File Explorer, since ArcGIS does not have a "compress data for delivery" feature.
What Are Each of the Three to Eight Files?
| Extension | Description | Required? |
|---|---|---|
| .shp | The main file that stores the feature geometry. No attributes are stored in this file—only geometry | Yes |
| .shx | A companion file to the .shp that stores the position of individual feature IDs in the .shp file. | Yes |
| .dbf | The dBase table that stores the attribute information of features. | Yes |
| .sbn and .sbx | Files that store the spatial index of the features. | No |
| .atx | Created for each dBase attribute index created in ArcCatalog. | No |
| .ixs and .mxs | Geocoding index for read-write shapefiles. | No |
| .prj | The file that stores the coordinate system information. | No |
| .xml | Metadata for ArcGIS - stores information about the shapefile One of the two main types of vector data in any sort of digital science or art, is simply denoting a type of graphical representation using straight lines to construct the outlines of objects we learn in this class (there are more than two vector data in any sort of digital science or art, is simply denoting a type of graphical representation using straight lines to construct the outlines of objects types in GIS). Shapefiles are each only one geometry type, either a point, a polyline, or a polygon. Shapefiles are stored in folders and most often do not have relationships with other data. . | No |
3.2.4: ArcGIS Pro - Catalog View
As we’ve determined, since spatial data Data that deals with location, such as lists of addresses, the footprint of a building, the boundaries of cities and counties, etc. can be inadvertently destroyed in File Explorer, each GIS Geographic Information Systems the software used to create, store, and manage spatial data Data that deals with location, such as lists of addresses, the footprint of a building, the boundaries of cities and counties, etc. , analyze spatial problems, and display the data in cartographic layouts Geographic Information Sciences software suite has a solution to the problem. In ArcGIS Pro, we use Catalog View, which functions similarly to File Explorer but is specifically designed for efficient spatial data Data that deals with location, such as lists of addresses, the footprint of a building, the boundaries of cities and counties, etc. management. Catalog View in ArcGIS Pro is dedicated to creating and organizing spatial data Data that deals with location, such as lists of addresses, the footprint of a building, the boundaries of cities and counties, etc. files. It treats shapefiles and feature classes as single entities rather than multiple separate files. This feature prevents data loss by ensuring no individual files are overlooked during transfers. In ArcGIS Pro, each file type is represented by a distinct icon, facilitating quick recognition of file formats and enhancing data management efficiency. As illustrated in Figure 3.2.1, Windows Explorer attempts to predict which program opens independent files, but it often falls short; the .dbf extension ( database electronic storage container with a top-down structure in which the items contained are related to each other and that relationship allows for the data to be quickly and efficiently queried and retrieved for use. file) is an exception recognized by Microsoft Excel.
| Figure 3.4: Spatial Data as Seen in Windows (File) Explorer vs Spatial Data as Seen in ArcCatalog | ||
|---|---|---|
 | 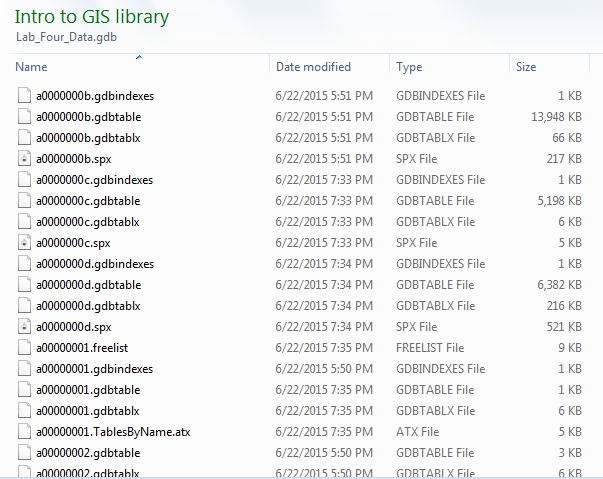 | 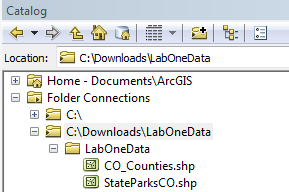 |
| Shapefiles as Shown in File Explorer | Feature Classes Within a Geodatabase as Shown in File Explorer | Shapefiles as Shown in ArcCatalog |
In contrast, ArcGIS Pro - Catalog View excels by ensuring proper file type recognition with color-coded icons.
| Figure 3.5: Shapefile and Feature Class File Icons | |||||
|---|---|---|---|---|---|
| Feature Class: Polyline | Feature Class: Point | Feature Class: Polygon | Shapefile: Polyline | Shapefile: Point | Shapefile: Polygon |
All of the file icons can be looked up and reviewed on a dedicated page, found in the Reference Section of the textbook.