Standard Toolbar
The Standard Toolbar in ArcMap is the place to find all your Windows-based buttons such as Save, Open, Print, Undo/Redo.
![]()
New
Closes (prompts to save) the current MXD and launches a new, blank version. | ||||||
OpenOpens a window to find and launch a saved MXD. | ||||||
SaveSaves the current MXD. Launches a window to designate a name and a place if the MXD had not been saved previously. Simply overwrites for all subsequent saves. | ||||||
Prints the current view, either what is seen in the current extent of Data View or the layout if in Layout View. | ||||||
CutCuts the currently selected feature. | ||||||
CopyCopies a selected feature. | ||||||
PastePastes a selected feature. | ||||||
DeleteDeletes the currently selected item. | ||||||
UndoUndoes whatever action was just taken. | ||||||
RedoRedoes the last action taken. | ||||||
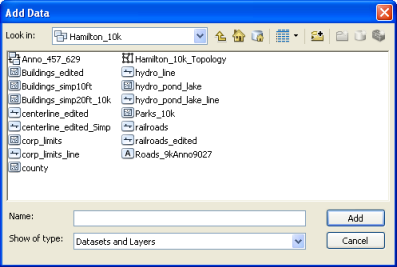
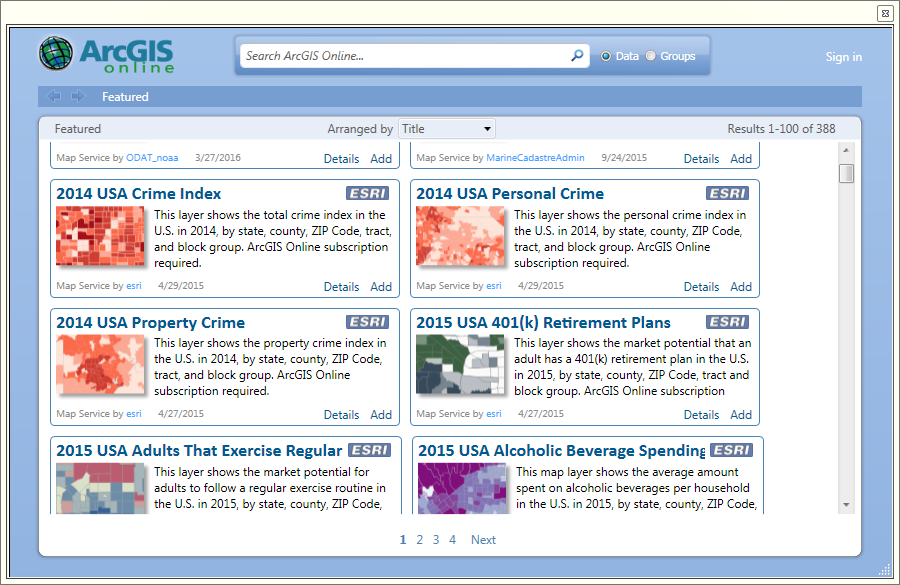
Add Data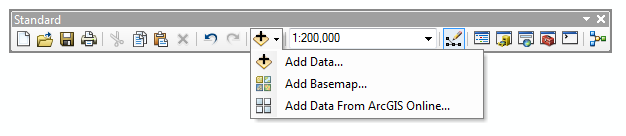 Opens the ‘Add Data’ Dialog box for adding data of all types to ArcMap
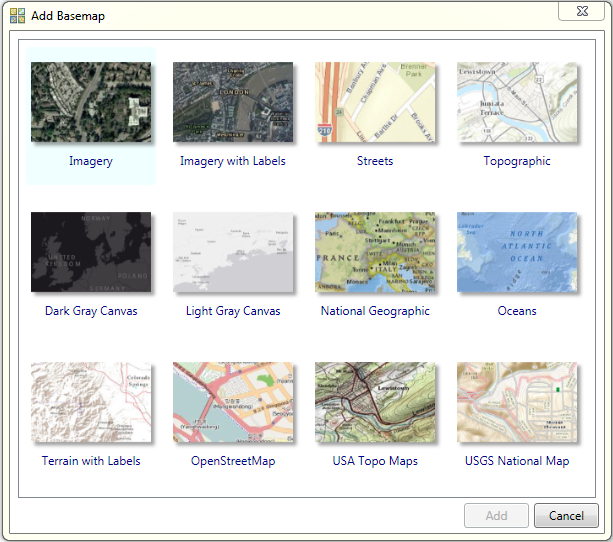
Add Basemap...Opens the dialog box to add one of twelve basemaps from ArcGIS Online.
Add Data from ArcGIS OnlineOpens a dialog box to search for free and paid data (marked with ArcGIS Online Subscription Required) saved on ESRI’s servers.
| ||||||
Map ScaleShows and sets the scale for the active data frame. Scales can be typed into the box (you can skip the “1:”) and set with the enter key or the dropdown can be used to select a pre-set scale level (or set a custom level) | ||||||
Editor ToolbarThe editor toolbar button toggles the Editor toolbar on and off. | ||||||
Table of ContentsToggles the Table of Contents on and off. If the Table of Contents was closed, use this button to get it back. | ||||||
Catalog WindowToggles the Catalog window on and off. If the Catalog window was closed, use this button to get it back. | ||||||
Search WindowToggles the Search window on and off. If the Search window was closed, use this button to get it back. | ||||||
ArcToolboxToggles the ArcToolbox window on and off. If the ArcToolbox was closed, use this button to get it back. | ||||||
Python WindowOpens the Python window to enter and run commands. | ||||||
Model BuilderOpens the Model Builder window to build, edit, save, and run models. |
Tools Toolbar
The ‘Tools Toolbar’ is one of the four common toolbars in ArcGIS. This toolbar includes things like zoom, pan, select by shape, and measure.
Zoom In/Zoom Out
| ||||
Pan
| ||||
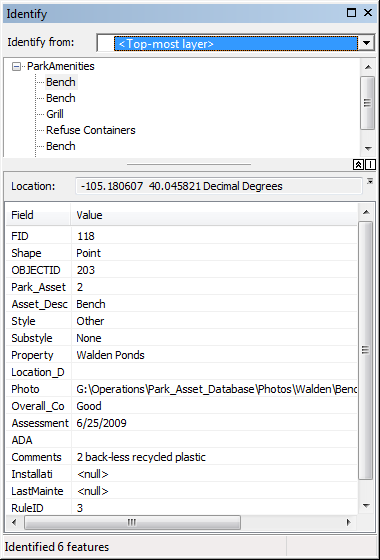
Identify
| ||||
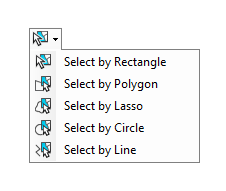
Select Features
| ||||
Clear Selected
| ||||
Go to Previous/Next Extent
| ||||
Select Elements
| ||||
Fixed Zoom In/Fixed Zoom Out
| ||||
Full Extent
| ||||
Measure
| ||||
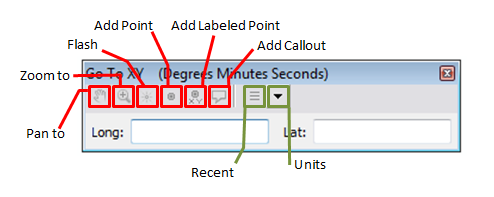
Go to XY
Used to jump to a specific point on the map.
Supported coordinate forms (Units, above - found under the drop down arrow):
Once a coordinate pair is defined, the tool allows you to:
| ||||
Editing and the Editor Toolbar
Editing is the ability to create and change vector and tabular (table) data within ArcMap. Data does not always exist or may not always correct, and the only way to make or fix it is with editing.
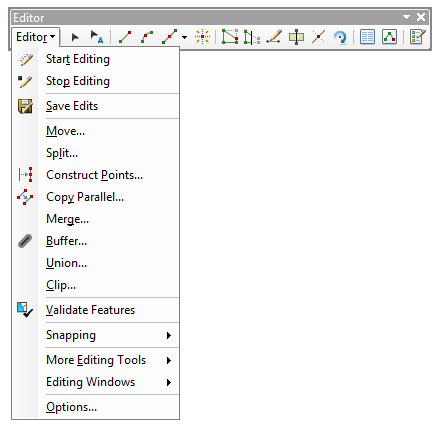
Editor Menu
| ||
Edit Tool
| ||
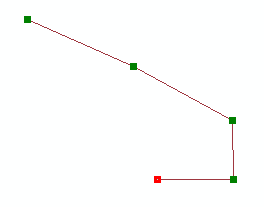
Straight Segment
Used to create lines. Each click puts down one vertex, then connects a straight line to the next vertex clicked.
| ||
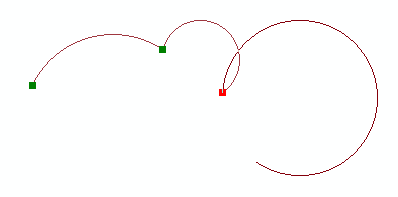
End Point Arc Segment
| ||
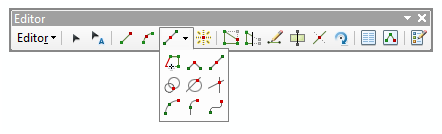
Segment Creation ToolsA variety of line creation tools are available to digitize higher quality data.
| ||
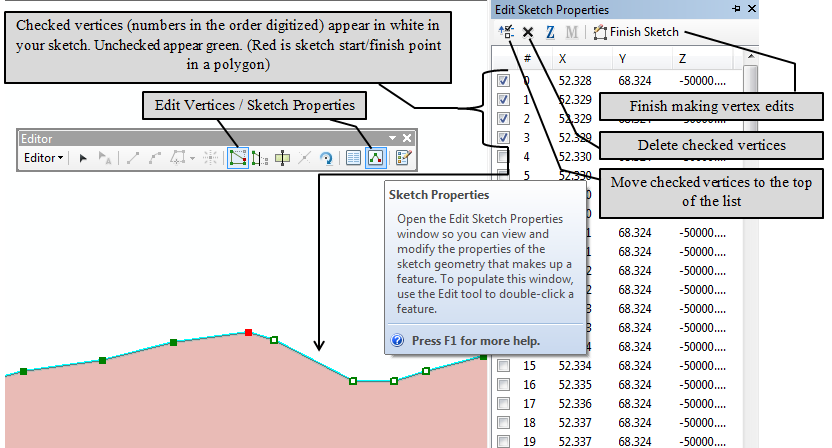
Edit Vertices
 | ||
Reshape Feature Tool
 | ||
Continue Feature ToolThe continue feature allows the user to continue a feature which has been completed as though they were still editing | ||
Cut Polygon Tool | ||
Split Tool | ||
Rotate Tool | ||
Attributes WindowOpens the attribute window to allow a user to enter the attributes for the currently selected/being edited feature | ||
Sketch Properties
| ||
Create Features WindowToggles the ‘Create Features’ window on and off. Use this button if you’ve X’d your window closed and it will not automatically appear when you begin an edit session. |