Next to heads-up digitizing The action of creating vector data in any sort of digital science or art, is simply denoting a type of graphical representation using straight lines to construct the outlines of objects by defining the location of each vertex pl. vertices One of a set of ordered x,y coordinate pairs that defines the shape of a line or polygon feature. utilizing drawing pad and puck (manual or hardcopy digitizing) or a computer with a mouse (heads-up or on-screen digitizing) while, most often, looking at and tracing aerial or satellite imagery. , collecting data in the field and importing into a GIS Geographic Information Systems the software used to create, store, and manage spatial data Data that deals with location, such as lists of addresses, the footprint of a building, the boundaries of cities and counties, etc. , analyze spatial problems, and display the data in cartographic layouts Geographic Information Sciences software is the second most common way to create new data. The ability to collect points, polylines, and polygons in the field in an efficient and accurate manner is an extremely important task in GIS Geographic Information Systems the software used to create, store, and manage spatial data Data that deals with location, such as lists of addresses, the footprint of a building, the boundaries of cities and counties, etc. , analyze spatial problems, and display the data in cartographic layouts Geographic Information Sciences . This task can be accomplished with high-dollar consumer mapping GPS Global Positioning System: A satellite-based navigation system owned and operated by the United States Department of Defense that provides location and time information anywhere on Earth. receivers or, gaining in popularity due to a lower cost and a shallower learning curve, GPS Global Positioning System: A satellite-based navigation system owned and operated by the United States Department of Defense that provides location and time information anywhere on Earth. collection apps for smartphones. Still in the heads-up digitizing The action of creating vector data in any sort of digital science or art, is simply denoting a type of graphical representation using straight lines to construct the outlines of objects by defining the location of each vertex pl. vertices One of a set of ordered x,y coordinate pairs that defines the shape of a line or polygon feature. utilizing drawing pad and puck (manual or hardcopy digitizing) or a computer with a mouse (heads-up or on-screen digitizing) while, most often, looking at and tracing aerial or satellite imagery. category, but without the use of commercial GIS Geographic Information Systems the software used to create, store, and manage spatial data Data that deals with location, such as lists of addresses, the footprint of a building, the boundaries of cities and counties, etc. , analyze spatial problems, and display the data in cartographic layouts Geographic Information Sciences software,
6.3.2: GPS Global Positioning System: A satellite-based navigation system owned and operated by the United States Department of Defense that provides location and time information anywhere on Earth. (Global Positioning Systems)
GPS Global Positioning System: A satellite-based navigation system owned and operated by the United States Department of Defense that provides location and time information anywhere on Earth. units come in all shapes, sizes, and accuracies (and directly related, costs). They can range from thousands of dollars with real-time accuracy down to centimeters to a few hundred dollars with an accuracy of 10-50 feet. Just as GIS Geographic Information Systems the software used to create, store, and manage spatial data Data that deals with location, such as lists of addresses, the footprint of a building, the boundaries of cities and counties, etc. , analyze spatial problems, and display the data in cartographic layouts Geographic Information Sciences is a rather young science, the ability to collect quality data in the field with GPS Global Positioning System: A satellite-based navigation system owned and operated by the United States Department of Defense that provides location and time information anywhere on Earth. units is just as new.
| Selective Availability | |
|---|---|
|
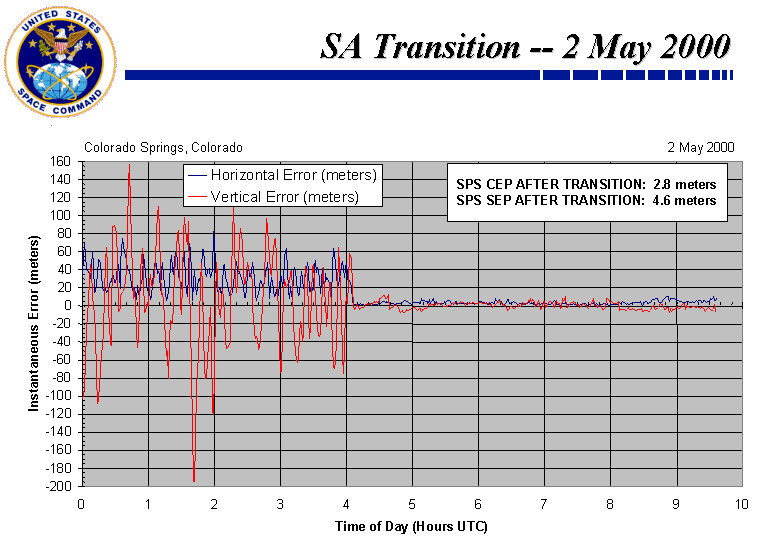
Fearing military adversaries might use the GPS Global Positioning System: A satellite-based navigation system owned and operated by the United States Department of Defense that provides location and time information anywhere on Earth. system to advantage, the Defense Department decides to deliberately decrease the accuracy of the system. By the early 1990s, civilians could buy GPS Global Positioning System: A satellite-based navigation system owned and operated by the United States Department of Defense that provides location and time information anywhere on Earth. equipment that was accurate within only about 300 feet. This inaccuracy was due to the deliberate distortion of the signal in order to prevent civilian gear from being used in a military attack on the U.S. This was called Selective Availability (SA). |
|
|
On May 1, 2000, President Clinton signed an order ending SA as part of an on-going effort to make GPS Global Positioning System: A satellite-based navigation system owned and operated by the United States Department of Defense that provides location and time information anywhere on Earth. more attractive to civil and commercial users worldwide. Now, GPS Global Positioning System: A satellite-based navigation system owned and operated by the United States Department of Defense that provides location and time information anywhere on Earth. is accurate within 40 feet, or much better. Military GPS Global Positioning System: A satellite-based navigation system owned and operated by the United States Department of Defense that provides location and time information anywhere on Earth. is even more precise and has a margin of error of only a few centimeters. The end of Selective Availability was a major turning point A GIS vector data in any sort of digital science or art, is simply denoting a type of graphical representation using straight lines to construct the outlines of objects geometry type which is made up of just one vertex pl. vertices One of a set of ordered x,y coordinate pairs that defines the shape of a line or polygon feature. , marking a single XY location in any given geographic or projected coordinate system. that has helped GPS Global Positioning System: A satellite-based navigation system owned and operated by the United States Department of Defense that provides location and time information anywhere on Earth. to become a global utility, now being used around the world in many different applications. After the attacks of September 11the, the industry buzzed over the possibility of a return to SA. However, on Sept. 17, 2001, the Interagency GPS Global Positioning System: A satellite-based navigation system owned and operated by the United States Department of Defense that provides location and time information anywhere on Earth. Executive Board (IGEB), which governed the GPS Global Positioning System: A satellite-based navigation system owned and operated by the United States Department of Defense that provides location and time information anywhere on Earth. system at that time, announced the United States has no intent to ever use Selective Availability again. |
 |
6.3.3: ArcPad, Field Maps, and Survey 123
ArcPad
ArcPad is a mobile version of ArcGIS which can be installed on a commercial mapping GPS Global Positioning System: A satellite-based navigation system owned and operated by the United States Department of Defense that provides location and time information anywhere on Earth. receiver or tablet running Windows, providing many of the same features found in the desktop version. Most often, a GIS Geographic Information Systems the software used to create, store, and manage spatial data Data that deals with location, such as lists of addresses, the footprint of a building, the boundaries of cities and counties, etc. , analyze spatial problems, and display the data in cartographic layouts Geographic Information Sciences technician creates a geodatabase electronic storage container specifically used to store geographic/ spatial data Data that deals with location, such as lists of addresses, the footprint of a building, the boundaries of cities and counties, etc. with a top-down structure in which the items contained are related to each other and that relationship allows for the data to be quickly and efficiently queried and retrieved for use. containing predefined feature classes and sets default values for the attribute table to make field collection a snap. For example, in order to send out a field crew ready to collect accurately and efficiently, the GIS Geographic Information Systems the software used to create, store, and manage spatial data Data that deals with location, such as lists of addresses, the footprint of a building, the boundaries of cities and counties, etc. , analyze spatial problems, and display the data in cartographic layouts Geographic Information Sciences technician will create a geodatabase electronic storage container specifically used to store geographic/ spatial data Data that deals with location, such as lists of addresses, the footprint of a building, the boundaries of cities and counties, etc. with a top-down structure in which the items contained are related to each other and that relationship allows for the data to be quickly and efficiently queried and retrieved for use. containing a point A GIS vector data in any sort of digital science or art, is simply denoting a type of graphical representation using straight lines to construct the outlines of objects geometry type which is made up of just one vertex pl. vertices One of a set of ordered x,y coordinate pairs that defines the shape of a line or polygon feature. , marking a single XY location in any given geographic or projected coordinate system. feature class One of the two main types of vector data in any sort of digital science or art, is simply denoting a type of graphical representation using straight lines to construct the outlines of objects we learn in this class (there are more than two vector data in any sort of digital science or art, is simply denoting a type of graphical representation using straight lines to construct the outlines of objects types in GIS). Feature classes are each only one geometry type, either a point A GIS vector data in any sort of digital science or art, is simply denoting a type of graphical representation using straight lines to construct the outlines of objects geometry type which is made up of just one vertex pl. vertices One of a set of ordered x,y coordinate pairs that defines the shape of a line or polygon feature. , marking a single XY location in any given geographic or projected coordinate system. , a polyline A GIS vector data in any sort of digital science or art, is simply denoting a type of graphical representation using straight lines to construct the outlines of objects geometry type which is made up of two or more vertices connected by straight lines. Often used to represent objects such as roads, river, and boundaries. , or a polygon. Feature classes are stored in geodatabases and are most often used when data relationships are important. for trees with dropdown lists for the tress species, health, and size; a polyline A GIS vector data in any sort of digital science or art, is simply denoting a type of graphical representation using straight lines to construct the outlines of objects geometry type which is made up of two or more vertices connected by straight lines. Often used to represent objects such as roads, river, and boundaries. feature class One of the two main types of vector data in any sort of digital science or art, is simply denoting a type of graphical representation using straight lines to construct the outlines of objects we learn in this class (there are more than two vector data in any sort of digital science or art, is simply denoting a type of graphical representation using straight lines to construct the outlines of objects types in GIS). Feature classes are each only one geometry type, either a point A GIS vector data in any sort of digital science or art, is simply denoting a type of graphical representation using straight lines to construct the outlines of objects geometry type which is made up of just one vertex pl. vertices One of a set of ordered x,y coordinate pairs that defines the shape of a line or polygon feature. , marking a single XY location in any given geographic or projected coordinate system. , a polyline A GIS vector data in any sort of digital science or art, is simply denoting a type of graphical representation using straight lines to construct the outlines of objects geometry type which is made up of two or more vertices connected by straight lines. Often used to represent objects such as roads, river, and boundaries. , or a polygon. Feature classes are stored in geodatabases and are most often used when data relationships are important. for trails with dropdown lists for the trail material type, trail width, and trail quality assessment; and a polygon feature class One of the two main types of vector data in any sort of digital science or art, is simply denoting a type of graphical representation using straight lines to construct the outlines of objects we learn in this class (there are more than two vector data in any sort of digital science or art, is simply denoting a type of graphical representation using straight lines to construct the outlines of objects types in GIS). Feature classes are each only one geometry type, either a point A GIS vector data in any sort of digital science or art, is simply denoting a type of graphical representation using straight lines to construct the outlines of objects geometry type which is made up of just one vertex pl. vertices One of a set of ordered x,y coordinate pairs that defines the shape of a line or polygon feature. , marking a single XY location in any given geographic or projected coordinate system. , a polyline A GIS vector data in any sort of digital science or art, is simply denoting a type of graphical representation using straight lines to construct the outlines of objects geometry type which is made up of two or more vertices connected by straight lines. Often used to represent objects such as roads, river, and boundaries. , or a polygon. Feature classes are stored in geodatabases and are most often used when data relationships are important. for large area invasive species with dropdown menus for species name, patch aggressiveness, and urgency to address the area.
Within ArcGIS, we predefine the dropdown lists of values utilizing the concept of geodatabase electronic storage container specifically used to store geographic/ spatial data Data that deals with location, such as lists of addresses, the footprint of a building, the boundaries of cities and counties, etc. with a top-down structure in which the items contained are related to each other and that relationship allows for the data to be quickly and efficiently queried and retrieved for use. data domains, or a limited list of values that specific attribute table fields can contain. Geodatabase data domains can be either a list of user defined values (good, better, best; elm, maple, oak) or a range of values (1-10; 5-50). This method allows the field technician to collect features with attribute values more efficiently by using dropdown lists vs typing in the values one at a time with an on-screen keyboard. Imagine typing “Elm Tree” with a stylus on a tiny little digital keyboard 305 times a day! Hooray for geodatabase electronic storage container specifically used to store geographic/ spatial data Data that deals with location, such as lists of addresses, the footprint of a building, the boundaries of cities and counties, etc. with a top-down structure in which the items contained are related to each other and that relationship allows for the data to be quickly and efficiently queried and retrieved for use. data domains!
| Figure 6.9: ArcPad | |
|---|---|
 |
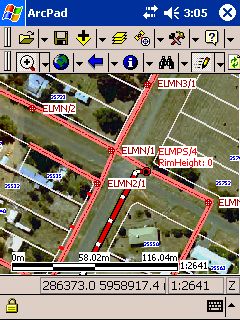 |
| A Trimble GPS Global Positioning System: A satellite-based navigation system owned and operated by the United States Department of Defense that provides location and time information anywhere on Earth. unit running ArcPad | ArcPad Screenshot |
Smartphone and Tablet Apps
Several free and low-cost apps are available for all the major smartphone and tablet operating systems (some better then others, obviously). These mobile GIS Geographic Information Systems the software used to create, store, and manage spatial data Data that deals with location, such as lists of addresses, the footprint of a building, the boundaries of cities and counties, etc. , analyze spatial problems, and display the data in cartographic layouts Geographic Information Sciences apps have done two things for the GIS Geographic Information Systems the software used to create, store, and manage spatial data Data that deals with location, such as lists of addresses, the footprint of a building, the boundaries of cities and counties, etc. , analyze spatial problems, and display the data in cartographic layouts Geographic Information Sciences community. First, they have put GIS Geographic Information Systems the software used to create, store, and manage spatial data Data that deals with location, such as lists of addresses, the footprint of a building, the boundaries of cities and counties, etc. , analyze spatial problems, and display the data in cartographic layouts Geographic Information Sciences into the hands of the “non-geo geek”, that is to say, those without some sort of formal or structured GIS Geographic Information Systems the software used to create, store, and manage spatial data Data that deals with location, such as lists of addresses, the footprint of a building, the boundaries of cities and counties, etc. , analyze spatial problems, and display the data in cartographic layouts Geographic Information Sciences training. Anyone who would like to make a map of their favorite running path can use an app as simple as “Map My Run”, or a more complex app such as Wolf GIS Geographic Information Systems the software used to create, store, and manage spatial data Data that deals with location, such as lists of addresses, the footprint of a building, the boundaries of cities and counties, etc. , analyze spatial problems, and display the data in cartographic layouts Geographic Information Sciences to begin to develop a complex online map showing not only their favorite running path, but terrain maps, weather patterns, and vegetation type polygons.
Second, many companies are beginning to ditch their expensive GPS Global Positioning System: A satellite-based navigation system owned and operated by the United States Department of Defense that provides location and time information anywhere on Earth. units and replace them with cellular/wifi enabled GPS Global Positioning System: A satellite-based navigation system owned and operated by the United States Department of Defense that provides location and time information anywhere on Earth. smartphones and tablets, as well as a more recent movement of tablets with true off-line GPS Global Positioning System: A satellite-based navigation system owned and operated by the United States Department of Defense that provides location and time information anywhere on Earth. receivers. Plugin and Bluetooth GPS Global Positioning System: A satellite-based navigation system owned and operated by the United States Department of Defense that provides location and time information anywhere on Earth. receivers can turn any smartphone or tablet into a field-ready GPS Global Positioning System: A satellite-based navigation system owned and operated by the United States Department of Defense that provides location and time information anywhere on Earth. unit - with the additional benefits of a tablet such as word processors and electronic spreadsheets.
Esri, the makers of ArcGIS, have released a couple of smarthpone and tablet apps over the years, but more recently has developed and released two major apps: Collector and Survey 1, 2, 3. Collector is a version of ArcPad, and the trend seems to be that Esri is attempting to phase out ArcPad in favor of the very similar but multi-platform Collector. Instead of running on only a Windows based tablet or GPS Global Positioning System: A satellite-based navigation system owned and operated by the United States Department of Defense that provides location and time information anywhere on Earth. receiver, Collector is a free1 app which runs on Windows, iOS, and Android, making it a more inviting choice for many companies and agencies. Currently, the features of Collector are not yet equal to those of ArcPad, which has a much longer development history in comparison.
Survey 1, 2, 3 is another multi-platform app from Esri more focused on use by citizen scientists. Even though the back end data creation and deployment is the same for the GIS Geographic Information Systems the software used to create, store, and manage spatial data Data that deals with location, such as lists of addresses, the footprint of a building, the boundaries of cities and counties, etc. , analyze spatial problems, and display the data in cartographic layouts Geographic Information Sciences technician, the end user doesn't need any experience with GIS Geographic Information Systems the software used to create, store, and manage spatial data Data that deals with location, such as lists of addresses, the footprint of a building, the boundaries of cities and counties, etc. , analyze spatial problems, and display the data in cartographic layouts Geographic Information Sciences to use the app. More focused on attribute collection via a from, Survey 1, 2, 3 can be used to collect data by a team of volunteers, such as raptor sightings, stream crossings, and items which may need to attention of a City Works department, to name just a few. Survey 1, 2, 3 is a bridge between GIS Geographic Information Systems the software used to create, store, and manage spatial data Data that deals with location, such as lists of addresses, the footprint of a building, the boundaries of cities and counties, etc. , analyze spatial problems, and display the data in cartographic layouts Geographic Information Sciences and the citizen, closer to crowdsourcing Geospatial Science: Refers to the collection, creation, or validation of geographic data by a large group of distributed contributors, typically volunteers, rather than by professional cartographers or official agencies. than to GIS Geographic Information Systems the software used to create, store, and manage spatial data Data that deals with location, such as lists of addresses, the footprint of a building, the boundaries of cities and counties, etc. , analyze spatial problems, and display the data in cartographic layouts Geographic Information Sciences data collection.
6.3.4: Crowdsourcing
Crowdsourcing is a method of data collection where the project designer turns the project loose on the internet community at large. Large scale projects which might be considered ‘impossible’ one one person or a small team of people, suddenly becomes attainable when a large amount of people contribute. In GIS Geographic Information Systems the software used to create, store, and manage spatial data Data that deals with location, such as lists of addresses, the footprint of a building, the boundaries of cities and counties, etc. , analyze spatial problems, and display the data in cartographic layouts Geographic Information Sciences and Remote Sensing, crowdsourcing Geospatial Science: Refers to the collection, creation, or validation of geographic data by a large group of distributed contributors, typically volunteers, rather than by professional cartographers or official agencies. is used to find points, polylines, and polygons in series of photos, such as burned buildings after a wildfire to assess damage, digitize missing roads after a major natural disaster to assist emergency workers, and helping to find missing airplanes.
Two geospatial crowdsourcing Geospatial Science: Refers to the collection, creation, or validation of geographic data by a large group of distributed contributors, typically volunteers, rather than by professional cartographers or official agencies. efforts are the Tomnod project and Open Street Maps. According the the Open Street Map website:
OpenStreetMap is built by a community of mappers that contribute and maintain data about roads, trails, cafés, railway stations, and much more, all over the world.
Local Knowledge: OpenStreetMap emphasizes local knowledge. Contributors use aerial imagery, GPS Global Positioning System: A satellite-based navigation system owned and operated by the United States Department of Defense that provides location and time information anywhere on Earth. devices, and low-tech field maps to verify that OSM is accurate and up to date.
Community Driven: OpenStreetMap’s community is diverse, passionate, and growing every day. Our contributors include enthusiast mappers, GIS Geographic Information Systems the software used to create, store, and manage spatial data Data that deals with location, such as lists of addresses, the footprint of a building, the boundaries of cities and counties, etc. , analyze spatial problems, and display the data in cartographic layouts Geographic Information Sciences professionals, engineers running the OSM servers, humanitarians mapping disaster-affected areas, and many more. To learn more about the community, see the user diaries, community blogs, and the OSM Foundation website.
Open Data: OpenStreetMap is open data: you are free to use it for any purpose as long as you credit OpenStreetMap and its contributors. If you alter or build upon the data in certain ways, you may distribute the result only under the same license.
The Open Street Map Project
and the Tomnod website
Tomnod is a team of volunteers (like you!) who work together to identify important objects and interesting places in satellite images. Use Tomnod to explore the Earth, solve real-world problems, and view amazing images of our changing planet. With the help of millions of volunteer contributions, we fulfill our purpose of seeing a better world.
Tomnod Website
You can, with little to no GIS Geographic Information Systems the software used to create, store, and manage spatial data Data that deals with location, such as lists of addresses, the footprint of a building, the boundaries of cities and counties, etc. , analyze spatial problems, and display the data in cartographic layouts Geographic Information Sciences skills or experience, contribute to either project. You are encouraged at this point A GIS vector data in any sort of digital science or art, is simply denoting a type of graphical representation using straight lines to construct the outlines of objects geometry type which is made up of just one vertex pl. vertices One of a set of ordered x,y coordinate pairs that defines the shape of a line or polygon feature. , marking a single XY location in any given geographic or projected coordinate system. to visit the Tomnod site, set up an account, and spend a few minutes "arc minute" 1/60th of a degree. Usually denoted by " looking for the object at large. It’s really easy to do and an excellent introduction to digitization.