In the last section, we examined the basic structure of attribute table. In this section, we will look at three main areas of the attribute table: the Field Header Menu, the Table Options Menu, and the Table Action Buttons.
This is yet another section of the book where you're not being asked to memorize a series of software features, but you are stopping by some of the items in each menu to help introduce you to the topic. By looking at some of the features in the Table Options menu, such as looking for data somewhere in the entire table, vs some features of the Field Header menu, such as a way to add up all the values found in a columns of numbers, you'll be better prepared to interact with the software in a meaningful way.
| The Table Options Menu | The Field Header Menu | The Table Action Buttons |
 |
 |
 |
|
The Table Options menu, found via the button in the upper left corner of the attribute table, is one of two main menus found in the attribute table. In general, the Table Options menu contains actions which effect the whole table, such as adding new fields ( GIS Geographic Information Systems the software used to create, store, and manage spatial data, analyze spatial problems, and display the data in cartographic layouts Geographic Information Sciences for columns), searching for and returning data in the entire table, and exporting the entire table for further data exploration in a software like Excel (the last one is an advanced action, but it is possible). Remember that the definition of a database electronic storage container with a top-down structure in which the items contained are related to each other and that relationship allows for the data to be quickly and efficiently queried and retrieved for use. was focused on the idea that the data can be returned quickly and efficiently? The applies here because ArcGIS is an RDMS relational database electronic storage container with a top-down structure in which the items contained are related to each other and that relationship allows for the data to be quickly and efficiently queried and retrieved for use. management system , capable of displaying spatial and non-spatial data Attributes related to a location but not describing its physical placement in space, such as information about a tree's age, type, and health. in a meaningful way. Attribute tables are database electronic storage container with a top-down structure in which the items contained are related to each other and that relationship allows for the data to be quickly and efficiently queried and retrieved for use. tables, and a whole lot of our job as a GIS Geographic Information Systems the software used to create, store, and manage spatial data, analyze spatial problems, and display the data in cartographic layouts Geographic Information Sciences technician revolves around the ability to find and return records in the table. The Table Options menu leads us to that goal. Tasks in the Table Option menu include:
|
The Field Header menu, accessed by right clicking on a field name, is the second of two main menus found in the attribute table. In general, the Field Header menu contains actions which effect only that field. Between the Table Options menu and the Field Header menu, the latter is definitely the more used menu. Tasks in this menu include:
|
Table Action buttons are shortcut buttons for the most common table actions. Just for convenience, all the the actions found in the Table Action buttons can be found in other menus. These buttons can:
|
5.3.2: Table Options Menu
Found by clicking the button in the upper left corner of the attribute table, the Table Options menu contains actions which affect the entire table, such as adding a field, selecting data from the table, turning all the hidden fields back on, and restoring field widths after adjustment. While it's been said that there is no current need to memorize how to accomplish specific tasks in the software - which continues to remain true while you're reading this section, there are some things about attribute table structure, and thus the Table Options menu, that you do need to learn, such as the fact that what you see in the table is more or less not permanent (there are a few fields which cannot be deleted or altered since the result would be destructive to your data) and the types of data fields available.
Adding New Fields
Since we have said that table structure isn't a permanent thing, that means that we can both add and delete entire fields and alter the contents of the records within those fields. Before data can be added to a new field, it must first be added to the table (via the Table Options menu), be given a name, and set to accept values of one type of data.
When it comes to table structure, something you do need to "know" is that based on the rules of a database electronic storage container with a top-down structure in which the items contained are related to each other and that relationship allows for the data to be quickly and efficiently queried and retrieved for use. , all fields have a name or a field header which is unique and follows the ArcGIS naming rules (no spaces, no characters other than an underscore, do not start the field name with a number or underscore). Each field header should, for good practice, have a meaningful field name which is ten characters or less (64 characters for a new field within a feature class One of the two main types of vector data in any sort of digital science or art, is simply denoting a type of graphical representation using straight lines to construct the outlines of objects we learn in this class (there are more than two vector data in any sort of digital science or art, is simply denoting a type of graphical representation using straight lines to construct the outlines of objects types in GIS). Feature classes are each only one geometry type, either a point A GIS vector data in any sort of digital science or art, is simply denoting a type of graphical representation using straight lines to construct the outlines of objects geometry type which is made up of just one vertex pl. vertices One of a set of ordered x,y coordinate pairs that defines the shape of a line or polygon feature. , marking a single XY location in any given geographic or projected coordinate system. , a polyline A GIS vector data in any sort of digital science or art, is simply denoting a type of graphical representation using straight lines to construct the outlines of objects geometry type which is made up of two or more vertices connected by straight lines. Often used to represent objects such as roads, river, and boundaries. , or a polygon. Feature classes are stored in geodatabases and are most often used when data relationships are important. associated with a geodatabase electronic storage container specifically used to store geographic/spatial data with a top-down structure in which the items contained are related to each other and that relationship allows for the data to be quickly and efficiently queried and retrieved for use. ). If you new field will be used for linear or area measurements, it’s a good idea to use the units in the field name, such as ROADS_FT. If you break the naming rules, ArcMap will give a warning and suggest a name.
| Figure 5.2: ArcGIS Warning for Creating an Invalid Field Name |
|---|
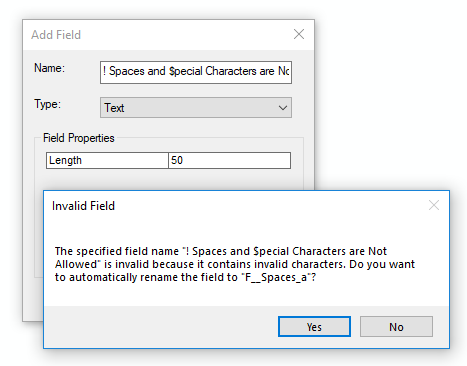 |
| Since spaces and special characters are not allowed, ArcMap attempts to suggest a field name which would not violate the naming rules. |
Field Types
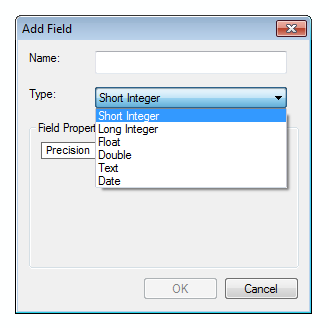
| Figure 5.3: Field Types | ||
|---|---|---|
 |
||
| Short Integer | Whole numbers; No decimal. Values must fall between -32,768 to 32,767 | |
| Long Integer | Whole numbers; No decimal. Values must fall between -2,147,483,648 to 2,147,483,647 | |
| Float | Short decimal numbers. Typically, the precision is 6 or less. | |
| Double | Long decimal numbers. Typically, the precision is 7 or more. | |
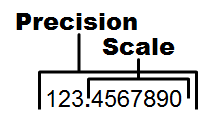 |
If you select “Float” or “Double”, you are offered the option to designate a precision and scale. Precision, in this case, is to total number of numbers while scale is the count of numbers after the decimal. | |
| Text (AKA ‘String’) |
Displays exactly what is entered in the box, regardless if it is a number, letter, or character. Defaults to limit of 255 characters. | |
| Date | Specifically for dates. Using date over text for dates allows ArcGIS to have a temporal, or time, component. Display can be formatted in several ways. | |
5.3.3: Field Header Menu
In general, the field header menu has actions which affect only the field that the menu was launched from, such as performing arithmetic on the field, adding or changing values within the records of that field, or permanently deleting that field.
Sorting Table Values
The one item in the Field Header menu we use frequently which might seem like it belongs in the Table Options menu is the ability to sort the entire table by one single field. The resulting action is the entire table sorts, but the initiating action is housed in a menu that is supposed to control only the actions of one field. For example, if we want to examine population data by state, it might be easiest to first sort the entire table by the state name. You would use the sort option in the State Name field header menu, but it would be totally useless if the other fields - including the population field you are interested in - didn't sort as well. If that was the case, you might get the population of California in the same row as the name for the Rhode Island! Talk about confusing!
|
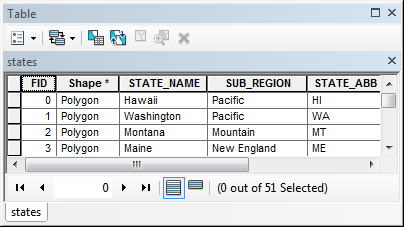
Much like when you are looking for a particular paper you wrote in Windows Explorer and you sort the contents of a folder by the file name (or term paper title in this case), being able to sort the contents of an attribute table is extremely important. Attribute tables default to sort by the FID (Feature Identifier), which is simply the order the features were added to the table, and likely has little other value in regards to the project at hand. If we add a States vector file we found online to a new ArcMap project and open the attribute table, we see the default order of features is based on the FID. |
 |
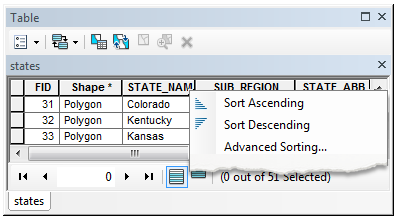 |
In this case, we see there are only 51 records (as noted by the count at the bottom of the attribute table window), so if we were to scroll through the list to find the state of “Colorado”, it wouldn’t be terribly challenging. After a few seconds arc minute. 1/60th of an arc minute; 1/3600 of a degree. Usually denoted by ' of scrolling, we find Colorado has an FID of “31”. |
|
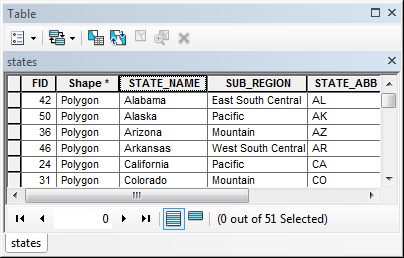
While scrolling through 31 records wasn’t challenging, it is defiantly the least efficient method we have to find records in an data table. Let’s sort the table alphabetically and ascending (seen above, in the same image where we scrolled to find that Colorado was feature number 31), which will make Colorado land in sixth place (based on the alphabet and not the FID). To sort the entire table alphabetically, numerically, or chronologically by any one field, such as sorting the States table by the STATE_NAME field, right click on the field header to open the field header menu and choose either sort ascending (A-Z) or descending (Z-A). The result is seen to the right, where the STATE_NAME field is showing in alphabetical order and the FID is out of numerical order. |
 |
Records and Arithmetic
Determining total values in a field is another task which is asked of you quite often. Knowing the total miles of roads with attributes designating them as dirt, finding the average height of all the trees in a cruised stands, or determining the highest flow value of a series of measured streams. Like finding the state name Colorado, we can scroll through all the values and add them up with a calculator, or search until you find the highest value in a column. Now you know you could even sort the table by descending value for the stream flow field, and it will be the first record in the list.
Attribute tables make the process so much easier by having a built-in function for adding a field of values, finding the average, noting the maximum and minimum value in that column, and stating the standard deviation. By right-clicking on a field name to open the field header menu, you are presented with two options to find the statistics of a particular field - Statistics and Summarize.
| Figure 5.4: Statistics and Summarize Found in the Field Header Menu |
|---|
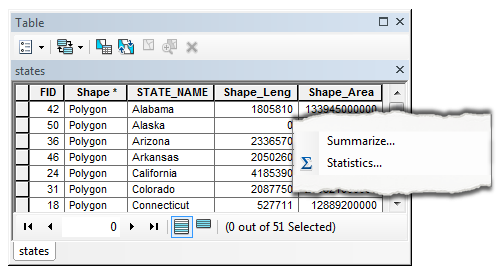 |
| The Field Header menu contains options for Statistics (quick stats about the field) and Summarize (produce a new table of those stats). Each one is used in different ways - Statistics for a quick note, Summarize for an output table. |
Both statistics and summarize perform almost the exact same task, with a few minor differences. For now, understand “Summarize” will create a new table which is saved to the computer and “Statistics” will create a quick chart and list of values such as sum, mean, and maximum. Use statistics when you just need to find out value totals, averages, and value counts; use summarize when you need to save the results for use later.
| Figure 5.5: The Results of the Statistics Tool |
|---|
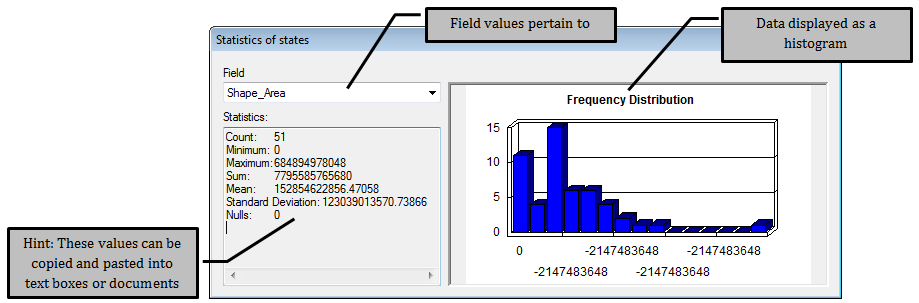 |
| The Statistics Tool provides a quick look at how numeric data is distributed over a single field - in this case, the Shape_Area field or measurements attributed to the area of each state. The "Field" dropdown menu shows us what field in the attribute table is being added/averaged, the Statistics box shows us the values, and the Frequency Distribution box shows us a histogram of how the data is distributed over all of the values. |
In regards to the Summarize tool, ArcGIS groups all fields into one of six ‘types’ - short integer, long integer, double, float, text (string), and date, which we read about above. Each field type has a different set of available options which can be performed with it with the Summarize tool, such as adding integers or creating a time-lapse effect with date. The text field, which is most often used for nominal values, allows you to enter any character in it without creating problems with the database electronic storage container with a top-down structure in which the items contained are related to each other and that relationship allows for the data to be quickly and efficiently queried and retrieved for use. . This means when you put numbers into a text type box they are no longer seen as numbers upon which arithmetic can be performed, but rather a character representing a value. To ArcGIS, the numeric character "3" entered into a text box is no different than writing out the word “three”. They are both characters representing a count of three items.
That being said, you will notice that if you open the field header menu for a text (string) field, , the option of “Statistics” will be grayed out and “Summarize” only offers options for “first” and “last” for fields which were created as type “text”.