Even as the amount of freely available digital GIS Geographic Information Systems the software used to create, store, and manage spatial data Data that deals with location, such as lists of addresses, the footprint of a building, the boundaries of cities and counties, etc. , analyze spatial problems, and display the data in cartographic layouts Geographic Information Sciences data grows exponentially, there are still plenty of times when GIS Geographic Information Systems the software used to create, store, and manage spatial data Data that deals with location, such as lists of addresses, the footprint of a building, the boundaries of cities and counties, etc. , analyze spatial problems, and display the data in cartographic layouts Geographic Information Sciences technicians must create new data from scratch. Sometimes you're faced with historical data that only exists on paper and needs to be digitized A term to describe data which was created through the act of digitizing The action of creating vector data in any sort of digital science or art, is simply denoting a type of graphical representation using straight lines to construct the outlines of objects by defining the location of each vertex pl. vertices One of a set of ordered x,y coordinate pairs that defines the shape of a line or polygon feature. utilizing drawing pad and puck (manual or hardcopy digitizing) or a computer with a mouse (heads-up or on-screen digitizing) while, most often, looking at and tracing aerial or satellite imagery. . Other times, field technicians collect data directly using GPS Global Positioning System: A satellite-based navigation system owned and operated by the United States Department of Defense that provides location and time information anywhere on Earth. units, smartphones, or tablets running data collection apps, which then gets imported into the GIS Geographic Information Systems the software used to create, store, and manage spatial data Data that deals with location, such as lists of addresses, the footprint of a building, the boundaries of cities and counties, etc. , analyze spatial problems, and display the data in cartographic layouts Geographic Information Sciences for analysis. And sometimes you need to create project-specific data to complete particular tasks. In the following section, we'll explore different methods of getting fresh data into your GIS Geographic Information Systems the software used to create, store, and manage spatial data Data that deals with location, such as lists of addresses, the footprint of a building, the boundaries of cities and counties, etc. , analyze spatial problems, and display the data in cartographic layouts Geographic Information Sciences .
6.2.1: Manual Digitizing
More prominent in the early days of computerized GIS Geographic Information Systems the software used to create, store, and manage spatial data Data that deals with location, such as lists of addresses, the footprint of a building, the boundaries of cities and counties, etc. , analyze spatial problems, and display the data in cartographic layouts Geographic Information Sciences , manual or hardcopy digitization was the best way to get maps from paper to digital form. While it's mostly disappeared from everyday workflows, you'll still encounter it in specific cases - usually when dealing with historical maps or archives.
The process uses either a pen-like object for tracing the map without leaving ink behind (called a stylus), or a computer mouse-like object called a puck or cursor. A plastic window with a printed crosshair and buttons with various controls assists the digitizer - the person making a digital copy of the map. The puck or stylus is attached to and used with a digitizing The action of creating vector data in any sort of digital science or art, is simply denoting a type of graphical representation using straight lines to construct the outlines of objects by defining the location of each vertex pl. vertices One of a set of ordered x,y coordinate pairs that defines the shape of a line or polygon feature. utilizing drawing pad and puck (manual or hardcopy digitizing) or a computer with a mouse (heads-up or on-screen digitizing) while, most often, looking at and tracing aerial or satellite imagery. table, a special grid-covered table that responds to the movements and clicks of the puck.
| Figure 6.1: Digitizing a Paper Map | |
|---|---|
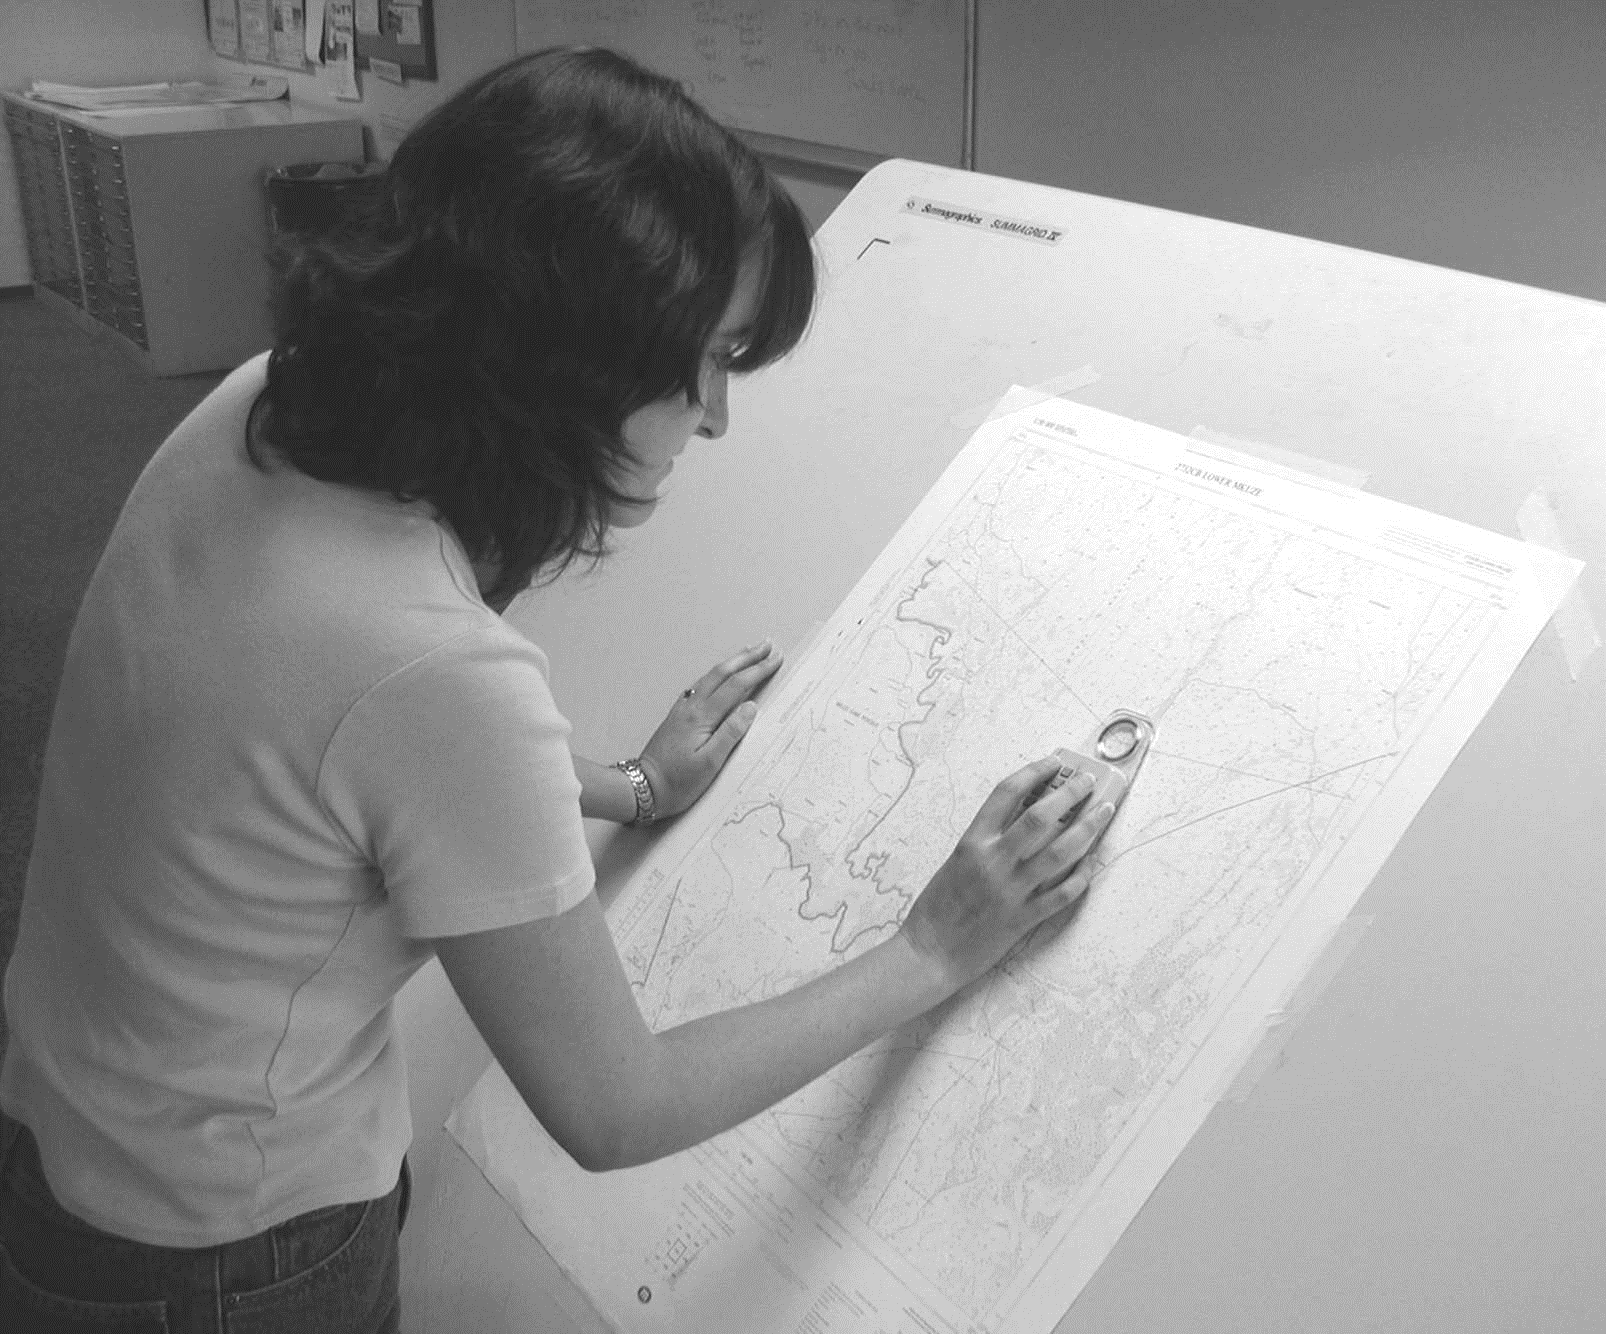 |  |
| In this image, we see a digitizer using a puck and a digitizing The action of creating vector data in any sort of digital science or art, is simply denoting a type of graphical representation using straight lines to construct the outlines of objects by defining the location of each vertex pl. vertices One of a set of ordered x,y coordinate pairs that defines the shape of a line or polygon feature. utilizing drawing pad and puck (manual or hardcopy digitizing) or a computer with a mouse (heads-up or on-screen digitizing) while, most often, looking at and tracing aerial or satellite imagery. table to create a digital version of the paper map. As she follows a line in the map (likely a road or a river) she keeps the feature in the crosshairs of the puck's window, using the proper buttons to create the feature on the computer. | Points, polylines, and polygons can all be digitized A term to describe data which was created through the act of digitizing The action of creating vector data in any sort of digital science or art, is simply denoting a type of graphical representation using straight lines to construct the outlines of objects by defining the location of each vertex pl. vertices One of a set of ordered x,y coordinate pairs that defines the shape of a line or polygon feature. utilizing drawing pad and puck (manual or hardcopy digitizing) or a computer with a mouse (heads-up or on-screen digitizing) while, most often, looking at and tracing aerial or satellite imagery. in the software using a digitizing The action of creating vector data in any sort of digital science or art, is simply denoting a type of graphical representation using straight lines to construct the outlines of objects by defining the location of each vertex pl. vertices One of a set of ordered x,y coordinate pairs that defines the shape of a line or polygon feature. utilizing drawing pad and puck (manual or hardcopy digitizing) or a computer with a mouse (heads-up or on-screen digitizing) while, most often, looking at and tracing aerial or satellite imagery. table. As the result is shapefile One of the two main types of vector data in any sort of digital science or art, is simply denoting a type of graphical representation using straight lines to construct the outlines of objects we learn in this class (there are more than two vector data in any sort of digital science or art, is simply denoting a type of graphical representation using straight lines to construct the outlines of objects types in GIS). Shapefiles are each only one geometry type, either a point, a polyline, or a polygon. Shapefiles are stored in folders and most often do not have relationships with other data. or feature class One of the two main types of vector data in any sort of digital science or art, is simply denoting a type of graphical representation using straight lines to construct the outlines of objects we learn in this class (there are more than two vector data in any sort of digital science or art, is simply denoting a type of graphical representation using straight lines to construct the outlines of objects types in GIS). Feature classes are each only one geometry type, either a point A GIS vector data in any sort of digital science or art, is simply denoting a type of graphical representation using straight lines to construct the outlines of objects geometry type which is made up of just one vertex pl. vertices One of a set of ordered x,y coordinate pairs that defines the shape of a line or polygon feature. , marking a single XY location in any given geographic or projected coordinate system. , a polyline A GIS vector data in any sort of digital science or art, is simply denoting a type of graphical representation using straight lines to construct the outlines of objects geometry type which is made up of two or more vertices connected by straight lines. Often used to represent objects such as roads, river, and boundaries. , or a polygon. Feature classes are stored in geodatabases and are most often used when data relationships are important. , the dot-to-dot analogy works for the idea of digitizing The action of creating vector data in any sort of digital science or art, is simply denoting a type of graphical representation using straight lines to construct the outlines of objects by defining the location of each vertex pl. vertices One of a set of ordered x,y coordinate pairs that defines the shape of a line or polygon feature. utilizing drawing pad and puck (manual or hardcopy digitizing) or a computer with a mouse (heads-up or on-screen digitizing) while, most often, looking at and tracing aerial or satellite imagery. . The digitizer uses the puck to establish the "dots" while the software "draws" the image. |
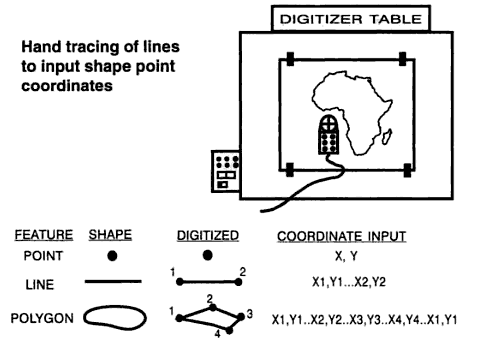
To complete the digitization process, the digitizer tapes a paper map to the digitizing The action of creating vector data in any sort of digital science or art, is simply denoting a type of graphical representation using straight lines to construct the outlines of objects by defining the location of each vertex pl. vertices One of a set of ordered x,y coordinate pairs that defines the shape of a line or polygon feature. utilizing drawing pad and puck (manual or hardcopy digitizing) or a computer with a mouse (heads-up or on-screen digitizing) while, most often, looking at and tracing aerial or satellite imagery. table and traces - or digitizes - the map features, using the appropriate button combinations to record the clicks and movements to the attached computer and its software. With the table grid responding to the puck under the paper map, the software converts the movements to digital features. Think about the game Battleship, where the object is to hide your Navy vessels on a grid from your opponent. They attempt to locate where on the grid your battleship lies by calling out game coordinates like B1 (row 1, column B), and you reply with Hit or Miss. Your opponent then places a Hit or Miss peg on their grid, noting whether there was an object at that location or not. When the digitizer marks a point A GIS vector data in any sort of digital science or art, is simply denoting a type of graphical representation using straight lines to construct the outlines of objects geometry type which is made up of just one vertex pl. vertices One of a set of ordered x,y coordinate pairs that defines the shape of a line or polygon feature. , marking a single XY location in any given geographic or projected coordinate system. along the grid of the digitizing The action of creating vector data in any sort of digital science or art, is simply denoting a type of graphical representation using straight lines to construct the outlines of objects by defining the location of each vertex pl. vertices One of a set of ordered x,y coordinate pairs that defines the shape of a line or polygon feature. utilizing drawing pad and puck (manual or hardcopy digitizing) or a computer with a mouse (heads-up or on-screen digitizing) while, most often, looking at and tracing aerial or satellite imagery. table as a Hit, the computer marks the same point A GIS vector data in any sort of digital science or art, is simply denoting a type of graphical representation using straight lines to construct the outlines of objects geometry type which is made up of just one vertex pl. vertices One of a set of ordered x,y coordinate pairs that defines the shape of a line or polygon feature. , marking a single XY location in any given geographic or projected coordinate system. in the software's grid with a "Hit peg". After enough hits, the software can connect the points to create a digital version of the paper map's features.
| Figure 6.2: The Board Game Battleship |
|---|
 |
| Similar to the board game Battleship, manual digitizing The action of creating vector data in any sort of digital science or art, is simply denoting a type of graphical representation using straight lines to construct the outlines of objects by defining the location of each vertex pl. vertices One of a set of ordered x,y coordinate pairs that defines the shape of a line or polygon feature. utilizing drawing pad and puck (manual or hardcopy digitizing) or a computer with a mouse (heads-up or on-screen digitizing) while, most often, looking at and tracing aerial or satellite imagery. records the "hits" the digitizer makes with the puck or stylus while turning a paper map into a digital product. |
6.2.3: Heads-Up or On-Screen Computer Digitizing
Manual digitization isn't completely obsolete - it's still handy when paper maps are too large or too damaged to scan into the GIS Geographic Information Systems the software used to create, store, and manage spatial data Data that deals with location, such as lists of addresses, the footprint of a building, the boundaries of cities and counties, etc. , analyze spatial problems, and display the data in cartographic layouts Geographic Information Sciences . Large maps can be challenging to piece back together within the GIS Geographic Information Systems the software used to create, store, and manage spatial data Data that deals with location, such as lists of addresses, the footprint of a building, the boundaries of cities and counties, etc. , analyze spatial problems, and display the data in cartographic layouts Geographic Information Sciences without introducing error, and damaged maps can lead to distortion of the map objects when scanned, such as if the map is torn and taped back together or if the map is very wrinkled.
As computers gained speed and power and fell in cost, they became easier to use and more common within companies and agencies. The need for digitizing The action of creating vector data in any sort of digital science or art, is simply denoting a type of graphical representation using straight lines to construct the outlines of objects by defining the location of each vertex pl. vertices One of a set of ordered x,y coordinate pairs that defines the shape of a line or polygon feature. utilizing drawing pad and puck (manual or hardcopy digitizing) or a computer with a mouse (heads-up or on-screen digitizing) while, most often, looking at and tracing aerial or satellite imagery. tables and trained digitizers began to diminish as heads-up or on-screen digitizing The action of creating vector data in any sort of digital science or art, is simply denoting a type of graphical representation using straight lines to construct the outlines of objects by defining the location of each vertex pl. vertices One of a set of ordered x,y coordinate pairs that defines the shape of a line or polygon feature. utilizing drawing pad and puck (manual or hardcopy digitizing) or a computer with a mouse (heads-up or on-screen digitizing) while, most often, looking at and tracing aerial or satellite imagery. became the more common way to create new digital layers, thanks to its speed, ease of use, and short training time.
Similar to manual digitizing The action of creating vector data in any sort of digital science or art, is simply denoting a type of graphical representation using straight lines to construct the outlines of objects by defining the location of each vertex pl. vertices One of a set of ordered x,y coordinate pairs that defines the shape of a line or polygon feature. utilizing drawing pad and puck (manual or hardcopy digitizing) or a computer with a mouse (heads-up or on-screen digitizing) while, most often, looking at and tracing aerial or satellite imagery. , with on-screen digitizing The action of creating vector data in any sort of digital science or art, is simply denoting a type of graphical representation using straight lines to construct the outlines of objects by defining the location of each vertex pl. vertices One of a set of ordered x,y coordinate pairs that defines the shape of a line or polygon feature. utilizing drawing pad and puck (manual or hardcopy digitizing) or a computer with a mouse (heads-up or on-screen digitizing) while, most often, looking at and tracing aerial or satellite imagery. , the GIS Geographic Information Systems the software used to create, store, and manage spatial data Data that deals with location, such as lists of addresses, the footprint of a building, the boundaries of cities and counties, etc. , analyze spatial problems, and display the data in cartographic layouts Geographic Information Sciences technician converts raster images into vector features by looking at the image loaded into the GIS Geographic Information Systems the software used to create, store, and manage spatial data Data that deals with location, such as lists of addresses, the footprint of a building, the boundaries of cities and counties, etc. , analyze spatial problems, and display the data in cartographic layouts Geographic Information Sciences , then uses a mouse (with a traditional computer setup) or stylus (with a touchscreen) to click and trace each feature or object in the image into a point A GIS vector data in any sort of digital science or art, is simply denoting a type of graphical representation using straight lines to construct the outlines of objects geometry type which is made up of just one vertex pl. vertices One of a set of ordered x,y coordinate pairs that defines the shape of a line or polygon feature. , marking a single XY location in any given geographic or projected coordinate system. , polygon, or polyline A GIS vector data in any sort of digital science or art, is simply denoting a type of graphical representation using straight lines to construct the outlines of objects geometry type which is made up of two or more vertices connected by straight lines. Often used to represent objects such as roads, river, and boundaries. feature class One of the two main types of vector data in any sort of digital science or art, is simply denoting a type of graphical representation using straight lines to construct the outlines of objects we learn in this class (there are more than two vector data in any sort of digital science or art, is simply denoting a type of graphical representation using straight lines to construct the outlines of objects types in GIS). Feature classes are each only one geometry type, either a point A GIS vector data in any sort of digital science or art, is simply denoting a type of graphical representation using straight lines to construct the outlines of objects geometry type which is made up of just one vertex pl. vertices One of a set of ordered x,y coordinate pairs that defines the shape of a line or polygon feature. , marking a single XY location in any given geographic or projected coordinate system. , a polyline A GIS vector data in any sort of digital science or art, is simply denoting a type of graphical representation using straight lines to construct the outlines of objects geometry type which is made up of two or more vertices connected by straight lines. Often used to represent objects such as roads, river, and boundaries. , or a polygon. Feature classes are stored in geodatabases and are most often used when data relationships are important. , using a method called "Creating Features" (clever, I know!). Each mouse click places a single vertex pl. vertices One of a set of ordered x,y coordinate pairs that defines the shape of a line or polygon feature. on the screen directly on top of the image, and we've already learned that the only purpose of a vertex pl. vertices One of a set of ordered x,y coordinate pairs that defines the shape of a line or polygon feature. is to mark a geographic coordinate pair as a single building block within a vector feature. For each point A GIS vector data in any sort of digital science or art, is simply denoting a type of graphical representation using straight lines to construct the outlines of objects geometry type which is made up of just one vertex pl. vertices One of a set of ordered x,y coordinate pairs that defines the shape of a line or polygon feature. , marking a single XY location in any given geographic or projected coordinate system. feature, the GIS Geographic Information Systems the software used to create, store, and manage spatial data Data that deals with location, such as lists of addresses, the footprint of a building, the boundaries of cities and counties, etc. , analyze spatial problems, and display the data in cartographic layouts Geographic Information Sciences technician places one vertex pl. vertices One of a set of ordered x,y coordinate pairs that defines the shape of a line or polygon feature. per feature, two or more vertices connected automatically by a line for polyline A GIS vector data in any sort of digital science or art, is simply denoting a type of graphical representation using straight lines to construct the outlines of objects geometry type which is made up of two or more vertices connected by straight lines. Often used to represent objects such as roads, river, and boundaries. features, and three or more for a closed polygon feature.
Digitizing features comes in two varieties: adding features to an existing shapefile One of the two main types of vector data in any sort of digital science or art, is simply denoting a type of graphical representation using straight lines to construct the outlines of objects we learn in this class (there are more than two vector data in any sort of digital science or art, is simply denoting a type of graphical representation using straight lines to construct the outlines of objects types in GIS). Shapefiles are each only one geometry type, either a point, a polyline, or a polygon. Shapefiles are stored in folders and most often do not have relationships with other data. or feature class One of the two main types of vector data in any sort of digital science or art, is simply denoting a type of graphical representation using straight lines to construct the outlines of objects we learn in this class (there are more than two vector data in any sort of digital science or art, is simply denoting a type of graphical representation using straight lines to construct the outlines of objects types in GIS). Feature classes are each only one geometry type, either a point A GIS vector data in any sort of digital science or art, is simply denoting a type of graphical representation using straight lines to construct the outlines of objects geometry type which is made up of just one vertex pl. vertices One of a set of ordered x,y coordinate pairs that defines the shape of a line or polygon feature. , marking a single XY location in any given geographic or projected coordinate system. , a polyline A GIS vector data in any sort of digital science or art, is simply denoting a type of graphical representation using straight lines to construct the outlines of objects geometry type which is made up of two or more vertices connected by straight lines. Often used to represent objects such as roads, river, and boundaries. , or a polygon. Feature classes are stored in geodatabases and are most often used when data relationships are important. , and adding features to a brand new shapefile One of the two main types of vector data in any sort of digital science or art, is simply denoting a type of graphical representation using straight lines to construct the outlines of objects we learn in this class (there are more than two vector data in any sort of digital science or art, is simply denoting a type of graphical representation using straight lines to construct the outlines of objects types in GIS). Shapefiles are each only one geometry type, either a point, a polyline, or a polygon. Shapefiles are stored in folders and most often do not have relationships with other data. or feature class One of the two main types of vector data in any sort of digital science or art, is simply denoting a type of graphical representation using straight lines to construct the outlines of objects we learn in this class (there are more than two vector data in any sort of digital science or art, is simply denoting a type of graphical representation using straight lines to construct the outlines of objects types in GIS). Feature classes are each only one geometry type, either a point A GIS vector data in any sort of digital science or art, is simply denoting a type of graphical representation using straight lines to construct the outlines of objects geometry type which is made up of just one vertex pl. vertices One of a set of ordered x,y coordinate pairs that defines the shape of a line or polygon feature. , marking a single XY location in any given geographic or projected coordinate system. , a polyline A GIS vector data in any sort of digital science or art, is simply denoting a type of graphical representation using straight lines to construct the outlines of objects geometry type which is made up of two or more vertices connected by straight lines. Often used to represent objects such as roads, river, and boundaries. , or a polygon. Feature classes are stored in geodatabases and are most often used when data relationships are important. . GIS Geographic Information Systems the software used to create, store, and manage spatial data Data that deals with location, such as lists of addresses, the footprint of a building, the boundaries of cities and counties, etc. , analyze spatial problems, and display the data in cartographic layouts Geographic Information Sciences technicians complete both tasks in fairly equal intervals. The process is exactly the same either way, with the exception that for a new file, the technician must create a new shapefile One of the two main types of vector data in any sort of digital science or art, is simply denoting a type of graphical representation using straight lines to construct the outlines of objects we learn in this class (there are more than two vector data in any sort of digital science or art, is simply denoting a type of graphical representation using straight lines to construct the outlines of objects types in GIS). Shapefiles are each only one geometry type, either a point, a polyline, or a polygon. Shapefiles are stored in folders and most often do not have relationships with other data. or feature class One of the two main types of vector data in any sort of digital science or art, is simply denoting a type of graphical representation using straight lines to construct the outlines of objects we learn in this class (there are more than two vector data in any sort of digital science or art, is simply denoting a type of graphical representation using straight lines to construct the outlines of objects types in GIS). Feature classes are each only one geometry type, either a point A GIS vector data in any sort of digital science or art, is simply denoting a type of graphical representation using straight lines to construct the outlines of objects geometry type which is made up of just one vertex pl. vertices One of a set of ordered x,y coordinate pairs that defines the shape of a line or polygon feature. , marking a single XY location in any given geographic or projected coordinate system. , a polyline A GIS vector data in any sort of digital science or art, is simply denoting a type of graphical representation using straight lines to construct the outlines of objects geometry type which is made up of two or more vertices connected by straight lines. Often used to represent objects such as roads, river, and boundaries. , or a polygon. Feature classes are stored in geodatabases and are most often used when data relationships are important. first.
When it comes time to create new vector layers, there isn't a specific set of rules about the right way to organize the data, but there are some rough, expected standards. In general, separate vector layers are often created for each feature or group of features to be collected. Examples could include a Rivers polyline A GIS vector data in any sort of digital science or art, is simply denoting a type of graphical representation using straight lines to construct the outlines of objects geometry type which is made up of two or more vertices connected by straight lines. Often used to represent objects such as roads, river, and boundaries. layer, a Roads polyline A GIS vector data in any sort of digital science or art, is simply denoting a type of graphical representation using straight lines to construct the outlines of objects geometry type which is made up of two or more vertices connected by straight lines. Often used to represent objects such as roads, river, and boundaries. layer, a Rails polyline A GIS vector data in any sort of digital science or art, is simply denoting a type of graphical representation using straight lines to construct the outlines of objects geometry type which is made up of two or more vertices connected by straight lines. Often used to represent objects such as roads, river, and boundaries. layer, and a Counties polygon layer. With the small size of vector files, it's a good idea to break things out as far as you can initially, since you can always combine layers together later on. For example, if you end up with separate Roads, Railways, and Freeways layers that all contain eight features each, you could merge them into a single "Transportation" layer with 24 features to organize the data without confusing the end-user, since roads, rails, and freeways are all types of transportation.
6.2.4: Aerial Photos and Satellite Imagery
The concept of digitizing The action of creating vector data in any sort of digital science or art, is simply denoting a type of graphical representation using straight lines to construct the outlines of objects by defining the location of each vertex pl. vertices One of a set of ordered x,y coordinate pairs that defines the shape of a line or polygon feature. utilizing drawing pad and puck (manual or hardcopy digitizing) or a computer with a mouse (heads-up or on-screen digitizing) while, most often, looking at and tracing aerial or satellite imagery. features really isn't that complicated - look at an image and trace features into a new or existing vector layer to later be used for vector analysis. But where do those images come from and how do technicians get them into the GIS Geographic Information Systems the software used to create, store, and manage spatial data Data that deals with location, such as lists of addresses, the footprint of a building, the boundaries of cities and counties, etc. , analyze spatial problems, and display the data in cartographic layouts Geographic Information Sciences ? These raster layers come from a separate but related geospatial science - Remote Sensing - and the products are aerial and satellite images. At this point A GIS vector data in any sort of digital science or art, is simply denoting a type of graphical representation using straight lines to construct the outlines of objects geometry type which is made up of just one vertex pl. vertices One of a set of ordered x,y coordinate pairs that defines the shape of a line or polygon feature. , marking a single XY location in any given geographic or projected coordinate system. , it's a fairly safe bet to assume that almost everyone taking this class has exposure to web maps like Google Maps and Google Earth, both of which utilize satellite images and classified rasters known as basemaps A foundational layer on a map that is the basis of GIS visual and geographic context. that show things like streets, buildings, parks, and schools in an illustrative manner - no longer a raw image, but also not vector features. Instead of showing you the actual satellite photo, basemaps A foundational layer on a map that is the basis of GIS visual and geographic context. are processed to show simplified, stylized representations of features that are easier to read and understand at a glance. These satellite images and basemaps A foundational layer on a map that is the basis of GIS visual and geographic context. are products of remote sensing that Google pays for to add context to their website and software.
Remote sensing, defined as collecting images from a distance without actually physically interacting with the landscape, is the primary way GIS Geographic Information Systems the software used to create, store, and manage spatial data Data that deals with location, such as lists of addresses, the footprint of a building, the boundaries of cities and counties, etc. , analyze spatial problems, and display the data in cartographic layouts Geographic Information Sciences technicians obtain imagery to use with heads-up digitizing The action of creating vector data in any sort of digital science or art, is simply denoting a type of graphical representation using straight lines to construct the outlines of objects by defining the location of each vertex pl. vertices One of a set of ordered x,y coordinate pairs that defines the shape of a line or polygon feature. utilizing drawing pad and puck (manual or hardcopy digitizing) or a computer with a mouse (heads-up or on-screen digitizing) while, most often, looking at and tracing aerial or satellite imagery. . Remotely sensed data is collected via aircraft or orbiting satellites, and the quality and type of image collected vary based on the vehicle carrying the sensor and the planned goal of the output. Some paid satellite imagery has very high spatial resolution Spatial resolution refers to the level of detail or granularity in an image or a spatial dataset. , or the ground distance shown along the side of one pixel The smallest unit of information in a digital image or raster map, usually square or rectangular. Often used synonymously with cell. Pixel is an abbreviation of "picture element". , like you'd see in Google Earth, while free imagery has lower spatial resolution Spatial resolution refers to the level of detail or granularity in an image or a spatial dataset. . High spatial resolution Spatial resolution refers to the level of detail or granularity in an image or a spatial dataset. means objects for digitizing The action of creating vector data in any sort of digital science or art, is simply denoting a type of graphical representation using straight lines to construct the outlines of objects by defining the location of each vertex pl. vertices One of a set of ordered x,y coordinate pairs that defines the shape of a line or polygon feature. utilizing drawing pad and puck (manual or hardcopy digitizing) or a computer with a mouse (heads-up or on-screen digitizing) while, most often, looking at and tracing aerial or satellite imagery. are shown in more detail and the result of creating classified rasters is a more accurate representation of the landscape, while lower spatial resolution Spatial resolution refers to the level of detail or granularity in an image or a spatial dataset. images may be more challenging to resolve - the ability to recognize, identify, and digitize features.
Both satellite images and aerial images can collect different kinds of energy - some visible, like you see and experience the world every day, and some invisible, like the heat coming off your stove. You can feel the heat if you hold your hand over the burner but you can't see the actual heat (you can see effects of the heat, like the metal turning red or the air above becoming visibly wavy, but those aren't the actual heat). The ability to collect these different kinds of energy and apply a visible color to them can teach us so many things about the world that we couldn't normally see, since our eyes are only capable of detecting and processing a very small amount of the energy that surrounds us every second of every day. Once we can look at the world through various lenses beyond our built-in ones, we can digitize all kinds of data and make decisions about things we never thought possible before.
Some of the most commonly used free satellite imagery comes from a long-running US Government program called Landsat, or the Land Satellite (there's also a program called SeaSat). With the first satellite launched in July 1972 and the eighth launched in February 2013, the photographic history of almost the entire surface of the Earth (to get the best images, the satellites are set to focus on the mid-latitudes and not take images of the poles) is both fascinating and a great addition to scientific history. Landsat images have a spatial resolution Spatial resolution refers to the level of detail or granularity in an image or a spatial dataset. of 30 meters for color images and 15 meters for panchromatic images - single-band black-and-white images that capture just brightness rather than color information. Panchromatic images typically have higher spatial resolution Spatial resolution refers to the level of detail or granularity in an image or a spatial dataset. than their color counterparts because the sensor can focus all its sensitivity on a single band rather than splitting it across multiple color channels. Satellite images have some awesome advantages over aerial images:
Temporal Resolution → Since the satellite passes the same place on Earth's surface on a set schedule, there's the ability to see change over a long period of time. For example, Landsat takes a picture of the same spot every 16 days.
Synoptic view → Since the satellite is so far away, it gives a whole new meaning to the phrase "bird's eye view", meaning the satellite can collect an image of a very large area at one time. For example, Landsat collects an image that is 185 km wide.
Low-cost → Once the satellite launches, as long as it functions properly, the cost per image is relatively low and falls every time the satellite orbits the Earth. If a satellite cost 855 million dollars to build and it collects only one image, that image cost 855 million dollars. By the time it collects 855 million images, they cost only a dollar apiece.
Collects different kinds of images at once → Satellites can collect color images, panchromatic images, and other categories such as infrared and thermal images all at the same time using different sensors. Infrared imagery is particularly useful for analyzing vegetation health - healthy plants reflect infrared energy strongly while stressed or dead vegetation doesn't, making it easy to spot problems invisible to the human eye. Thermal imagery detects heat signatures and can reveal temperature differences across the landscape, useful for everything from identifying heat loss in buildings to tracking wildfires to monitoring water temperatures in lakes and rivers.
| Figure 6.4: Examples of Remotely Sensed Images |
|---|
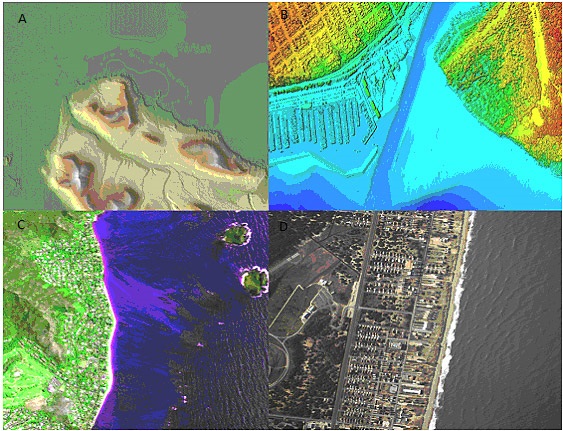 |
| Remotely sensed images of different coastlines. A. Interferometric Synthetic Aperture Radar (IFSAR) data (using microwaves to collect data for creating representative images), B. topographic and bathymetric lidar data (height and elevation the vertical distance between local mean sea level the measurement above or below the global average at a single point A GIS vector data in any sort of digital science or art, is simply denoting a type of graphical representation using straight lines to construct the outlines of objects geometry type which is made up of just one vertex pl. vertices One of a set of ordered x,y coordinate pairs that defines the shape of a line or polygon feature. , marking a single XY location in any given geographic or projected coordinate system. on the Earth's surface used for recording the elevation of topographic surface a detailed map of the surface features of land. It includes the mountains, hills, creeks, and other bumps and lumps on a particular hunk of earth. The word is a Greek-rooted combo of topos meaning "place" and graphein "to write." 's relief the difference between the highest and lowest point within a particular area while landforms are the descriptive words for individual features and a single point A GIS vector data in any sort of digital science or art, is simply denoting a type of graphical representation using straight lines to construct the outlines of objects geometry type which is made up of just one vertex pl. vertices One of a set of ordered x,y coordinate pairs that defines the shape of a line or polygon feature. , marking a single XY location in any given geographic or projected coordinate system. on the Earth's surface data represented by colors), C. hyperspectral imagery (adding color to invisible energy), and D. digital photography (human eye visible colors represented as themselves) |
Aerial photos - images collected by aircraft such as planes and helicopters - have some advantages and disadvantages when compared to satellite images, even though the products are the same. Since the camera is carried on an aircraft flown with the intent of collecting images, the scenes collected are targeted and the end-user doesn't need to wait for a particular orbit. But on the flip side, aerial images have a very high cost due to the fact that someone has to pay the pilot, the person operating the sensors, and for the fuel. Airplanes and helicopters can collect images with much higher spatial resolution Spatial resolution refers to the level of detail or granularity in an image or a spatial dataset. , but they can only fly when the weather is desirable or during the day, if they're not approved to fly at night - compared to satellites which collect images 24 hours a day, 365 days a year, no matter the weather or time of day. Another advantage is when it comes to natural disasters and other emergencies, aircraft can respond immediately to collect images for first responders, where satellites sometimes collect really nice images of the event - completely by chance.
Neither satellite images nor aerial photos are the "right" choice, nor is one better than the other. Each one has its advantages and disadvantages, so the choice to use one over the other really doesn't come from some pre-established set of rules, but from what is the more correct choice for a project, what funding is available to a particular GIS Geographic Information Systems the software used to create, store, and manage spatial data Data that deals with location, such as lists of addresses, the footprint of a building, the boundaries of cities and counties, etc. , analyze spatial problems, and display the data in cartographic layouts Geographic Information Sciences shop, and what sources of data that shop might have at its disposal.
GIS Geographic Information Systems the software used to create, store, and manage spatial data Data that deals with location, such as lists of addresses, the footprint of a building, the boundaries of cities and counties, etc. , analyze spatial problems, and display the data in cartographic layouts Geographic Information Sciences 1040 will use some satellite imagery from time to time, mostly in the capacity of a basemap or as a source to digitize new vector features (one topic of this chapter), but this class won't go too far into how to get that data or the many, many uses of said data. There are entire classes dedicated to the topics of collecting and using remotely sensed data.
6.2.5: Scanning Maps and Georeferencing
For many years, paper maps were the heart of cartography and spatial analysis. While computers have become the norm for their ease of use and ability to store large amounts of related data at one time, old paper maps still contain a wealth of information that has yet to be digitized A term to describe data which was created through the act of digitizing The action of creating vector data in any sort of digital science or art, is simply denoting a type of graphical representation using straight lines to construct the outlines of objects by defining the location of each vertex pl. vertices One of a set of ordered x,y coordinate pairs that defines the shape of a line or polygon feature. utilizing drawing pad and puck (manual or hardcopy digitizing) or a computer with a mouse (heads-up or on-screen digitizing) while, most often, looking at and tracing aerial or satellite imagery. . This is where scanning and georeferencing come into play. Using a flatbed or large rolling scanner, paper maps and other hard copy images can be scanned into digital format and then georeferenced for use with digitization.
| Figure 6.5: Three Styles of Scanners | ||
|---|---|---|
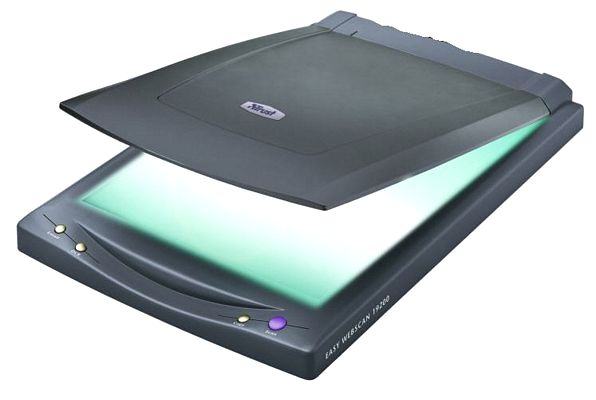 | 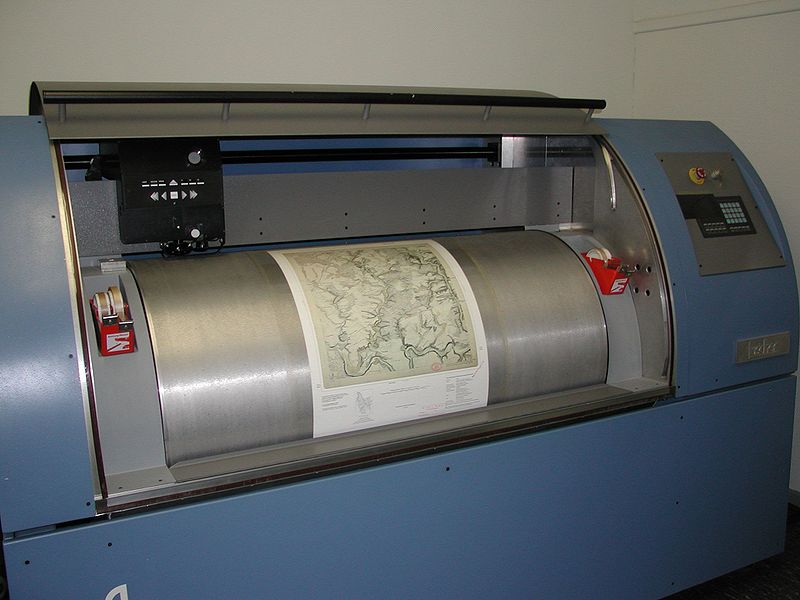 | 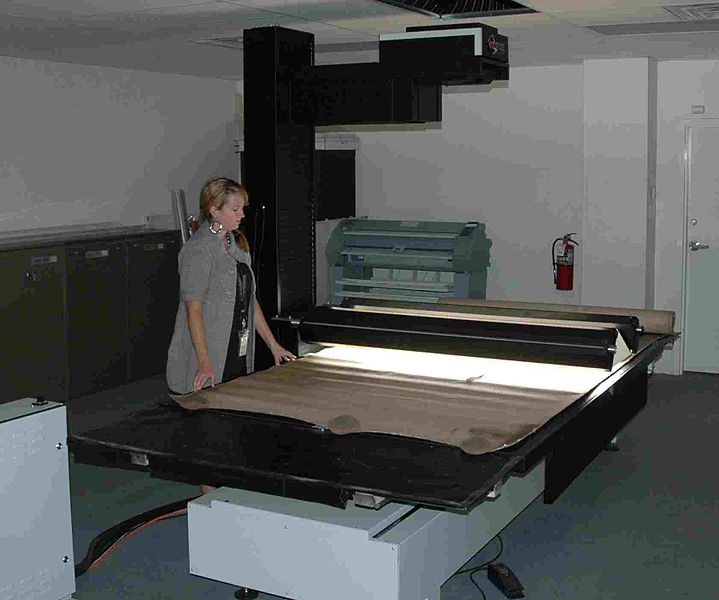 |
| Smaller maps such as plat maps can be scanned with a consumer-sized scanner | Drum scanners can handle larger maps and scan faster | Large scale rolling scanners work similar to a photocopy machine for very large maps |
Once maps have been scanned into digital images, they're ready to be brought into the GIS Geographic Information Systems the software used to create, store, and manage spatial data Data that deals with location, such as lists of addresses, the footprint of a building, the boundaries of cities and counties, etc. , analyze spatial problems, and display the data in cartographic layouts Geographic Information Sciences , but they have a huge problem - they have no idea where in the world they belong. When spatial raster Spatial raster data is a type of digital data that stores information about a location using a grid of pixels or cells AND has stored coordinate information based on any given geographic or projected coordinate system. and vector data in any sort of digital science or art, is simply denoting a type of graphical representation using straight lines to construct the outlines of objects are added to a GIS Geographic Information Systems the software used to create, store, and manage spatial data Data that deals with location, such as lists of addresses, the footprint of a building, the boundaries of cities and counties, etc. , analyze spatial problems, and display the data in cartographic layouts Geographic Information Sciences project, the first thing that happens is they're placed exactly where they belong, meaning each pixel The smallest unit of information in a digital image or raster map, usually square or rectangular. Often used synonymously with cell. Pixel is an abbreviation of "picture element". corner or vertex pl. vertices One of a set of ordered x,y coordinate pairs that defines the shape of a line or polygon feature. is positioned in the proper spot within the GIS Geographic Information Systems the software used to create, store, and manage spatial data Data that deals with location, such as lists of addresses, the footprint of a building, the boundaries of cities and counties, etc. , analyze spatial problems, and display the data in cartographic layouts Geographic Information Sciences coordinate system. After a map is scanned, it can be added to the GIS Geographic Information Systems the software used to create, store, and manage spatial data Data that deals with location, such as lists of addresses, the footprint of a building, the boundaries of cities and counties, etc. , analyze spatial problems, and display the data in cartographic layouts Geographic Information Sciences project, but right off the bat, the image is no better than an image of a grumpy cat - each one is just a raster image with no geographic context.
In order to "tell" a scanned map where it "lives" in the world, a GIS Geographic Information Systems the software used to create, store, and manage spatial data Data that deals with location, such as lists of addresses, the footprint of a building, the boundaries of cities and counties, etc. , analyze spatial problems, and display the data in cartographic layouts Geographic Information Sciences technician must go through a process of georeferencing. Georeferencing is the process of finding distinct objects in the scanned map and connecting each one to a known location within another raster or vector layer by creating control points. We saw the term "control points" back in Chapter Two when we learned how geoids and reference ellipsoids are connected, and the meaning is no different in this case. Control points are simply matched locations between two surfaces - sometimes two mathematical models such as a geoid a model of the variation between global mean (average) sea level and local mean sea level the measurement above or below the global average at a single point on the Earth's surface used for recording the elevation of topographic surface a detailed map of the surface features of land. It includes the mountains, hills, creeks, and other bumps and lumps on a particular hunk of earth. The word is a Greek-rooted combo of topos meaning "place" and graphein "to write." 's relief the difference between the highest and lowest point within a particular area while landforms are the descriptive words for individual features , which is used to measure precise elevations on the topographic surface a detailed map of the surface features of land. It includes the mountains, hills, creeks, and other bumps and lumps on a particular hunk of earth. The word is a Greek-rooted combo of topos meaning "place" and graphein "to write." and a reference ellipsoid an ellipsoid that is drawn to best-fit an area. World reference ellipsoids are drawn to best-fit the entire geoid; local ellipsoids are best fit on one side to a single place of the geoid , and sometimes between an image and a coordinate pair, such as a freshly scanned map and a vector layer that matches some boundary in said map, or a spatial raster Spatial raster data is a type of digital data that stores information about a location using a grid of pixels or cells AND has stored coordinate information based on any given geographic or projected coordinate system. depicting the same area. Either way, we're using the term "control" to note that coordinates in one of the layers or mathematical models are a constant and unchanging standard of comparison.
For example, if a map of the western United States was scanned, the process of georeferencing it would go as follows:
First, the technician locates a place in the image (the unknown) that is clear and distinct, such as the corner of a state boundary if it's visible in the image.
Second, the technician uses the georeferencing control point aka: tie point mathematically derived points that connect a two spatial objects together, such as a geoid a model of the variation between global mean (average) sea level and local mean sea level the measurement above or below the global average at a single point on the Earth's surface used for recording the elevation of topographic surface a detailed map of the surface features of land. It includes the mountains, hills, creeks, and other bumps and lumps on a particular hunk of earth. The word is a Greek-rooted combo of topos meaning "place" and graphein "to write." 's relief the difference between the highest and lowest point within a particular area while landforms are the descriptive words for individual features , which is used to measure precise elevations on the topographic surface a detailed map of the surface features of land. It includes the mountains, hills, creeks, and other bumps and lumps on a particular hunk of earth. The word is a Greek-rooted combo of topos meaning "place" and graphein "to write." and a reference ellipsoid an ellipsoid that is drawn to best-fit an area. World reference ellipsoids are drawn to best-fit the entire geoid; local ellipsoids are best fit on one side to a single place of the geoid tool to mark the location of the selected visible place (the candidate control point aka: tie point mathematically derived points that connect a two spatial objects together, such as a geoid a model of the variation between global mean (average) sea level and local mean sea level the measurement above or below the global average at a single point on the Earth's surface used for recording the elevation of topographic surface a detailed map of the surface features of land. It includes the mountains, hills, creeks, and other bumps and lumps on a particular hunk of earth. The word is a Greek-rooted combo of topos meaning "place" and graphein "to write." 's relief the difference between the highest and lowest point within a particular area while landforms are the descriptive words for individual features , which is used to measure precise elevations on the topographic surface a detailed map of the surface features of land. It includes the mountains, hills, creeks, and other bumps and lumps on a particular hunk of earth. The word is a Greek-rooted combo of topos meaning "place" and graphein "to write." and a reference ellipsoid an ellipsoid that is drawn to best-fit an area. World reference ellipsoids are drawn to best-fit the entire geoid; local ellipsoids are best fit on one side to a single place of the geoid ).
Third, the technician uses the georeferencing control point aka: tie point mathematically derived points that connect a two spatial objects together, such as a geoid a model of the variation between global mean (average) sea level and local mean sea level the measurement above or below the global average at a single point on the Earth's surface used for recording the elevation of topographic surface a detailed map of the surface features of land. It includes the mountains, hills, creeks, and other bumps and lumps on a particular hunk of earth. The word is a Greek-rooted combo of topos meaning "place" and graphein "to write." 's relief the difference between the highest and lowest point within a particular area while landforms are the descriptive words for individual features , which is used to measure precise elevations on the topographic surface a detailed map of the surface features of land. It includes the mountains, hills, creeks, and other bumps and lumps on a particular hunk of earth. The word is a Greek-rooted combo of topos meaning "place" and graphein "to write." and a reference ellipsoid an ellipsoid that is drawn to best-fit an area. World reference ellipsoids are drawn to best-fit the entire geoid; local ellipsoids are best fit on one side to a single place of the geoid tool to mark that same location (the destination control point aka: tie point mathematically derived points that connect a two spatial objects together, such as a geoid a model of the variation between global mean (average) sea level and local mean sea level the measurement above or below the global average at a single point on the Earth's surface used for recording the elevation of topographic surface a detailed map of the surface features of land. It includes the mountains, hills, creeks, and other bumps and lumps on a particular hunk of earth. The word is a Greek-rooted combo of topos meaning "place" and graphein "to write." 's relief the difference between the highest and lowest point within a particular area while landforms are the descriptive words for individual features , which is used to measure precise elevations on the topographic surface a detailed map of the surface features of land. It includes the mountains, hills, creeks, and other bumps and lumps on a particular hunk of earth. The word is a Greek-rooted combo of topos meaning "place" and graphein "to write." and a reference ellipsoid an ellipsoid that is drawn to best-fit an area. World reference ellipsoids are drawn to best-fit the entire geoid; local ellipsoids are best fit on one side to a single place of the geoid ) on the spatially referenced raster or vector layer (the known).
Fourth, the technician repeats these steps until the unknown image visually lines up with the known location.
The process of georeferencing within the GIS Geographic Information Systems the software used to create, store, and manage spatial data Data that deals with location, such as lists of addresses, the footprint of a building, the boundaries of cities and counties, etc. , analyze spatial problems, and display the data in cartographic layouts Geographic Information Sciences uses a constantly updating method - as the technician works marking features with control points, the candidate control point aka: tie point mathematically derived points that connect a two spatial objects together, such as a geoid a model of the variation between global mean (average) sea level and local mean sea level the measurement above or below the global average at a single point on the Earth's surface used for recording the elevation of topographic surface a detailed map of the surface features of land. It includes the mountains, hills, creeks, and other bumps and lumps on a particular hunk of earth. The word is a Greek-rooted combo of topos meaning "place" and graphein "to write." 's relief the difference between the highest and lowest point within a particular area while landforms are the descriptive words for individual features , which is used to measure precise elevations on the topographic surface a detailed map of the surface features of land. It includes the mountains, hills, creeks, and other bumps and lumps on a particular hunk of earth. The word is a Greek-rooted combo of topos meaning "place" and graphein "to write." and a reference ellipsoid an ellipsoid that is drawn to best-fit an area. World reference ellipsoids are drawn to best-fit the entire geoid; local ellipsoids are best fit on one side to a single place of the geoid immediately snaps to the destination control point aka: tie point mathematically derived points that connect a two spatial objects together, such as a geoid a model of the variation between global mean (average) sea level and local mean sea level the measurement above or below the global average at a single point on the Earth's surface used for recording the elevation of topographic surface a detailed map of the surface features of land. It includes the mountains, hills, creeks, and other bumps and lumps on a particular hunk of earth. The word is a Greek-rooted combo of topos meaning "place" and graphein "to write." 's relief the difference between the highest and lowest point within a particular area while landforms are the descriptive words for individual features , which is used to measure precise elevations on the topographic surface a detailed map of the surface features of land. It includes the mountains, hills, creeks, and other bumps and lumps on a particular hunk of earth. The word is a Greek-rooted combo of topos meaning "place" and graphein "to write." and a reference ellipsoid an ellipsoid that is drawn to best-fit an area. World reference ellipsoids are drawn to best-fit the entire geoid; local ellipsoids are best fit on one side to a single place of the geoid .. At first, the image seems very stretched and extremely distorted, but as the process continues, the image begins to become legible again. When georeferencing, it's important to only place as many control points as are needed to set the image in place. This method is definitely a case of "less is more."
It's important to note that the term georeferencing has only a single meaning in GIS Geographic Information Systems the software used to create, store, and manage spatial data Data that deals with location, such as lists of addresses, the footprint of a building, the boundaries of cities and counties, etc. , analyze spatial problems, and display the data in cartographic layouts Geographic Information Sciences - defining the spatial location of an unknown image by creating control points between distinct objects in said image and a known raster or vector layer. It does not mean to search for and download imagery, nor to add any raster imagery to the GIS Geographic Information Systems the software used to create, store, and manage spatial data Data that deals with location, such as lists of addresses, the footprint of a building, the boundaries of cities and counties, etc. , analyze spatial problems, and display the data in cartographic layouts Geographic Information Sciences , nor does it mean to find locations within known imagery, nor any sort of geoprocessing or spatial analysis. It's incorrect to use the term in reference to any other task within the GIS Geographic Information Systems the software used to create, store, and manage spatial data Data that deals with location, such as lists of addresses, the footprint of a building, the boundaries of cities and counties, etc. , analyze spatial problems, and display the data in cartographic layouts Geographic Information Sciences beyond this singular meaning.
| Figure 6.6: An Example of a Single Control Point in ArcGIS Pro |
|---|
 |
| In this image, we see the unknown raster image being georeferenced to a vector roads layer, seen in thick red and thin yellow lines. The candidate control point aka: tie point mathematically derived points that connect a two spatial objects together, such as a geoid a model of the variation between global mean (average) sea level and local mean sea level the measurement above or below the global average at a single point on the Earth's surface used for recording the elevation of topographic surface a detailed map of the surface features of land. It includes the mountains, hills, creeks, and other bumps and lumps on a particular hunk of earth. The word is a Greek-rooted combo of topos meaning "place" and graphein "to write." 's relief the difference between the highest and lowest point within a particular area while landforms are the descriptive words for individual features , which is used to measure precise elevations on the topographic surface a detailed map of the surface features of land. It includes the mountains, hills, creeks, and other bumps and lumps on a particular hunk of earth. The word is a Greek-rooted combo of topos meaning "place" and graphein "to write." and a reference ellipsoid an ellipsoid that is drawn to best-fit an area. World reference ellipsoids are drawn to best-fit the entire geoid; local ellipsoids are best fit on one side to a single place of the geoid (green cross, upper middle) is marked first, followed by the destination control point aka: tie point mathematically derived points that connect a two spatial objects together, such as a geoid a model of the variation between global mean (average) sea level and local mean sea level the measurement above or below the global average at a single point on the Earth's surface used for recording the elevation of topographic surface a detailed map of the surface features of land. It includes the mountains, hills, creeks, and other bumps and lumps on a particular hunk of earth. The word is a Greek-rooted combo of topos meaning "place" and graphein "to write." 's relief the difference between the highest and lowest point within a particular area while landforms are the descriptive words for individual features , which is used to measure precise elevations on the topographic surface a detailed map of the surface features of land. It includes the mountains, hills, creeks, and other bumps and lumps on a particular hunk of earth. The word is a Greek-rooted combo of topos meaning "place" and graphein "to write." and a reference ellipsoid an ellipsoid that is drawn to best-fit an area. World reference ellipsoids are drawn to best-fit the entire geoid; local ellipsoids are best fit on one side to a single place of the geoid (yellow cross, lower left). The process of georeferencing is a repetitive puzzle, looking for distinct locations such as road intersections in the unknown raster image, and finding those in the known raster or vector layer. The finesse comes from selecting the correct locations across the correct spread to make the unknown image pop into place. |
6.2.6: Required reading: Scan the Contents of this Article
6.2.7: Creating New Vector Layers in ArcGIS Pro
Many times in GIS Geographic Information Systems the software used to create, store, and manage spatial data Data that deals with location, such as lists of addresses, the footprint of a building, the boundaries of cities and counties, etc. , analyze spatial problems, and display the data in cartographic layouts Geographic Information Sciences , we're digitizing The action of creating vector data in any sort of digital science or art, is simply denoting a type of graphical representation using straight lines to construct the outlines of objects by defining the location of each vertex pl. vertices One of a set of ordered x,y coordinate pairs that defines the shape of a line or polygon feature. utilizing drawing pad and puck (manual or hardcopy digitizing) or a computer with a mouse (heads-up or on-screen digitizing) while, most often, looking at and tracing aerial or satellite imagery. features by adding them to an existing layer, meaning we take a shapefile One of the two main types of vector data in any sort of digital science or art, is simply denoting a type of graphical representation using straight lines to construct the outlines of objects we learn in this class (there are more than two vector data in any sort of digital science or art, is simply denoting a type of graphical representation using straight lines to construct the outlines of objects types in GIS). Shapefiles are each only one geometry type, either a point, a polyline, or a polygon. Shapefiles are stored in folders and most often do not have relationships with other data. or feature class One of the two main types of vector data in any sort of digital science or art, is simply denoting a type of graphical representation using straight lines to construct the outlines of objects we learn in this class (there are more than two vector data in any sort of digital science or art, is simply denoting a type of graphical representation using straight lines to construct the outlines of objects types in GIS). Feature classes are each only one geometry type, either a point A GIS vector data in any sort of digital science or art, is simply denoting a type of graphical representation using straight lines to construct the outlines of objects geometry type which is made up of just one vertex pl. vertices One of a set of ordered x,y coordinate pairs that defines the shape of a line or polygon feature. , marking a single XY location in any given geographic or projected coordinate system. , a polyline A GIS vector data in any sort of digital science or art, is simply denoting a type of graphical representation using straight lines to construct the outlines of objects geometry type which is made up of two or more vertices connected by straight lines. Often used to represent objects such as roads, river, and boundaries. , or a polygon. Feature classes are stored in geodatabases and are most often used when data relationships are important. that we already have and add new features to it so the total number of features increases. For example, if you downloaded a road centerlines feature class One of the two main types of vector data in any sort of digital science or art, is simply denoting a type of graphical representation using straight lines to construct the outlines of objects we learn in this class (there are more than two vector data in any sort of digital science or art, is simply denoting a type of graphical representation using straight lines to construct the outlines of objects types in GIS). Feature classes are each only one geometry type, either a point A GIS vector data in any sort of digital science or art, is simply denoting a type of graphical representation using straight lines to construct the outlines of objects geometry type which is made up of just one vertex pl. vertices One of a set of ordered x,y coordinate pairs that defines the shape of a line or polygon feature. , marking a single XY location in any given geographic or projected coordinate system. , a polyline A GIS vector data in any sort of digital science or art, is simply denoting a type of graphical representation using straight lines to construct the outlines of objects geometry type which is made up of two or more vertices connected by straight lines. Often used to represent objects such as roads, river, and boundaries. , or a polygon. Feature classes are stored in geodatabases and are most often used when data relationships are important. from the City of Fort Collins and realized that an entire neighborhood was missing, you would use an image of the city as a reference and edit the existing layer, adding the missing roads via digitizing The action of creating vector data in any sort of digital science or art, is simply denoting a type of graphical representation using straight lines to construct the outlines of objects by defining the location of each vertex pl. vertices One of a set of ordered x,y coordinate pairs that defines the shape of a line or polygon feature. utilizing drawing pad and puck (manual or hardcopy digitizing) or a computer with a mouse (heads-up or on-screen digitizing) while, most often, looking at and tracing aerial or satellite imagery. . The feature class One of the two main types of vector data in any sort of digital science or art, is simply denoting a type of graphical representation using straight lines to construct the outlines of objects we learn in this class (there are more than two vector data in any sort of digital science or art, is simply denoting a type of graphical representation using straight lines to construct the outlines of objects types in GIS). Feature classes are each only one geometry type, either a point A GIS vector data in any sort of digital science or art, is simply denoting a type of graphical representation using straight lines to construct the outlines of objects geometry type which is made up of just one vertex pl. vertices One of a set of ordered x,y coordinate pairs that defines the shape of a line or polygon feature. , marking a single XY location in any given geographic or projected coordinate system. , a polyline A GIS vector data in any sort of digital science or art, is simply denoting a type of graphical representation using straight lines to construct the outlines of objects geometry type which is made up of two or more vertices connected by straight lines. Often used to represent objects such as roads, river, and boundaries. , or a polygon. Feature classes are stored in geodatabases and are most often used when data relationships are important. , when downloaded, may have 325 features (rows in the attribute table), and after you've digitized A term to describe data which was created through the act of digitizing The action of creating vector data in any sort of digital science or art, is simply denoting a type of graphical representation using straight lines to construct the outlines of objects by defining the location of each vertex pl. vertices One of a set of ordered x,y coordinate pairs that defines the shape of a line or polygon feature. utilizing drawing pad and puck (manual or hardcopy digitizing) or a computer with a mouse (heads-up or on-screen digitizing) while, most often, looking at and tracing aerial or satellite imagery. the missing neighborhood, the count might increase to 412 because you found 87 missing roads.
The rest of the time, when you need to digitize features that don't exist into a shapefile One of the two main types of vector data in any sort of digital science or art, is simply denoting a type of graphical representation using straight lines to construct the outlines of objects we learn in this class (there are more than two vector data in any sort of digital science or art, is simply denoting a type of graphical representation using straight lines to construct the outlines of objects types in GIS). Shapefiles are each only one geometry type, either a point, a polyline, or a polygon. Shapefiles are stored in folders and most often do not have relationships with other data. or feature class One of the two main types of vector data in any sort of digital science or art, is simply denoting a type of graphical representation using straight lines to construct the outlines of objects we learn in this class (there are more than two vector data in any sort of digital science or art, is simply denoting a type of graphical representation using straight lines to construct the outlines of objects types in GIS). Feature classes are each only one geometry type, either a point A GIS vector data in any sort of digital science or art, is simply denoting a type of graphical representation using straight lines to construct the outlines of objects geometry type which is made up of just one vertex pl. vertices One of a set of ordered x,y coordinate pairs that defines the shape of a line or polygon feature. , marking a single XY location in any given geographic or projected coordinate system. , a polyline A GIS vector data in any sort of digital science or art, is simply denoting a type of graphical representation using straight lines to construct the outlines of objects geometry type which is made up of two or more vertices connected by straight lines. Often used to represent objects such as roads, river, and boundaries. , or a polygon. Feature classes are stored in geodatabases and are most often used when data relationships are important. that doesn't exist, you first need to create a new vector file. Just like when you sit down to write a paper for English class or send an email to your grandma, the first step is to create a new, blank document or email. You can't complete the paper or write the email if you don't first click the "New" button. GIS Geographic Information Systems the software used to create, store, and manage spatial data Data that deals with location, such as lists of addresses, the footprint of a building, the boundaries of cities and counties, etc. , analyze spatial problems, and display the data in cartographic layouts Geographic Information Sciences is no different - if you don't have a vector layer in which to digitize the new features, you can't complete the task.
Creating a new shapefile One of the two main types of vector data in any sort of digital science or art, is simply denoting a type of graphical representation using straight lines to construct the outlines of objects we learn in this class (there are more than two vector data in any sort of digital science or art, is simply denoting a type of graphical representation using straight lines to construct the outlines of objects types in GIS). Shapefiles are each only one geometry type, either a point, a polyline, or a polygon. Shapefiles are stored in folders and most often do not have relationships with other data. or feature class One of the two main types of vector data in any sort of digital science or art, is simply denoting a type of graphical representation using straight lines to construct the outlines of objects we learn in this class (there are more than two vector data in any sort of digital science or art, is simply denoting a type of graphical representation using straight lines to construct the outlines of objects types in GIS). Feature classes are each only one geometry type, either a point A GIS vector data in any sort of digital science or art, is simply denoting a type of graphical representation using straight lines to construct the outlines of objects geometry type which is made up of just one vertex pl. vertices One of a set of ordered x,y coordinate pairs that defines the shape of a line or polygon feature. , marking a single XY location in any given geographic or projected coordinate system. , a polyline A GIS vector data in any sort of digital science or art, is simply denoting a type of graphical representation using straight lines to construct the outlines of objects geometry type which is made up of two or more vertices connected by straight lines. Often used to represent objects such as roads, river, and boundaries. , or a polygon. Feature classes are stored in geodatabases and are most often used when data relationships are important. is a fairly simple process and is practically the same for both, with a few slight differences. Remembering that shapefiles live in folders and feature classes live in geodatabases, the technician needs to identify where the new file will be created, give it a unique name that follows the GIS Geographic Information Systems the software used to create, store, and manage spatial data Data that deals with location, such as lists of addresses, the footprint of a building, the boundaries of cities and counties, etc. , analyze spatial problems, and display the data in cartographic layouts Geographic Information Sciences naming convention rules, pick a geographic or projected coordinate system, and decide which of the three geometry types the new shapefile One of the two main types of vector data in any sort of digital science or art, is simply denoting a type of graphical representation using straight lines to construct the outlines of objects we learn in this class (there are more than two vector data in any sort of digital science or art, is simply denoting a type of graphical representation using straight lines to construct the outlines of objects types in GIS). Shapefiles are each only one geometry type, either a point, a polyline, or a polygon. Shapefiles are stored in folders and most often do not have relationships with other data. or feature class One of the two main types of vector data in any sort of digital science or art, is simply denoting a type of graphical representation using straight lines to construct the outlines of objects we learn in this class (there are more than two vector data in any sort of digital science or art, is simply denoting a type of graphical representation using straight lines to construct the outlines of objects types in GIS). Feature classes are each only one geometry type, either a point A GIS vector data in any sort of digital science or art, is simply denoting a type of graphical representation using straight lines to construct the outlines of objects geometry type which is made up of just one vertex pl. vertices One of a set of ordered x,y coordinate pairs that defines the shape of a line or polygon feature. , marking a single XY location in any given geographic or projected coordinate system. , a polyline A GIS vector data in any sort of digital science or art, is simply denoting a type of graphical representation using straight lines to construct the outlines of objects geometry type which is made up of two or more vertices connected by straight lines. Often used to represent objects such as roads, river, and boundaries. , or a polygon. Feature classes are stored in geodatabases and are most often used when data relationships are important. needs to be. Remember, polygon vector files can only contain polygons, polyline A GIS vector data in any sort of digital science or art, is simply denoting a type of graphical representation using straight lines to construct the outlines of objects geometry type which is made up of two or more vertices connected by straight lines. Often used to represent objects such as roads, river, and boundaries. files can only contain polylines, and point A GIS vector data in any sort of digital science or art, is simply denoting a type of graphical representation using straight lines to construct the outlines of objects geometry type which is made up of just one vertex pl. vertices One of a set of ordered x,y coordinate pairs that defines the shape of a line or polygon feature. , marking a single XY location in any given geographic or projected coordinate system. files can only contain points. If you need to digitize features of more than one geometry type, you'll need to create more than one feature class One of the two main types of vector data in any sort of digital science or art, is simply denoting a type of graphical representation using straight lines to construct the outlines of objects we learn in this class (there are more than two vector data in any sort of digital science or art, is simply denoting a type of graphical representation using straight lines to construct the outlines of objects types in GIS). Feature classes are each only one geometry type, either a point A GIS vector data in any sort of digital science or art, is simply denoting a type of graphical representation using straight lines to construct the outlines of objects geometry type which is made up of just one vertex pl. vertices One of a set of ordered x,y coordinate pairs that defines the shape of a line or polygon feature. , marking a single XY location in any given geographic or projected coordinate system. , a polyline A GIS vector data in any sort of digital science or art, is simply denoting a type of graphical representation using straight lines to construct the outlines of objects geometry type which is made up of two or more vertices connected by straight lines. Often used to represent objects such as roads, river, and boundaries. , or a polygon. Feature classes are stored in geodatabases and are most often used when data relationships are important. or shapefile One of the two main types of vector data in any sort of digital science or art, is simply denoting a type of graphical representation using straight lines to construct the outlines of objects we learn in this class (there are more than two vector data in any sort of digital science or art, is simply denoting a type of graphical representation using straight lines to construct the outlines of objects types in GIS). Shapefiles are each only one geometry type, either a point, a polyline, or a polygon. Shapefiles are stored in folders and most often do not have relationships with other data. .
Take a few minutes "arc minute" 1/60th of a degree. Usually denoted by " to look over the following table showing you how to create new shapefiles and feature classes. Remember, you don't need to memorize the steps, but it's a good thing to review the process before you're asked to complete it in a lab situation.
| Figure 6.7: Overview of Creating New Shapefiles and Feature Classes | |
|---|---|
| |
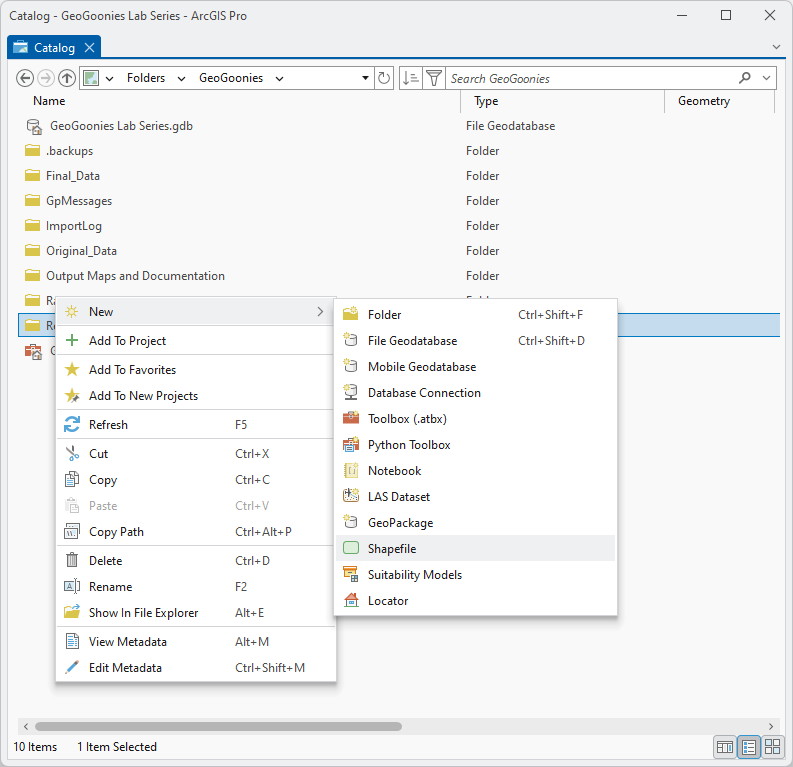 New Shapefile | 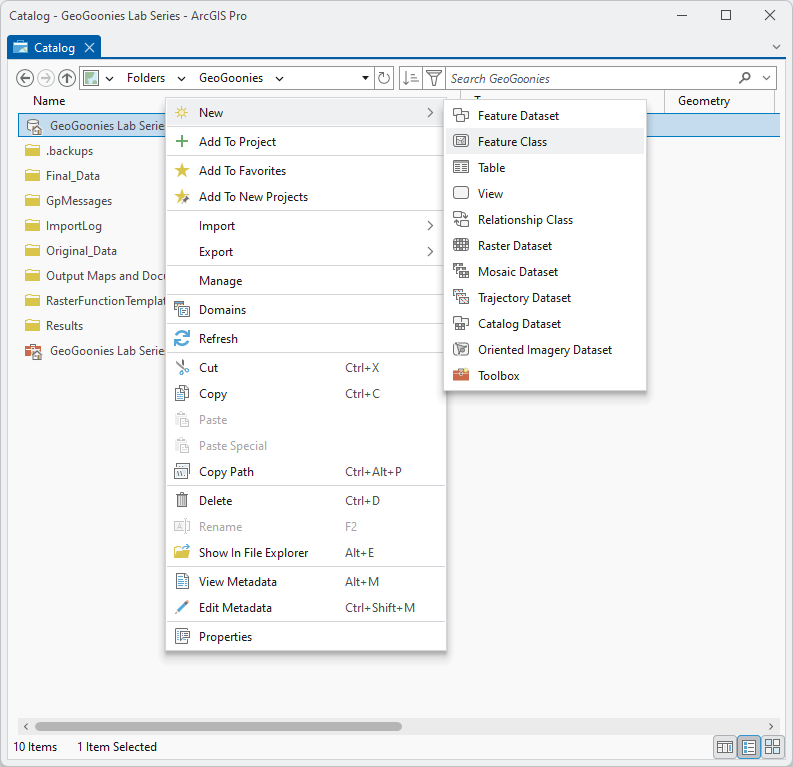 New Feature Class |
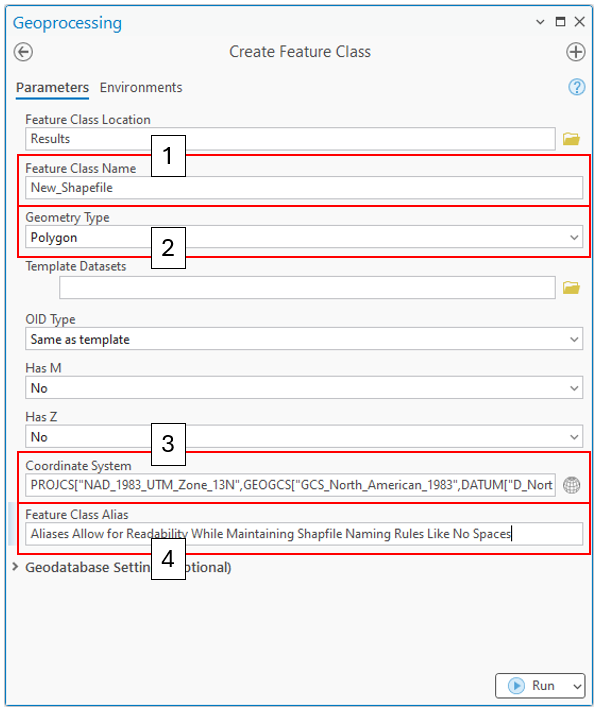 The dialog box to create a new shapefile One of the two main types of vector data in any sort of digital science or art, is simply denoting a type of graphical representation using straight lines to construct the outlines of objects we learn in this class (there are more than two vector data in any sort of digital science or art, is simply denoting a type of graphical representation using straight lines to construct the outlines of objects types in GIS). Shapefiles are each only one geometry type, either a point, a polyline, or a polygon. Shapefiles are stored in folders and most often do not have relationships with other data. will be labeled "New Feature Class". ArcGIS Pro will know to make a shapefile One of the two main types of vector data in any sort of digital science or art, is simply denoting a type of graphical representation using straight lines to construct the outlines of objects we learn in this class (there are more than two vector data in any sort of digital science or art, is simply denoting a type of graphical representation using straight lines to construct the outlines of objects types in GIS). Shapefiles are each only one geometry type, either a point, a polyline, or a polygon. Shapefiles are stored in folders and most often do not have relationships with other data. or feature class One of the two main types of vector data in any sort of digital science or art, is simply denoting a type of graphical representation using straight lines to construct the outlines of objects we learn in this class (there are more than two vector data in any sort of digital science or art, is simply denoting a type of graphical representation using straight lines to construct the outlines of objects types in GIS). Feature classes are each only one geometry type, either a point A GIS vector data in any sort of digital science or art, is simply denoting a type of graphical representation using straight lines to construct the outlines of objects geometry type which is made up of just one vertex pl. vertices One of a set of ordered x,y coordinate pairs that defines the shape of a line or polygon feature. , marking a single XY location in any given geographic or projected coordinate system. , a polyline A GIS vector data in any sort of digital science or art, is simply denoting a type of graphical representation using straight lines to construct the outlines of objects geometry type which is made up of two or more vertices connected by straight lines. Often used to represent objects such as roads, river, and boundaries. , or a polygon. Feature classes are stored in geodatabases and are most often used when data relationships are important. based on the location you intend to save the new item. Selecting a folder for the "New Feature Class Location" line will create a shapefile One of the two main types of vector data in any sort of digital science or art, is simply denoting a type of graphical representation using straight lines to construct the outlines of objects we learn in this class (there are more than two vector data in any sort of digital science or art, is simply denoting a type of graphical representation using straight lines to construct the outlines of objects types in GIS). Shapefiles are each only one geometry type, either a point, a polyline, or a polygon. Shapefiles are stored in folders and most often do not have relationships with other data. . The remaining parameters - Geometry Type the specific shape or form a spatial feature takes, such as a point A GIS vector data in any sort of digital science or art, is simply denoting a type of graphical representation using straight lines to construct the outlines of objects geometry type which is made up of just one vertex pl. vertices One of a set of ordered x,y coordinate pairs that defines the shape of a line or polygon feature. , marking a single XY location in any given geographic or projected coordinate system. (single location), a line (connecting multiple points), or a polygon (closed area defined by multiple lines), which are used to represent real-world objects on a map and are defined by their coordinates within a spatial reference system. (2), Coordinate System (3), and Feature Class Alias (4) - will be the same if you create a shapefile One of the two main types of vector data in any sort of digital science or art, is simply denoting a type of graphical representation using straight lines to construct the outlines of objects we learn in this class (there are more than two vector data in any sort of digital science or art, is simply denoting a type of graphical representation using straight lines to construct the outlines of objects types in GIS). Shapefiles are each only one geometry type, either a point, a polyline, or a polygon. Shapefiles are stored in folders and most often do not have relationships with other data. or Feature Class with this tool. | 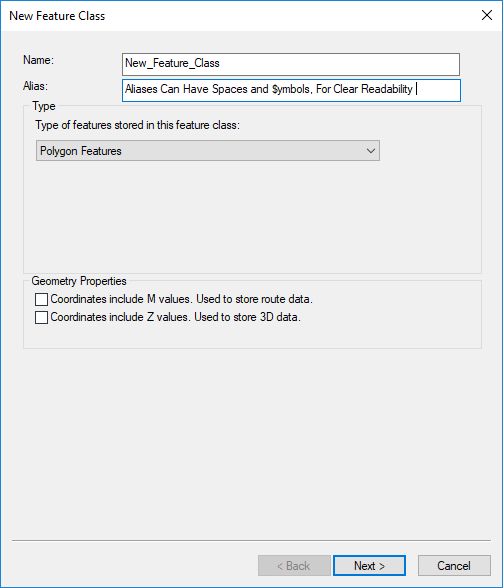 The New Feature Class wizard will differ slightly with a series of screens, advanced through with a "Next" button, and a few more options, including the ability to add fields before the feature class One of the two main types of vector data in any sort of digital science or art, is simply denoting a type of graphical representation using straight lines to construct the outlines of objects we learn in this class (there are more than two vector data in any sort of digital science or art, is simply denoting a type of graphical representation using straight lines to construct the outlines of objects types in GIS). Feature classes are each only one geometry type, either a point A GIS vector data in any sort of digital science or art, is simply denoting a type of graphical representation using straight lines to construct the outlines of objects geometry type which is made up of just one vertex pl. vertices One of a set of ordered x,y coordinate pairs that defines the shape of a line or polygon feature. , marking a single XY location in any given geographic or projected coordinate system. , a polyline A GIS vector data in any sort of digital science or art, is simply denoting a type of graphical representation using straight lines to construct the outlines of objects geometry type which is made up of two or more vertices connected by straight lines. Often used to represent objects such as roads, river, and boundaries. , or a polygon. Feature classes are stored in geodatabases and are most often used when data relationships are important. is created, not after like with a shapefile One of the two main types of vector data in any sort of digital science or art, is simply denoting a type of graphical representation using straight lines to construct the outlines of objects we learn in this class (there are more than two vector data in any sort of digital science or art, is simply denoting a type of graphical representation using straight lines to construct the outlines of objects types in GIS). Shapefiles are each only one geometry type, either a point, a polyline, or a polygon. Shapefiles are stored in folders and most often do not have relationships with other data. ( shapefile One of the two main types of vector data in any sort of digital science or art, is simply denoting a type of graphical representation using straight lines to construct the outlines of objects we learn in this class (there are more than two vector data in any sort of digital science or art, is simply denoting a type of graphical representation using straight lines to construct the outlines of objects types in GIS). Shapefiles are each only one geometry type, either a point, a polyline, or a polygon. Shapefiles are stored in folders and most often do not have relationships with other data. fields will need to be added via the Attribute Table after creation). |
Clicking the “Add Coordinate System” button at the top will allow you to Import or “borrow” a coordinate system from any other layer on the computer
| 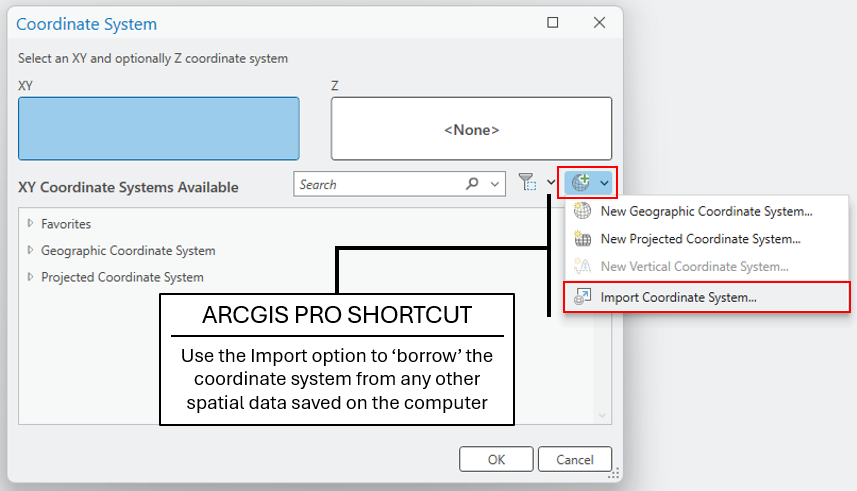 |
BLOCK
6.2.8: Geocoding
We know that geographic coordinate systems are a worldwide "address" system, marking locations on the Earth's surface in order to record or navigate to a location. We also know that in the postal system, actual postal addresses are part of a similar system, with streets running more or less north/south and east/west and the building number marking the location along that street. What you might not know, however, is these two systems are actually correlated.
When you use a mapping app such as Google Maps or Apple Maps, the system is actually looking up the address in a stored table that lists the building address as you input it into the system and the latitude also known as 'parallels' the east-west portion of a geographic grid measured with angles between 0 and 90° /longitude of that address as found in a geographic coordinate system. When you ask the app to navigate you to your destination, the app accepts the address as you've entered it, looks it up in a table of known addresses, compares what you've entered to what is considered "correct" by the Post Office, offers you any suggestions or corrections if needed, then finds the corresponding latitude also known as 'parallels' the east-west portion of a geographic grid measured with angles between 0 and 90° and longitude coordinate pair, to which the app will actually navigate, not the address as typed. This process of converting addresses to geographic coordinates, both with a navigation app and in the GIS Geographic Information Systems the software used to create, store, and manage spatial data Data that deals with location, such as lists of addresses, the footprint of a building, the boundaries of cities and counties, etc. , analyze spatial problems, and display the data in cartographic layouts Geographic Information Sciences , is called geocoding, while reverse geocoding Converting geographic coordinates into a human-readable address is the process of taking geographic coordinates and finding the associated address.
Many times in the GIS Geographic Information Systems the software used to create, store, and manage spatial data Data that deals with location, such as lists of addresses, the footprint of a building, the boundaries of cities and counties, etc. , analyze spatial problems, and display the data in cartographic layouts Geographic Information Sciences , we need to create a point A GIS vector data in any sort of digital science or art, is simply denoting a type of graphical representation using straight lines to construct the outlines of objects geometry type which is made up of just one vertex pl. vertices One of a set of ordered x,y coordinate pairs that defines the shape of a line or polygon feature. , marking a single XY location in any given geographic or projected coordinate system. layer based on addresses, and we accomplish this task with geocoding. Similar to the process the navigation app uses, in order to create an address-based point A GIS vector data in any sort of digital science or art, is simply denoting a type of graphical representation using straight lines to construct the outlines of objects geometry type which is made up of just one vertex pl. vertices One of a set of ordered x,y coordinate pairs that defines the shape of a line or polygon feature. , marking a single XY location in any given geographic or projected coordinate system. layer, we first create a table of addresses and use either a web-based or built-in address locator to match the address to the geographic coordinates. Address locators are lookup tables consisting of the house/building numbers, street names, block numbers, the odd/even sides of the street, the pattern of house/building numbers in that area, the zip codes, and the associated geographic coordinates. These address locators are the key to pairing the addresses as listed by the postal service with the geographic coordinate pair.
When geocoding, the GIS Geographic Information Systems the software used to create, store, and manage spatial data Data that deals with location, such as lists of addresses, the footprint of a building, the boundaries of cities and counties, etc. , analyze spatial problems, and display the data in cartographic layouts Geographic Information Sciences tries to find an exact match between your input address and the addresses in the locator's reference data. Sometimes, however, an exact match can't be found - maybe the street name is slightly different, the address doesn't exist yet, or the reference data is outdated. When this happens, the GIS Geographic Information Systems the software used to create, store, and manage spatial data Data that deals with location, such as lists of addresses, the footprint of a building, the boundaries of cities and counties, etc. , analyze spatial problems, and display the data in cartographic layouts Geographic Information Sciences can use interpolation to estimate where the address should be located based on the known addresses around it. For example, if the locator knows where 100 Main Street and 200 Main Street are located, it can estimate that 150 Main Street should be roughly halfway between them. While interpolated addresses are less accurate than exact matches, they're often good enough for analysis purposes.
To improve geocoding success rates, many GIS Geographic Information Systems the software used to create, store, and manage spatial data Data that deals with location, such as lists of addresses, the footprint of a building, the boundaries of cities and counties, etc. , analyze spatial problems, and display the data in cartographic layouts Geographic Information Sciences workflows use composite address locators - collections of multiple address locators that are searched in a priority order. If the first locator can't find a match, the system automatically tries the second locator, then the third, and so on. This approach is particularly useful when working with addresses from different regions, time periods, or sources, since no single address locator contains every possible address.
| Figure 6.8: Single and Composite Address Locators | |
|---|---|
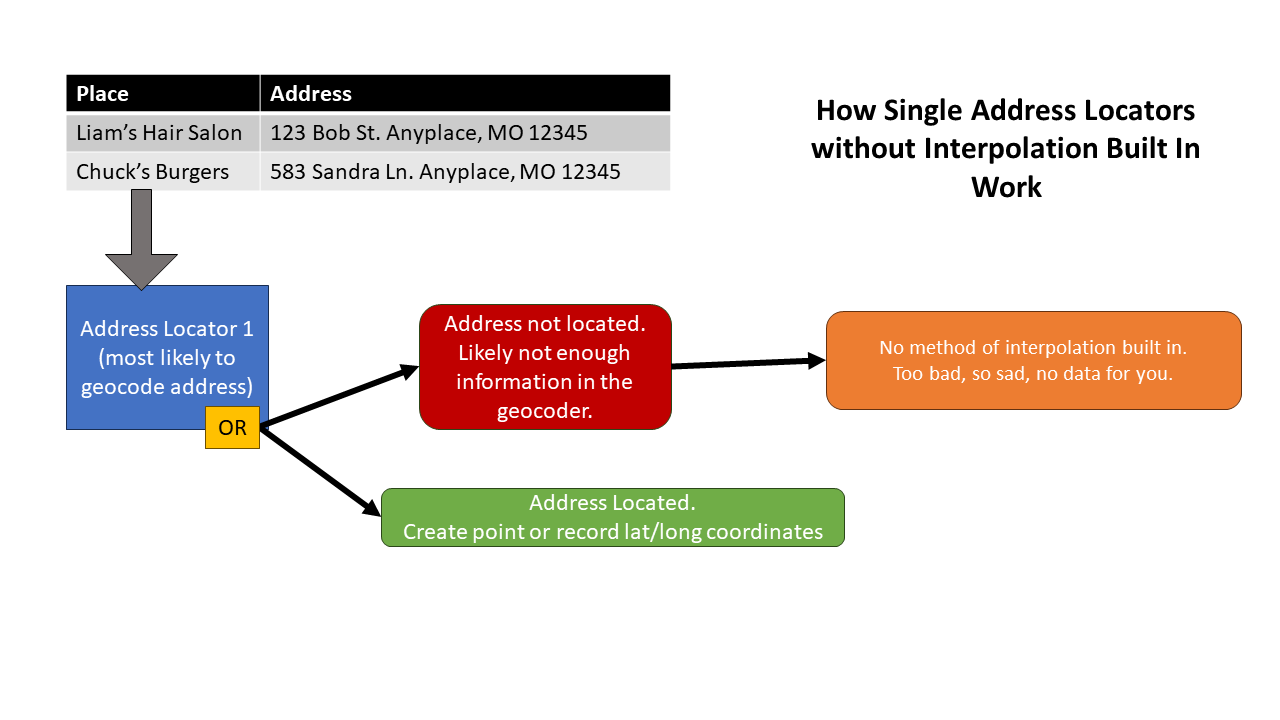 | 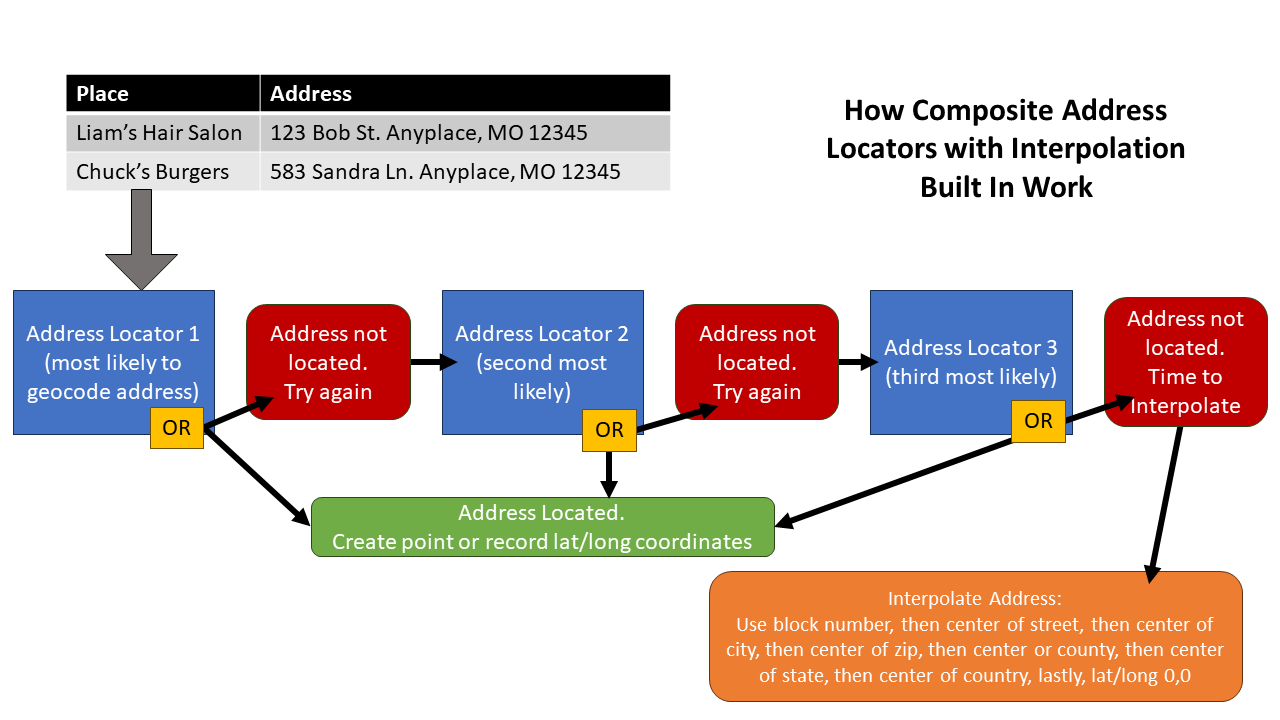 |
| Single Address Locator without Interpolation | Composite Address Locator with Interpolation |
Geocoding and reverse geocoding Converting geographic coordinates into a human-readable address can be completed using either web-based services or built-in GIS Geographic Information Systems the software used to create, store, and manage spatial data Data that deals with location, such as lists of addresses, the footprint of a building, the boundaries of cities and counties, etc. , analyze spatial problems, and display the data in cartographic layouts Geographic Information Sciences tools. Web-based services have everything ready to go without any intermediary steps, however, they often have limitations such as single-country or single-continent address locators, a maximum number of addresses that can be geocoded each day without cost, or only current addresses. Built-in geocoding tools require the technician to create or obtain the address locator before geocoding the addresses, but there are fewer limitations, meaning large numbers of addresses, historic addresses, or multi-country addresses can be geocoded. The technician guides the process, but the task takes longer overall.
| Figure 6.9: Geocoding Results |
|---|
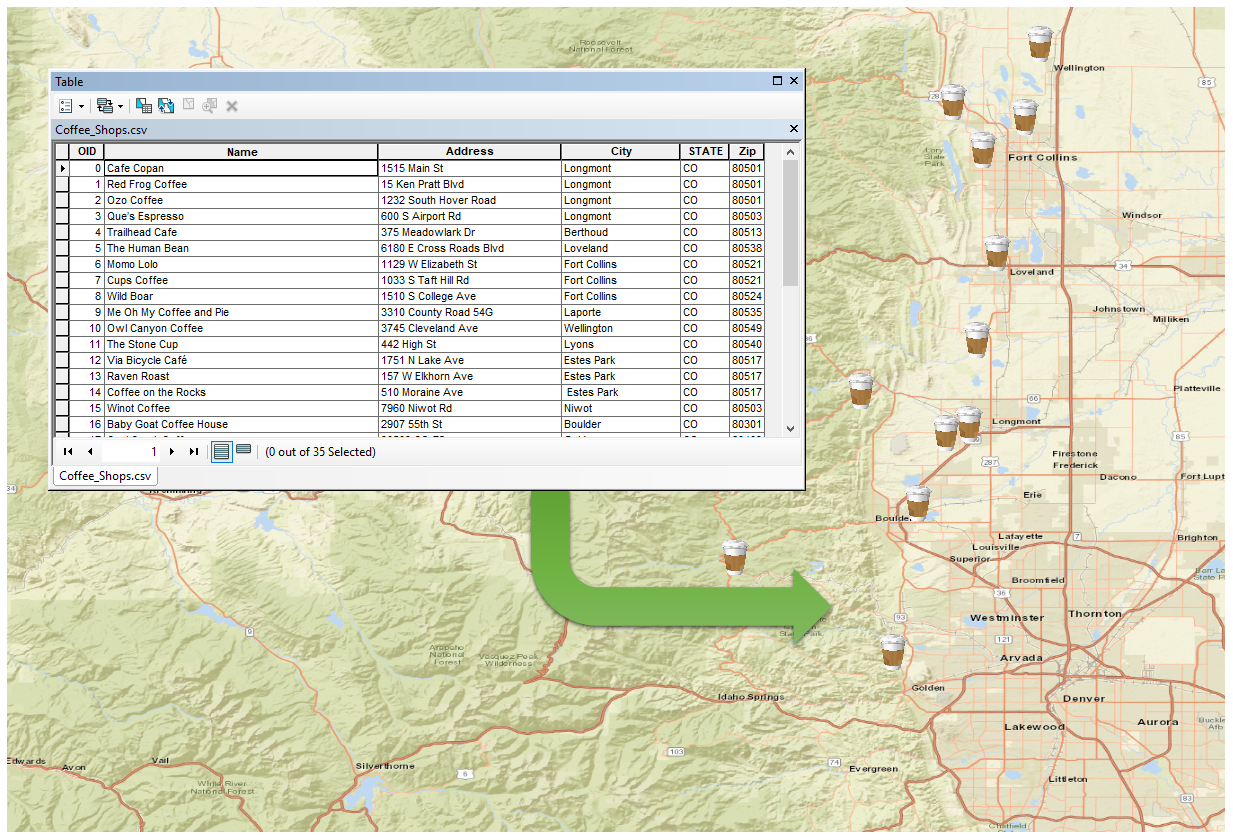 |
| A list of Colorado coffee shop addresses have been geocoded, the addresses have been converted to geographic coordinates and populate a point A GIS vector data in any sort of digital science or art, is simply denoting a type of graphical representation using straight lines to construct the outlines of objects geometry type which is made up of just one vertex pl. vertices One of a set of ordered x,y coordinate pairs that defines the shape of a line or polygon feature. , marking a single XY location in any given geographic or projected coordinate system. shapefile One of the two main types of vector data in any sort of digital science or art, is simply denoting a type of graphical representation using straight lines to construct the outlines of objects we learn in this class (there are more than two vector data in any sort of digital science or art, is simply denoting a type of graphical representation using straight lines to construct the outlines of objects types in GIS). Shapefiles are each only one geometry type, either a point, a polyline, or a polygon. Shapefiles are stored in folders and most often do not have relationships with other data. . |