You might be wondering why to use GIS Geographic Information Systems the software used to create, store, and manage spatial data, analyze spatial problems, and display the data in cartographic layouts Geographic Information Sciences at all. Sure, maps have been around for thousands of years, and we've managed to navigate and understand the world without too much trouble. GPS Global Positioning System: A satellite-based navigation system owned and operated by the United States Department of Defense that provides location and time information anywhere on Earth. is great, but if you're decent at reading a Thomas Guide, you can get just about anywhere. But GIS Geographic Information Systems the software used to create, store, and manage spatial data, analyze spatial problems, and display the data in cartographic layouts Geographic Information Sciences is more than just displaying data as a final map. What sets GIS Geographic Information Systems the software used to create, store, and manage spatial data, analyze spatial problems, and display the data in cartographic layouts Geographic Information Sciences apart from cartography, while related but still uniquely separate, is the ability to combine spatial with non-spatial data Attributes related to a location but not describing its physical placement in space, such as information about a tree's age, type, and health. and solve problems rapidly and repetitively. GIS Geographic Information Systems the software used to create, store, and manage spatial data, analyze spatial problems, and display the data in cartographic layouts Geographic Information Sciences is everywhere, and the longer you stay in the field, the more you'll recognize it. Everything from how the UPS driver delivers packages efficiently (each package scanned onto the truck is added to the system, which analyzes the addresses and sets up a route) to how a business might mail out targeted fliers (looking at demographics to choose likely customers) to how Jon Taffer knows the median income and age for each bar he rescues (using census data displayed on a map... notice "and Esri" in the credits). GIS Geographic Information Systems the software used to create, store, and manage spatial data, analyze spatial problems, and display the data in cartographic layouts Geographic Information Sciences is the hidden science affecting our daily lives without us even realizing it. It allows us to look at non-spatial data Attributes related to a location but not describing its physical placement in space, such as information about a tree's age, type, and health. spatially, empowering us with the power of location and enabling us to solve problems in ways never before imagined.
1.3.2: Spatial and Non-Spatial Data
Spatial and non-spatial data Attributes related to a location but not describing its physical placement in space, such as information about a tree's age, type, and health. are two terms you'll hear repeatedly in this course. Understanding them is crucial to grasping GIS Geographic Information Systems the software used to create, store, and manage spatial data, analyze spatial problems, and display the data in cartographic layouts Geographic Information Sciences . We introduced them briefly earlier, so now let's explore what they mean. Spatial data refers to anything dealing with location, like addresses, building footprints, city and county boundaries, and tree locations in a neighborhood. Non-spatial data includes things we can attribute to that place. For example, the location of a tree on Main Street is spatial data, while identifying it as a 31-year-old maple tree in good health is non-spatial. We can map spatial data, but non-spatial data Attributes related to a location but not describing its physical placement in space, such as information about a tree's age, type, and health. is trickier. Intangible things are hard to represent on paper. When John Taffer notes a neighborhood's average age and median income, how do you map those? By themselves, they can't be mapped. It's possible to map city boundaries, though, and link non-spatial data Attributes related to a location but not describing its physical placement in space, such as information about a tree's age, type, and health. like age and income to a spatial location.
1.3.3: Solving Spatial Problems
Numb3rs, a series that ran for several seasons on CBS is about an FBI Special Agent, Don Epps, and his brother, Charlie Epps, who is a mathematician and professor at a University. In the series pilot, The Point of Origin, Don cannot solve a series of 13 murders happening around the city. At a family dinner one evening, Charlie looks at a map with the location of said murders and realizes that the FBI is attempting to analyze the importance of the locations in an impossible attempt to predict the probable location of the next crime with a process called "predictive analysis". The problem lies with the fact that probable analysis will not work with sado-serial crimes (a series of crimes committed without forethought or planning where the perpetrator commits the crime).
Charlie explains to Don while they are both watching the yard sprinkler that there is no way to mathematically predict where the next drop of water will land, as there are too many variables (air movement, mechanical change, or failure of the sprinkler, etc). However, he explains, by examining the pattern of where enough water drops fell, the location of the sprinkler can then be mathematically determined by reverse engineering how the drops landed. Charlie agrees it is an impossible task to predict the location of the next crime, but by using the pattern of the previous crimes, a point A GIS vector data in any sort of digital science or art, is simply denoting a type of graphical representation using straight lines to construct the outlines of objects geometry type which is made up of just one vertex pl. vertices One of a set of ordered x,y coordinate pairs that defines the shape of a line or polygon feature. , marking a single XY location in any given geographic or projected coordinate system. of origin can be determined, meaning they can't possibly know where the next crime will happen but they can determine where the perpetrator lives or works.
Charlie and Don create a list of factors that the perpetrator uses to select his victims, a process called profiling. On the list, they put that the crimes will happen in areas of low traffic (foot and car) and high isolation; in an area away from where they live - a buffer zone (the name of a GIS Geographic Information Systems the software used to create, store, and manage spatial data, analyze spatial problems, and display the data in cartographic layouts Geographic Information Sciences tool), which will vary in size in the beginning of a cycle of crimes, but becomes more defined as the cycle matures; and lastly, the concept of "distance decay", where the more intensity the attacker feels about a crime, the further he will travel to commit it, meaning the victims which suffer the greatest are at the greatest distances from the origin.
Combining profiling with predictive analysis allowed the FBI agent and the mathematician to combine the known spatial data specific to the series of crimes at hand, such as the location of the crimes and the understood psychological patterns of movement and behavior with the non-spatial data Attributes related to a location but not describing its physical placement in space, such as information about a tree's age, type, and health. , such as the selected patterns of a specific criminal concerning the type of crime and the pattern used to commit that crime, to determine where the criminal lives or works in a process known as geographic profiling. Knowing how to lay out the patterns of data across a map allows Charlie to complete spatial statistics (probability and distribution of spatial data to determine patterns), producing a map displaying both hot spot analysis and multiple ring buffers (all concepts fully covered in Intermediate GIS Geographic Information Systems the software used to create, store, and manage spatial data, analyze spatial problems, and display the data in cartographic layouts Geographic Information Sciences ) to determine the most likely location of the perpetrators home. And because it's TV, everything works out in the end and they stop the criminal.
| Figure 1.1: Numb3rs Pilot Episode on CBS |
|---|
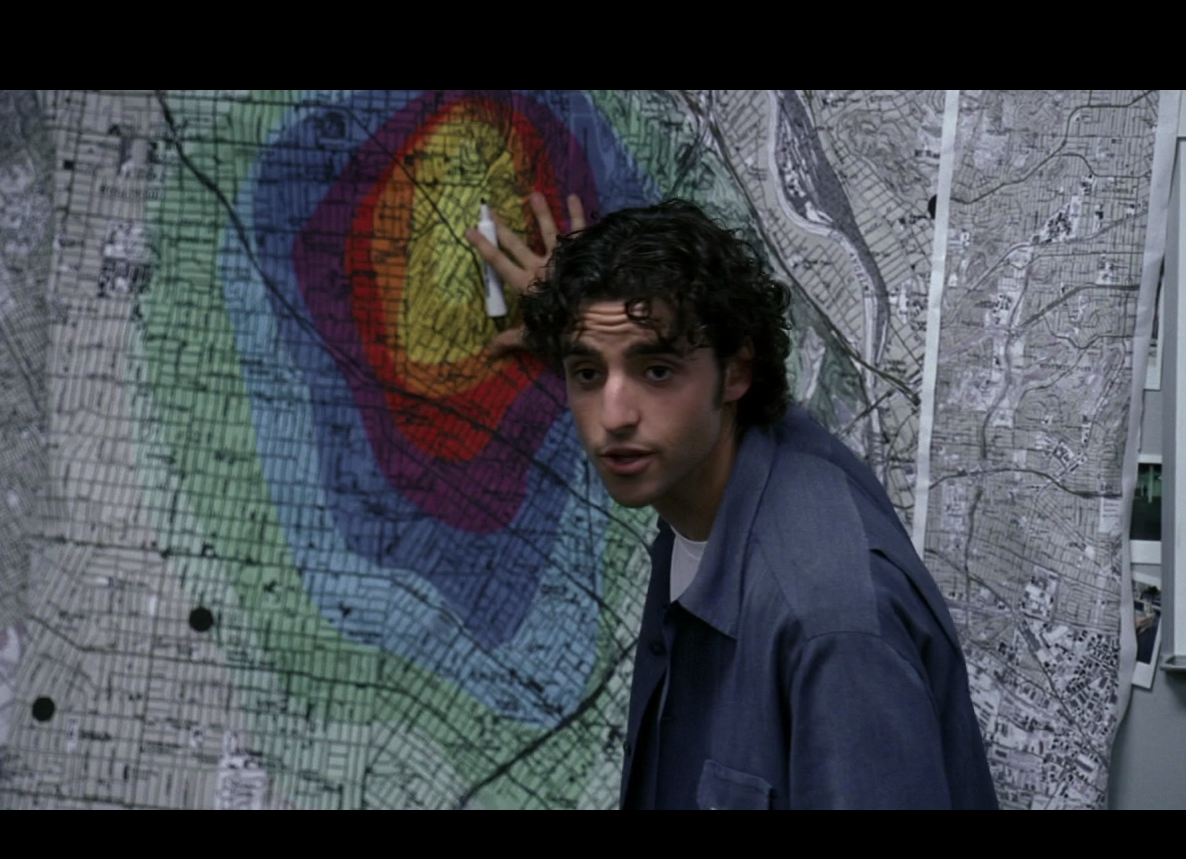 |
| Charlie stands in front of a map he created in the GIS Geographic Information Systems the software used to create, store, and manage spatial data, analyze spatial problems, and display the data in cartographic layouts Geographic Information Sciences with intention of determining where a criminal lives based on his patterns of movement. |
1.3.4: Rapid and Repeatable Data Analysis
The GIS Geographic Information Systems the software used to create, store, and manage spatial data, analyze spatial problems, and display the data in cartographic layouts Geographic Information Sciences is capable of solving spatial problems using spatial and non-spatial data Attributes related to a location but not describing its physical placement in space, such as information about a tree's age, type, and health. quite easily. Like in our example, Charlie was able to narrow down the possible location of the criminal, which in itself is pretty dang cool. What is more important about why he used the GIS Geographic Information Systems the software used to create, store, and manage spatial data, analyze spatial problems, and display the data in cartographic layouts Geographic Information Sciences instead of completing the calculations by hand is not the fact that the software produced a very nice map for the FBI, but the fact that he was able to complete his task in a rapid manner. And if there was another case similar or the same as this particular case, he already solved the problem once in the GIS Geographic Information Systems the software used to create, store, and manage spatial data, analyze spatial problems, and display the data in cartographic layouts Geographic Information Sciences , most likely creating a custom tool for the process, which he is capable of solving again in a rapid manner. In fact, during the episode, the FBI locates more accurate non-spatial data Attributes related to a location but not describing its physical placement in space, such as information about a tree's age, type, and health. (the guy moved out of the apartment, but still worked in the area), which reduced the search area. Charlie was able to quickly re-do the calculations and re-produce a map for the FBI to find the guy faster.
What is key about why Charlie used the GIS Geographic Information Systems the software used to create, store, and manage spatial data, analyze spatial problems, and display the data in cartographic layouts Geographic Information Sciences instead of completing the calculations by hand is the fact that he was able to complete the needed analysis in a rapid and repeatable manner. The GIS Geographic Information Systems the software used to create, store, and manage spatial data, analyze spatial problems, and display the data in cartographic layouts Geographic Information Sciences allows us to complete complex analyses in less time with more accurate results (since a lot of the math is being done by a computer, it has a better chance of being correct. We can create custom tools or sequences of pre-installed tools to help future us or a co-worker. By automating as much as we can in the software, our analysis time goes way down for tasks, our accuracy goes up, and the ability to repeat our results is available.
1.3.5: Thinking Spatially
In 1959, Jerome Bruner conducted a scientific study of fifth-grade student learning geography for the first time. They were broken into two groups and each taught the same material about the Northeastern United States, but in two totally different manners.
One group learned geography as a set of rational acts of induction—that cities spring up where there is water, where there are natural resources, where there are things to be processed and shipped. The other group learned passively that there were arbitrary cities at arbitrary places by arbitrary bodies of water and arbitrary sources of supply. One learned geography as a form of activity. The other stored some names and positions as a passive form of registration.
We hit upon the happy idea of presenting this chunk of geography not as a set of knowns, but as a set of unknowns. One class was presented blank maps, containing only tracings of the rivers and lakes of the area as well as the natural resources. They were asked as a first exercise to indicate where the principal cities would be located, where the railroads, and where the main highways. Books and maps were not permitted and “looking up the facts” was cast in a sinful light. Upon completing this exercise, a class discussion was begun in which children attempted to justify why the major city would be here, a large city there, a railroad on this line, etc. The discussion was a hot one. After an hour, and much pleading, permission was given to consult the rolled up wall map. I will never forget one young student, as he pointed his finger at the foot of Lake Michigan, shouting, “Yipee, Chicago is at the end of the pointing-down lake.” And another replying, “Well, OK: but Chicago’s no good for the rivers and it should be here where there is a big city (St. Louis).” These children were thinking, and learning was an instrument for checking and improving the process. To at least a half dozen children in the class it is not a matter of indifference that no big city is to be found at the junction of Lake Huron, Lake Michigan, and Lake Superior. They were slightly shaken up transportation theorists when the facts were in. (Bruner, 1959, pp. 187–188)
The children in this study were able to take the ideas they learned about how cities are developed and convert them into a logical map using a concept called spatial thinking.
Just as the children were asked to do in the "fill in the map" problem, geospatial sciences A discipline that focuses on using information technology to understand people, places, and processes of the earth. Spatial analysis of human and physically variables is fundamental to the discipline. will require you to examine our world and non-spatial data Attributes related to a location but not describing its physical placement in space, such as information about a tree's age, type, and health. in a way that you may have never examined it before. The ability to think spatially about a problem and reason the answer over a geographic area is something you have done all of your life, but now we are going to put it into a focused practice. Spatial thinking requires the ability to draw upon your past experiences and apply them to a new problem utilizing space, the distribution of objects in the real world, and a means of representing those objects. In terms of spatial thinking, we define space as the understanding of measurement systems and how they are applied practically in the world. Understanding space is not just knowing that a mile is 5,280 feet, but comprehending how far a mile walk is, how long it would take you, and the cost to get there (as there is a cost to everything we do in life, most often measured in time and money). In Chapter Two, we will learn how we measure the Earth and represent it in maps and globes and how we use a defined system of labels and locations to navigate our world. Being able to convert the knowledge you gain in that chapter in regards to how we measure the Earth to what it means in regards to the spatial distribution of objects is at the core of spatial thinking.
Looking at our example with Charlie and Don, the GIS Geographic Information Systems the software used to create, store, and manage spatial data, analyze spatial problems, and display the data in cartographic layouts Geographic Information Sciences produced a map with the most likely area in the middle and the least likely areas on the outside. In reality, Los Angeles does not have red and blue areas painted to match the map exactly, instead, the GIS Geographic Information Systems the software used to create, store, and manage spatial data, analyze spatial problems, and display the data in cartographic layouts Geographic Information Sciences produced a data layer which was drawn on top of a map of the city. Once the colors were on the map, the solution became clear. Charlie was able to take the crime distribution map represented as single points and turn it into a probability map. His ability to combine space, representation, and analysis is how he was able to help his brother solve the problem.
This class will challenge you in two ways: first, you will be asked to learn fundamental ideas in geospatial sciences A discipline that focuses on using information technology to understand people, places, and processes of the earth. Spatial analysis of human and physically variables is fundamental to the discipline. , things like how we measure the Earth and how we define different kinds of spatial data, understanding not just the definitions of the required vocabulary, but really comprehend how the ideas were formed and what that means to you as a geospatial scientist; and second, learn a GIS Geographic Information Systems the software used to create, store, and manage spatial data, analyze spatial problems, and display the data in cartographic layouts Geographic Information Sciences software suite, not just the basics like how to fill tools in and how to save data in the proper places, but to really understand what the tool is trying to accomplish and what it means for you in the course of solving problems. In lab, you will be asked (over and over, mind you) to read the help blurb for a GIS Geographic Information Systems the software used to create, store, and manage spatial data, analyze spatial problems, and display the data in cartographic layouts Geographic Information Sciences tool, summarize what the tool does, what you think the outcome of the tool will be based on the inputs you are providing, and then examine the output data layer. Learning GIS Geographic Information Systems the software used to create, store, and manage spatial data, analyze spatial problems, and display the data in cartographic layouts Geographic Information Sciences is not just memorizing how to fill in tool dialog boxes, but instead really understanding how the tool will transform your data and what that means in the overall analysis. Charlie didn't just see a series of points on a map, he was able to see a pattern in those points and use math and the GIS Geographic Information Systems the software used to create, store, and manage spatial data, analyze spatial problems, and display the data in cartographic layouts Geographic Information Sciences to provide him an answer that we normally would not have any way to place on a map. He was able to think spatially to understand space, represent locations on a map, and analyze the potential areas, producing a map where he and his brother were able to solve the crime and look like superheroes (which, if you have never watched the show, is pretty much the plot line to every single episode).
Reading Concept Quiz
Throughout the reading, you will be presented with quick little "Concept Quizzes" which are designed for you to quickly quiz yourself on the page's reading. These quizzes are just to check this page, are not worth any points in the class, nor will they count towards your grade at all. Checkpoint Quizzes are a real thing and can be found in the Quizzes section of D2L (My Courses).