Probably the most common activity in GIS Geographic Information Systems the software used to create, store, and manage spatial data Data that deals with location, such as lists of addresses, the footprint of a building, the boundaries of cities and counties, etc. , analyze spatial problems, and display the data in cartographic layouts Geographic Information Sciences is locating geographical features (shapes representing real-world entities) and their accompanying attributes that match a specific search criterion, helping us answer spatial questions. In GIS Geographic Information Systems the software used to create, store, and manage spatial data Data that deals with location, such as lists of addresses, the footprint of a building, the boundaries of cities and counties, etc. , analyze spatial problems, and display the data in cartographic layouts Geographic Information Sciences , we often have vector data in any sort of digital science or art, is simply denoting a type of graphical representation using straight lines to construct the outlines of objects along with attribute tables that contain more features than we need at any given moment. To focus on features of interest, we utilize three selection processes: 1. Select by Attribute: This method leverages the values of features in the attribute table to identify relevant records. 2. Select by Location: This approach examines the spatial relationships between features, irrespective of their attributes. 3. Interactive Selection: Using a tool in ArcGIS, users can directly click on features displayed on the map to select them.
We say selection or selecting data in reference to both the features we see in the map and the rows found in the attribute table because that is what we are doing: picking out attributes in the table or features in the map, resulting in the rows in the table and the features in the map becoming highlighted, or selected . Notice we said "picking out attributes" and "resulting in highlighted rows", referring to the fact that we are interested in the attributes - the describing words - and the resulting action in the structure of the table is the entire row being highlighted. There is a distinct difference between the two; understanding this difference is crucial, as the attributes tell a story of the feature while the row in a table is merely a structural element, impacting how we analyze and interpret data.
Given the often overwhelming amount of data, we may choose to examine attributes of a single feature or compare attributes of features across different layers to gain better insights. Performing these selection processes is essential as they allow us to streamline our data analysis by reducing the number of features displayed on the map and the corresponding records in the table. For instance, refer to the image in Figure 5.6. This illustration clearly demonstrates that when a row is selected in the attribute table, the corresponding feature such as the polygon for Colorado is also highlighted on the map.
| Figure 5.6: Features Selected in the Attribute Table and on the Map |
|---|
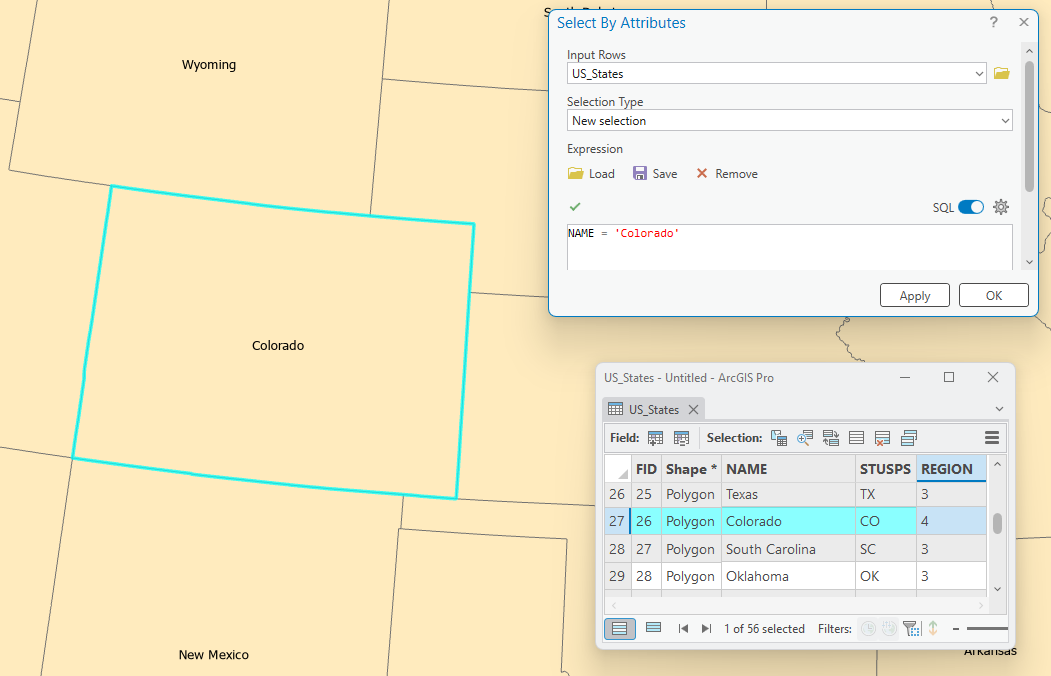 |
In this screenshot, we observe one record selected, indicated by the label (1 out of 56 selected) at the bottom of the attribute table. The corresponding feature, Colorado, is also selected on the map. Both the feature on the map (the polygon representing Colorado) and the row in the table are highlighted in cyan. In this example, the attribute of interest is the name 'Colorado'. The row highlighted in the table is labeled with a Feature Identifier (FID) of '26'. Note that ArcGIS Pro uses an automatic numbering system starting from 1, while most attribute tables begin counting at 0. After querying (using a formatted question to ask the table to return or select values) the table for the attribute 'Colorado' using a formatted question, the corresponding feature in the map was highlighted. Another scenario where this result occurs is when a user selects the shape of Colorado directly on the map, prompting the corresponding row to be highlighted in the attribute table. The primary intent here is to highlight the shape of Colorado, which simultaneously highlights its corresponding row in the attribute table to showcase their connection. |
NOTE: Each feature on the map corresponds to a row in the attribute table. When you select one feature on the map, its corresponding row in the table also becomes selected. Therefore, the term 'feature' is often used interchangeably to describe both the geometric object and its representation in the table.
In the following few pages, we will explore the methods used to select features from a layer based upon the attributes, spatial locations, or visually picking and choosing features we see on the map, but first, lets look at the fourth and final “List by...” option found in the Table of Contents - List by Selection (we looked at the first three, List by Drawing Order, List by Source, and List by Visibility in 4.4.5: The Contents Pane).
5.4.2: ArcGIS Pro Contents Pane Views - List By Selection
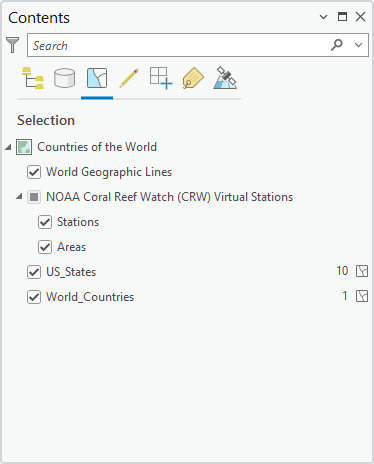
List by Selection divides the Contents pane allows a user to quickly see which layers have a selection in addition to how many features are selected in each layer. For this specific map, the Counties shapefile One of the two main types of vector data in any sort of digital science or art, is simply denoting a type of graphical representation using straight lines to construct the outlines of objects we learn in this class (there are more than two vector data in any sort of digital science or art, is simply denoting a type of graphical representation using straight lines to construct the outlines of objects types in GIS). Shapefiles are each only one geometry type, either a point, a polyline, or a polygon. Shapefiles are stored in folders and most often do not have relationships with other data. has no features selected, the Lower 48 Zip Codes shapefile One of the two main types of vector data in any sort of digital science or art, is simply denoting a type of graphical representation using straight lines to construct the outlines of objects we learn in this class (there are more than two vector data in any sort of digital science or art, is simply denoting a type of graphical representation using straight lines to construct the outlines of objects types in GIS). Shapefiles are each only one geometry type, either a point, a polyline, or a polygon. Shapefiles are stored in folders and most often do not have relationships with other data. has 8 features selected, the US States shapefile One of the two main types of vector data in any sort of digital science or art, is simply denoting a type of graphical representation using straight lines to construct the outlines of objects we learn in this class (there are more than two vector data in any sort of digital science or art, is simply denoting a type of graphical representation using straight lines to construct the outlines of objects types in GIS). Shapefiles are each only one geometry type, either a point, a polyline, or a polygon. Shapefiles are stored in folders and most often do not have relationships with other data. has one feature selected, the National Land Cover Dataset (NLCD) integer raster has one class selected, and the Coffee Shops data table has no records selected.
 |
| Clearing Selected Features |
5.4.3: Examining the Term “Layer”
As we’ve seen before, sometimes we use one word to mean two things in GIS Geographic Information Systems the software used to create, store, and manage spatial data Data that deals with location, such as lists of addresses, the footprint of a building, the boundaries of cities and counties, etc. , analyze spatial problems, and display the data in cartographic layouts Geographic Information Sciences , such as "feature" referring to both the geometric shape we see on the map and a row in the attribute table, or when the word “ projection technically: the result of using one of variety of methods to transfer the geographic locations of features from a geographic coordinate system to a developable surface everyday use: any coordinate system, geographic or projected ” is used instead of "coordinate system" to describe both geographic and projected coordinate systems. "Layer" is another one of those words. Sorry.
Traditionally, the term 'layer' in paper map analysis referred to distinct transparent sheets. Each sheet exhibited different features: roads drawn on one, rivers on another, and contour lines on a third. The sheets were then overlaid or layered to allow for visual analysis of the intersecting features. In modern GIS Geographic Information Systems the software used to create, store, and manage spatial data Data that deals with location, such as lists of addresses, the footprint of a building, the boundaries of cities and counties, etc. , analyze spatial problems, and display the data in cartographic layouts Geographic Information Sciences , the term 'layer' refers to any spatial file added to the Table of Contents. These can include raster data Raster data is a type of digital data that stores information about a location using a grid of pixels or cells. All spatial rasters are raster files, but not all raster files are spatial rasters. , vector data in any sort of digital science or art, is simply denoting a type of graphical representation using straight lines to construct the outlines of objects , feature classes, and shapefiles. A layer is visually represented by its stacking order.
When a polygon vector file is added to ArcGIS Pro, it is assigned a random color and a dark gray outline. Points appear as randomly colored circles with black outlines, while polylines are represented as lines of varying random colors. The software attempts to jump around the color circle, maybe choosing a green one for one layer and a red for the next. In summary, the colors assigned to vector files in ArcGIS Pro appear random, resulting in varied displays for identical types of data.
In ArcGIS Pro, an Esri Layer file (.lyrx) is a specialized format that allows users to define and customize the way vector data in any sort of digital science or art, is simply denoting a type of graphical representation using straight lines to construct the outlines of objects is displayed. To better understand an Esri Layer (.lyrs) file, think of it as an advanced set of rules that governs how a given vector file is visually represented. Unlike non-Esri layers that show with random colors, an Esri Layer (.lyrx) file enables users to choose custom colors, labels, and visible features. To customize a US_States layer in ArcGIS Pro, you would create an Esri Layer (.lyrx) file specifying a lime green fill, a 3pt wide fuchsia outline, and label display while hiding Texas. Then, when the user loads the Esri Layer (.lyrx) file, the display will be exactly how you set it, with the desired colors, labels, and visible features.
It is essential that ALL Esri Layer (.lyrx) files are paired with a specific vector file, as the rules defined therein apply to that particular file. ALL Esri Layer (.lyrx) files need to be paired with a vector file about which the rules are being made. If you would like the US_States layer to show up with a fuchsia outline, a lime green fill, the labels turned on, and Texas hidden, it can be done, as long as the first rule in the list is that the list of rules is describing how a specific vector shapefile One of the two main types of vector data in any sort of digital science or art, is simply denoting a type of graphical representation using straight lines to construct the outlines of objects we learn in this class (there are more than two vector data in any sort of digital science or art, is simply denoting a type of graphical representation using straight lines to construct the outlines of objects types in GIS). Shapefiles are each only one geometry type, either a point, a polyline, or a polygon. Shapefiles are stored in folders and most often do not have relationships with other data. should look.
In this text, the word 'layer' will refer to spatial files layered together, while 'Esri Layer (.lyrx)' will represent a specific format with a capital 'L.' Referencing 'layer' in this text will signify any spatial file layered with others, while 'Layer (.lyrx)' will denote a specific file type with proper noun capitals to highlight its significance.
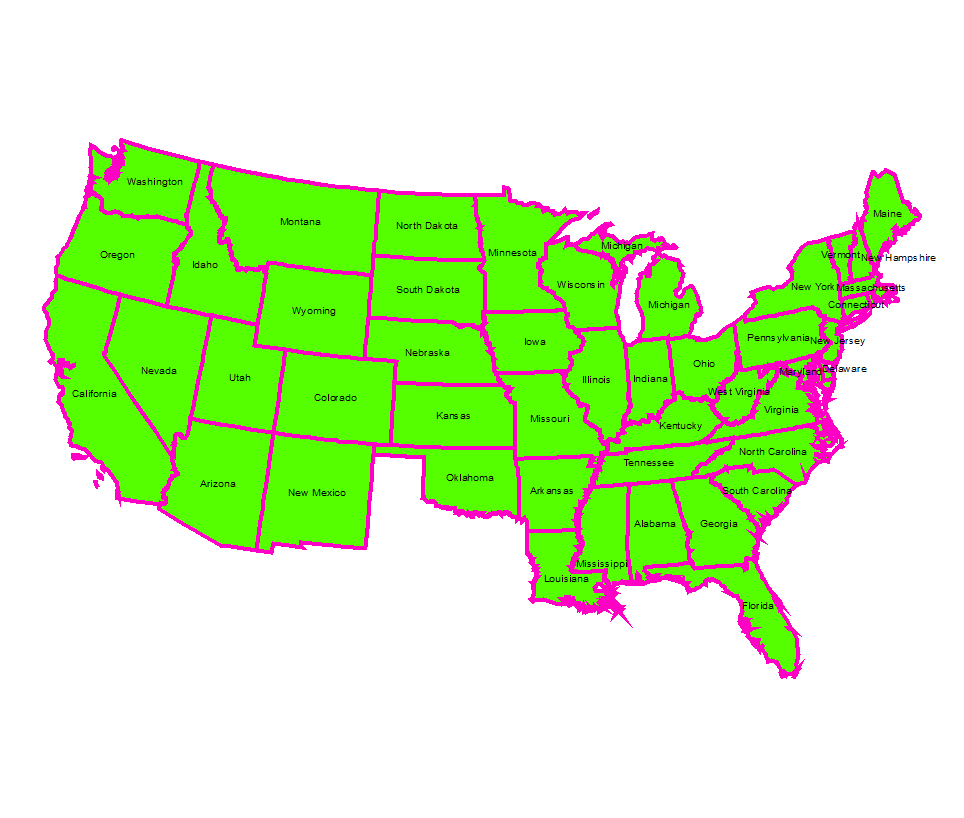
| Figure 5.7: Esri Layer (.lyrx) Files are Lists of Rules to Display Vector Files | |
|---|---|
 | Display Rules for US_States
|
| In this example, the Esri Layer (.lyrx) file has a list of rules that tell ArcGIS Pro to display a US_States vector file with a lime green fill, a fuchsia outline, have the states labeled, and have Texas hidden. The rules describe how the vector file will look upon load, while still calling a shapefile One of the two main types of vector data in any sort of digital science or art, is simply denoting a type of graphical representation using straight lines to construct the outlines of objects we learn in this class (there are more than two vector data in any sort of digital science or art, is simply denoting a type of graphical representation using straight lines to construct the outlines of objects types in GIS). Shapefiles are each only one geometry type, either a point, a polyline, or a polygon. Shapefiles are stored in folders and most often do not have relationships with other data. or feature class One of the two main types of vector data in any sort of digital science or art, is simply denoting a type of graphical representation using straight lines to construct the outlines of objects we learn in this class (there are more than two vector data in any sort of digital science or art, is simply denoting a type of graphical representation using straight lines to construct the outlines of objects types in GIS). Feature classes are each only one geometry type, either a point A GIS vector data in any sort of digital science or art, is simply denoting a type of graphical representation using straight lines to construct the outlines of objects geometry type which is made up of just one vertex pl. vertices One of a set of ordered x,y coordinate pairs that defines the shape of a line or polygon feature. , marking a single XY location in any given geographic or projected coordinate system. , a polyline A GIS vector data in any sort of digital science or art, is simply denoting a type of graphical representation using straight lines to construct the outlines of objects geometry type which is made up of two or more vertices connected by straight lines. Often used to represent objects such as roads, river, and boundaries. , or a polygon. Feature classes are stored in geodatabases and are most often used when data relationships are important. on the computer. | |