In the previous section, we unveiled the essential concept of selecting data, a critical skill in effective data analysis. This sets the stage for understanding three main methods of selection that enhance our analytical capabilities. We can use three main methods: Select by Attribute (which allows querying data based on its characteristics), Select by Location (which focuses on the spatial relationship of data), and Interactive Selection (which engages users in real-time data manipulation). These methods help highlight important features on a map or in a table, making it easier to isolate them from others. Understanding these methods leads us to an important question: how can we apply these selections to extract meaningful insights from our data? Before we explore the three selection methods, let's look at some of the more common uses of selected data.
| Figure 5.8: Selected Records |
|---|
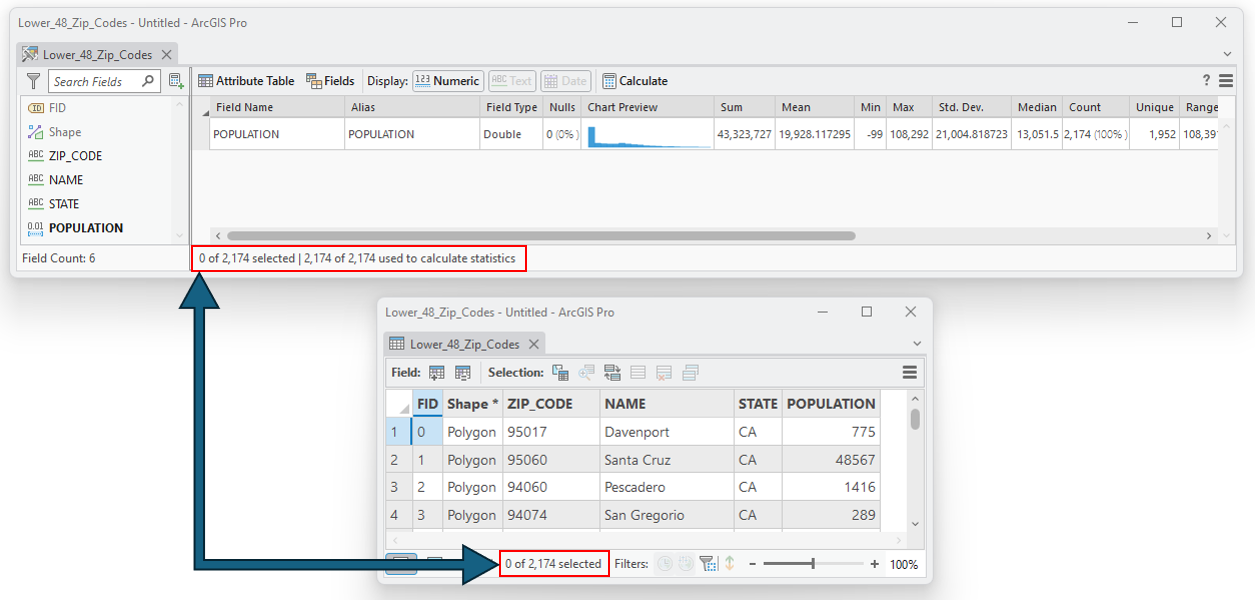
| After making a selection, the attribute table notes the number of selected records out of the total number of records, In this example, we see that 932 records out of the 2,174 total records are selected. This means our vector layer has 2,174 rows/features, and some selection method resulted in 932 of them being selected/highlighted. |
Looking for Answers in the Attribute Table
One of the simplest actions we can take with selected data is to answer quick questions without delay. Selections visually separate values by highlighting lines that answer questions about attributes. This also applies to questions regarding spatial interactions between layers. For example, if you have a layer of rivers and want to find out how many are Class 1, you can easily use the selection to find the count. Using an attribute table-based query (the topic of the next section), you can highlight just those rows and obtain a count by looking at the number of selected records out of the total number of records. Finding a count of records is just one example of quick interactions with the data; other possibilities include assessing various statistics, comparing selected attributes, or visualizing data on a map. Other examples include examining other fields once a selection is made to find out more, seeing where selected features lie on the map, and exploring the distribution of features across some area. It's important to note, however, that while these quick interactions do not fully quantify the data, they provide useful insights into the dataset we are analyzing.
Arithmetic and Statistics
The Explore Statistics tool provides a quick and efficient way to generate arithmetic and statistical summaries based on selected records in an attribute table. The software automatically calculates these statistics using only the currently selected records, allowing for focused analysis of specific subsets of data. Key metrics such as mean, median, sum, minimum, maximum, and standard deviation help users understand the distribution and variability of numerical attributes. For example, when working with a dataset of traffic counts at different intersections, the tool can quickly summarize average daily traffic, identify peak and low-traffic locations, and assess overall variation across the selected records. This makes it a valuable tool for preliminary data exploration, helping users compare different subsets before performing more advanced spatial or statistical analyses.
| Figure 5.9: The Statistics Tool: Selected and All Features |
|---|
 |
| When no selection is made in an attribute table, the statistics tool will refer to all the features in the entire field. In this example, the Lower 48 States Zip Code shapefile One of the two main types of vector data in any sort of digital science or art, is simply denoting a type of graphical representation using straight lines to construct the outlines of objects we learn in this class (there are more than two vector data in any sort of digital science or art, is simply denoting a type of graphical representation using straight lines to construct the outlines of objects types in GIS). Shapefiles are each only one geometry type, either a point, a polyline, or a polygon. Shapefiles are stored in folders and most often do not have relationships with other data. has 2,174 features, and the Statics box is showing the population total with a count of 51. |
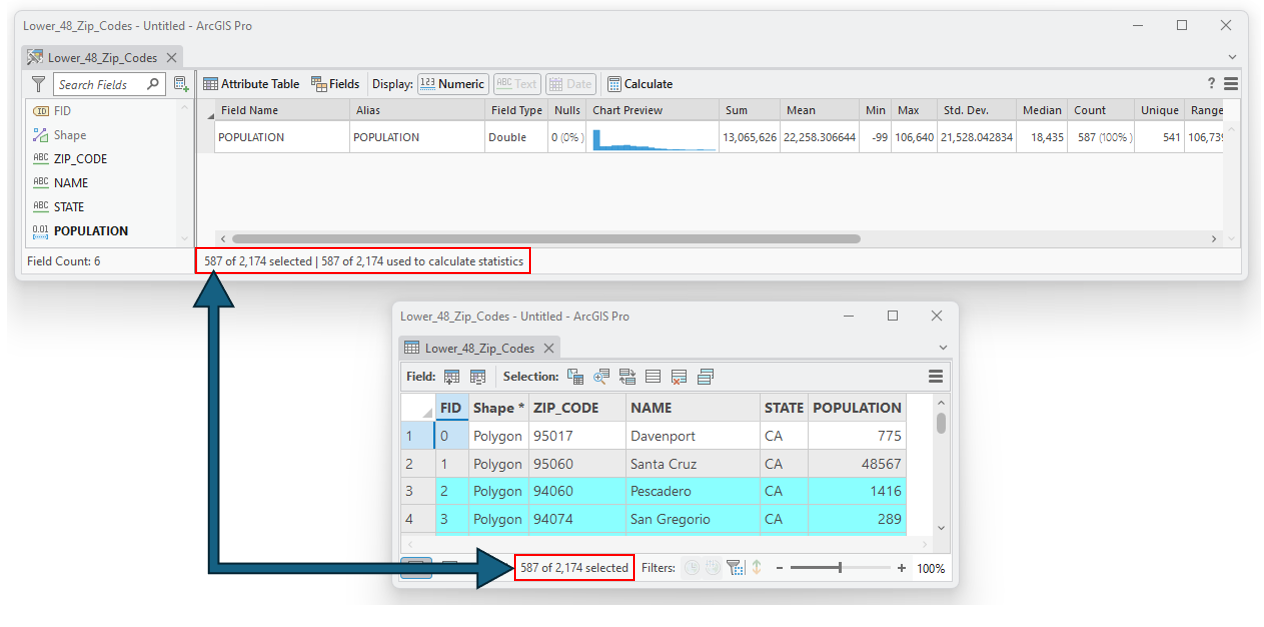 |
| When a selection is made the Explore Statistics tool will compute the values for just the selected features, as noted when the count is 587. |
Creating Data Subsets
One of the most common tasks after selecting data is to create a data subset, or exporting just the selected features to a new feature class One of the two main types of vector data in any sort of digital science or art, is simply denoting a type of graphical representation using straight lines to construct the outlines of objects we learn in this class (there are more than two vector data in any sort of digital science or art, is simply denoting a type of graphical representation using straight lines to construct the outlines of objects types in GIS). Feature classes are each only one geometry type, either a point A GIS vector data in any sort of digital science or art, is simply denoting a type of graphical representation using straight lines to construct the outlines of objects geometry type which is made up of just one vertex pl. vertices One of a set of ordered x,y coordinate pairs that defines the shape of a line or polygon feature. , marking a single XY location in any given geographic or projected coordinate system. , a polyline A GIS vector data in any sort of digital science or art, is simply denoting a type of graphical representation using straight lines to construct the outlines of objects geometry type which is made up of two or more vertices connected by straight lines. Often used to represent objects such as roads, river, and boundaries. , or a polygon. Feature classes are stored in geodatabases and are most often used when data relationships are important. or shapefile One of the two main types of vector data in any sort of digital science or art, is simply denoting a type of graphical representation using straight lines to construct the outlines of objects we learn in this class (there are more than two vector data in any sort of digital science or art, is simply denoting a type of graphical representation using straight lines to construct the outlines of objects types in GIS). Shapefiles are each only one geometry type, either a point, a polyline, or a polygon. Shapefiles are stored in folders and most often do not have relationships with other data. . The export process will create a new layer containing only the selected features (of the vector data in any sort of digital science or art, is simply denoting a type of graphical representation using straight lines to construct the outlines of objects type, either feature class One of the two main types of vector data in any sort of digital science or art, is simply denoting a type of graphical representation using straight lines to construct the outlines of objects we learn in this class (there are more than two vector data in any sort of digital science or art, is simply denoting a type of graphical representation using straight lines to construct the outlines of objects types in GIS). Feature classes are each only one geometry type, either a point A GIS vector data in any sort of digital science or art, is simply denoting a type of graphical representation using straight lines to construct the outlines of objects geometry type which is made up of just one vertex pl. vertices One of a set of ordered x,y coordinate pairs that defines the shape of a line or polygon feature. , marking a single XY location in any given geographic or projected coordinate system. , a polyline A GIS vector data in any sort of digital science or art, is simply denoting a type of graphical representation using straight lines to construct the outlines of objects geometry type which is made up of two or more vertices connected by straight lines. Often used to represent objects such as roads, river, and boundaries. , or a polygon. Feature classes are stored in geodatabases and are most often used when data relationships are important. or shapefile One of the two main types of vector data in any sort of digital science or art, is simply denoting a type of graphical representation using straight lines to construct the outlines of objects we learn in this class (there are more than two vector data in any sort of digital science or art, is simply denoting a type of graphical representation using straight lines to construct the outlines of objects types in GIS). Shapefiles are each only one geometry type, either a point, a polyline, or a polygon. Shapefiles are stored in folders and most often do not have relationships with other data. , depending on where the new layer is going to be stored - geodatabase electronic storage container specifically used to store geographic/ spatial data Data that deals with location, such as lists of addresses, the footprint of a building, the boundaries of cities and counties, etc. with a top-down structure in which the items contained are related to each other and that relationship allows for the data to be quickly and efficiently queried and retrieved for use. or folder, respectively). For example, if you need a layer that contains only the State of Colorado, there is no need to spend hours searching for a Colorado.shp shapefile One of the two main types of vector data in any sort of digital science or art, is simply denoting a type of graphical representation using straight lines to construct the outlines of objects we learn in this class (there are more than two vector data in any sort of digital science or art, is simply denoting a type of graphical representation using straight lines to construct the outlines of objects types in GIS). Shapefiles are each only one geometry type, either a point, a polyline, or a polygon. Shapefiles are stored in folders and most often do not have relationships with other data. when layers of the United States as whole are easy to find. By selecting the State of Colorado from the US States shapefile One of the two main types of vector data in any sort of digital science or art, is simply denoting a type of graphical representation using straight lines to construct the outlines of objects we learn in this class (there are more than two vector data in any sort of digital science or art, is simply denoting a type of graphical representation using straight lines to construct the outlines of objects types in GIS). Shapefiles are each only one geometry type, either a point, a polyline, or a polygon. Shapefiles are stored in folders and most often do not have relationships with other data. and exporting a new shapefile One of the two main types of vector data in any sort of digital science or art, is simply denoting a type of graphical representation using straight lines to construct the outlines of objects we learn in this class (there are more than two vector data in any sort of digital science or art, is simply denoting a type of graphical representation using straight lines to construct the outlines of objects types in GIS). Shapefiles are each only one geometry type, either a point, a polyline, or a polygon. Shapefiles are stored in folders and most often do not have relationships with other data. - Colorado.shp - you’ve got it made in the shade.
The purpose of subsetting data (creating a data subset) is to create a layer with a smaller amount of data which serves our purpose in a more focused way. Often, we download data which has hundreds or thousands of features, and we are just not interested in all of those features. Some may fall outside an area of interest or study site, some may be outside of a time frame which fits the scope of our project, or some might not meet the minimum size requirement. These are just a few examples of why we might create a data subset - there are theoretically infinite reasons why some features may not make the cut of a specific project - but in all cases, the data set one started with was much too large and needed to be pared down into a subset of the original.
| Figure 5.10: Data Subsets |
|---|
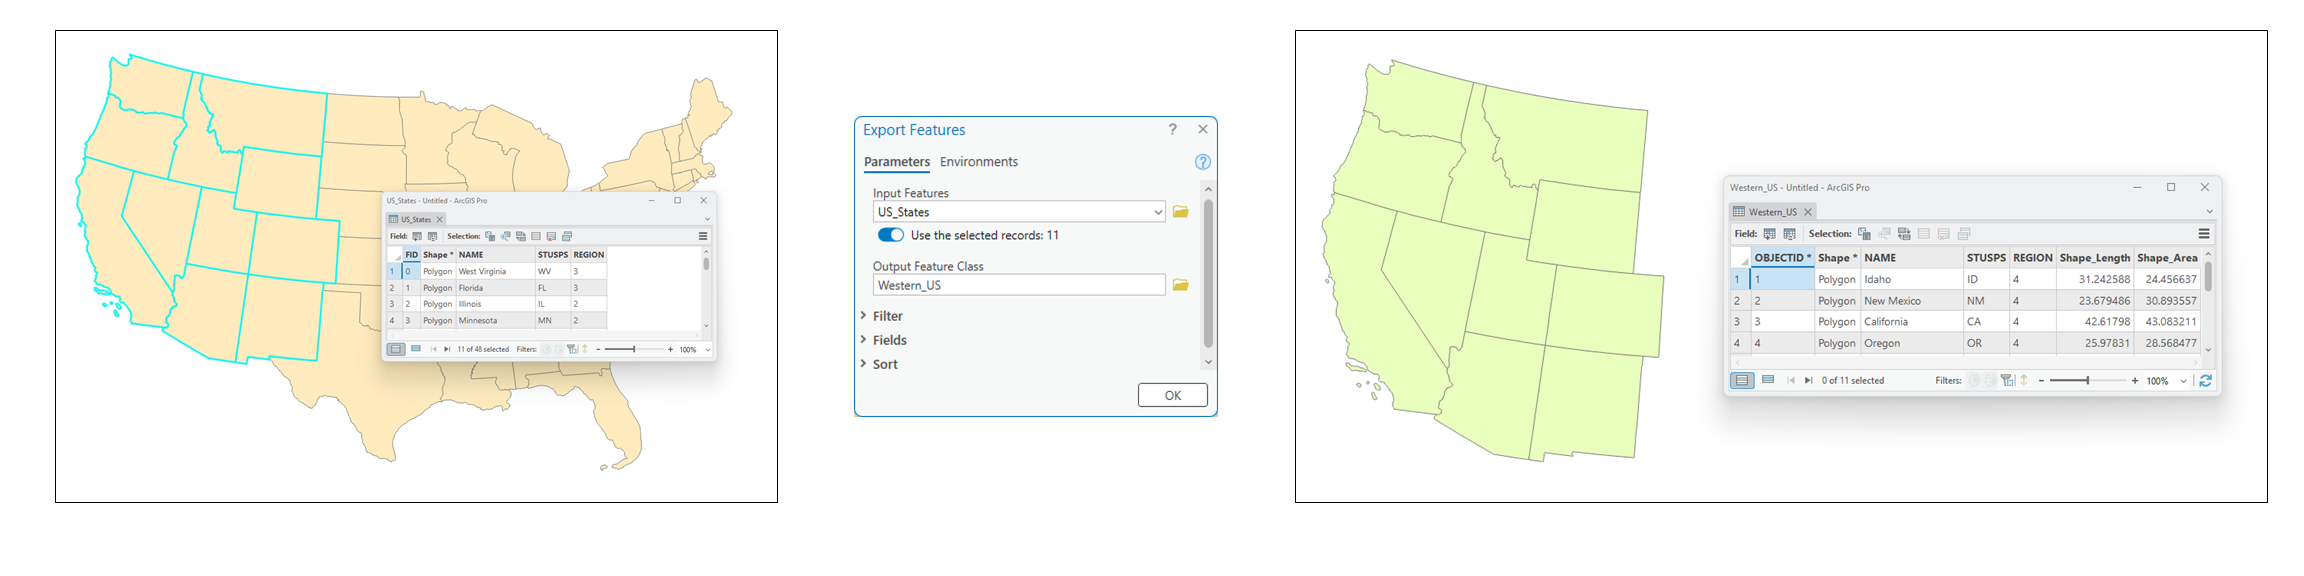 |
| The US_States layer was subset by region. The output layer has only eleven features (vs the 48 of the input layer), all of which fall into the Western US subregion. |
Limit the Input Features for a Geoprocessing Tool
Most geoprocessing tools recognize a selection made within the input layer. If you needed to buffer just the Class 1 rivers within the shapefile One of the two main types of vector data in any sort of digital science or art, is simply denoting a type of graphical representation using straight lines to construct the outlines of objects we learn in this class (there are more than two vector data in any sort of digital science or art, is simply denoting a type of graphical representation using straight lines to construct the outlines of objects types in GIS). Shapefiles are each only one geometry type, either a point, a polyline, or a polygon. Shapefiles are stored in folders and most often do not have relationships with other data. "rivers_of_colorado.shp", you can do one of two things, both of which start with making a selection where CLASS = 1. From there, you could then either export that subset as a new shapefile One of the two main types of vector data in any sort of digital science or art, is simply denoting a type of graphical representation using straight lines to construct the outlines of objects we learn in this class (there are more than two vector data in any sort of digital science or art, is simply denoting a type of graphical representation using straight lines to construct the outlines of objects types in GIS). Shapefiles are each only one geometry type, either a point, a polyline, or a polygon. Shapefiles are stored in folders and most often do not have relationships with other data. (eg. "colorado_class1_rivers.shp") and buffer all the features in the new subset shapefile One of the two main types of vector data in any sort of digital science or art, is simply denoting a type of graphical representation using straight lines to construct the outlines of objects we learn in this class (there are more than two vector data in any sort of digital science or art, is simply denoting a type of graphical representation using straight lines to construct the outlines of objects types in GIS). Shapefiles are each only one geometry type, either a point, a polyline, or a polygon. Shapefiles are stored in folders and most often do not have relationships with other data. or use the active selection within the Rivers of Colorado shapefile One of the two main types of vector data in any sort of digital science or art, is simply denoting a type of graphical representation using straight lines to construct the outlines of objects we learn in this class (there are more than two vector data in any sort of digital science or art, is simply denoting a type of graphical representation using straight lines to construct the outlines of objects types in GIS). Shapefiles are each only one geometry type, either a point, a polyline, or a polygon. Shapefiles are stored in folders and most often do not have relationships with other data. as the input to the Buffer geoprocessing tool. Either method means the tool will run on a subset of data, the difference being is method one leads to an additional shapefile One of the two main types of vector data in any sort of digital science or art, is simply denoting a type of graphical representation using straight lines to construct the outlines of objects we learn in this class (there are more than two vector data in any sort of digital science or art, is simply denoting a type of graphical representation using straight lines to construct the outlines of objects types in GIS). Shapefiles are each only one geometry type, either a point, a polyline, or a polygon. Shapefiles are stored in folders and most often do not have relationships with other data. being created in the process while method two preserves the count of shapefiles. Neither is the "correct" way, they are just different.
Note: Many tools include a tick box labeled “Use Selected Features,” but not all do, and some may not honor your selections. Rather than memorizing tool processes, remember this: if your selection wasn't honored, reopen the tool to check for the tick box. Alternatively, you can export your selection first, then run the tool on the newly exported layer.