 Second in our list of spatial data models is
raster data
Raster data is a type of digital data that stores information about a location using a grid of pixels or cells. All spatial rasters are raster files, but not all raster files are spatial rasters.
. Just like with the dot-to-dot analogy for the
vector data
in any sort of digital science or art, is simply denoting a type of graphical representation using straight lines to construct the outlines of objects
model, we can go back to grade school for a
raster data
Raster data is a type of digital data that stores information about a location using a grid of pixels or cells. All spatial rasters are raster files, but not all raster files are spatial rasters.
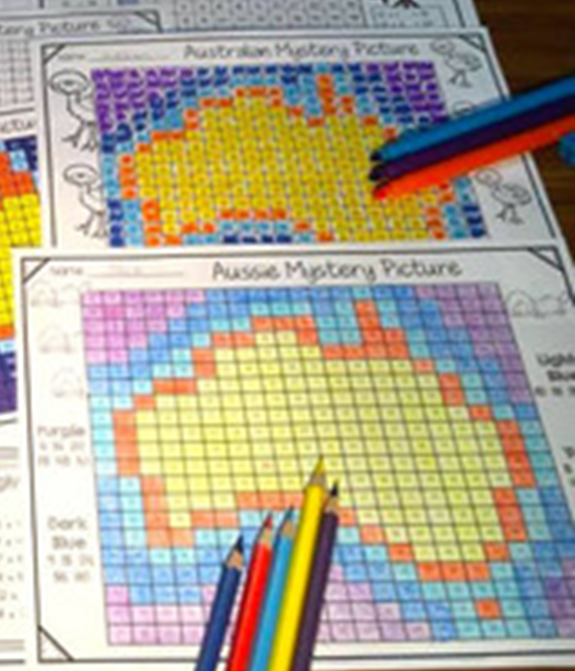
model analogy. Color-by-number pictures (assuming you are coloring in a grid and not polygon-like areas) are essentially
raster data
Raster data is a type of digital data that stores information about a location using a grid of pixels or cells. All spatial rasters are raster files, but not all raster files are spatial rasters.
. You have squares with a single value and you color the value in based on that value. Raster data isn't really any different.
Second in our list of spatial data models is
raster data
Raster data is a type of digital data that stores information about a location using a grid of pixels or cells. All spatial rasters are raster files, but not all raster files are spatial rasters.
. Just like with the dot-to-dot analogy for the
vector data
in any sort of digital science or art, is simply denoting a type of graphical representation using straight lines to construct the outlines of objects
model, we can go back to grade school for a
raster data
Raster data is a type of digital data that stores information about a location using a grid of pixels or cells. All spatial rasters are raster files, but not all raster files are spatial rasters.
model analogy. Color-by-number pictures (assuming you are coloring in a grid and not polygon-like areas) are essentially
raster data
Raster data is a type of digital data that stores information about a location using a grid of pixels or cells. All spatial rasters are raster files, but not all raster files are spatial rasters.
. You have squares with a single value and you color the value in based on that value. Raster data isn't really any different.
Raster data is any pixel-based picture data (JPG, PNG, TIFF for example) which is loaded into the software. Both a picture of your cat Mogwai and a Digital Elevation Model ( DEM Digital Elevation Model ) are seen as raster data Raster data is a type of digital data that stores information about a location using a grid of pixels or cells. All spatial rasters are raster files, but not all raster files are spatial rasters. by the software, the only difference being that the spatial raster Spatial raster data is a type of digital data that stores information about a location using a grid of pixels or cells AND has stored coordinate information based on any given geographic or projected coordinate system. - the DEM Digital Elevation Model , has coordinate system information attached, allowing the GIS Geographic Information Systems the software used to create, store, and manage spatial data, analyze spatial problems, and display the data in cartographic layouts Geographic Information Sciences to know where in the world to "put" when it's displayed on screen. You can, in fact, add a picture of your cat to the GIS Geographic Information Systems the software used to create, store, and manage spatial data, analyze spatial problems, and display the data in cartographic layouts Geographic Information Sciences , the GIS Geographic Information Systems the software used to create, store, and manage spatial data, analyze spatial problems, and display the data in cartographic layouts Geographic Information Sciences simply won't know where it should draw the raster data Raster data is a type of digital data that stores information about a location using a grid of pixels or cells. All spatial rasters are raster files, but not all raster files are spatial rasters. . While a picture of your cat is indeed raster data Raster data is a type of digital data that stores information about a location using a grid of pixels or cells. All spatial rasters are raster files, but not all raster files are spatial rasters. , it's not a spatial raster Spatial raster data is a type of digital data that stores information about a location using a grid of pixels or cells AND has stored coordinate information based on any given geographic or projected coordinate system. .
All digital images ( raster data Raster data is a type of digital data that stores information about a location using a grid of pixels or cells. All spatial rasters are raster files, but not all raster files are spatial rasters. ) are comprised of a series of pixels (short for picture elements) arranged in in rows and columns to create a grid pattern. You may have seen the pixels of an image before when you try to post an picture to your social media account that was once a small sized picture and you’re trying to make it display full page. We would describe the image as pixelated, or the fact that the image pixels have become so large, that the only thing you can see is the pixel makeup of the image and not the image itself. Kind of like the cliché "you can't see the forest because of the trees", meaning that you cannot see the entire forest if you are so close, you can only see the trees.
| Figure 3.6: A Pixelated Version of the Mona Lisa |
|---|
| In this image, we can see all the pixels a digital version of the Mona Lisa is made up of. Notice the pixels are all squares in a grid pattern. |
The properties of raster data Raster data is a type of digital data that stores information about a location using a grid of pixels or cells. All spatial rasters are raster files, but not all raster files are spatial rasters. is what makes the unique compared to vector data in any sort of digital science or art, is simply denoting a type of graphical representation using straight lines to construct the outlines of objects . We learned that vector data in any sort of digital science or art, is simply denoting a type of graphical representation using straight lines to construct the outlines of objects is data is just a graphical representation of objects using vertices connected by straight lines to outline an area (polygons), mark the location of a single instance (points), or trace along linear objects (polylines). Because we can place a vertex pl. vertices One of a set of ordered x,y coordinate pairs that defines the shape of a line or polygon feature. really anywhere we want in the software, there are no "rules" about vector data in any sort of digital science or art, is simply denoting a type of graphical representation using straight lines to construct the outlines of objects beyond the vertex pl. vertices One of a set of ordered x,y coordinate pairs that defines the shape of a line or polygon feature. minimums to create points, polylines, or polygons. Vertices can be placed very close together or very far apart. They can be moved and deleted freely, and new vertices can be added to any vector feature (a single object stored in the larger shapefile One of the two main types of vector data in any sort of digital science or art, is simply denoting a type of graphical representation using straight lines to construct the outlines of objects we learn in this class (there are more than two vector data in any sort of digital science or art, is simply denoting a type of graphical representation using straight lines to construct the outlines of objects types in GIS). Shapefiles are each only one geometry type, either a point, a polyline, or a polygon. Shapefiles are stored in folders and most often do not have relationships with other data. or feature class One of the two main types of vector data in any sort of digital science or art, is simply denoting a type of graphical representation using straight lines to construct the outlines of objects we learn in this class (there are more than two vector data in any sort of digital science or art, is simply denoting a type of graphical representation using straight lines to construct the outlines of objects types in GIS). Feature classes are each only one geometry type, either a point A GIS vector data in any sort of digital science or art, is simply denoting a type of graphical representation using straight lines to construct the outlines of objects geometry type which is made up of just one vertex pl. vertices One of a set of ordered x,y coordinate pairs that defines the shape of a line or polygon feature. , marking a single XY location in any given geographic or projected coordinate system. , a polyline A GIS vector data in any sort of digital science or art, is simply denoting a type of graphical representation using straight lines to construct the outlines of objects geometry type which is made up of two or more vertices connected by straight lines. Often used to represent objects such as roads, river, and boundaries. , or a polygon. Feature classes are stored in geodatabases and are most often used when data relationships are important. , ie. the State of Colorado would be a single feature within a US_States feature class One of the two main types of vector data in any sort of digital science or art, is simply denoting a type of graphical representation using straight lines to construct the outlines of objects we learn in this class (there are more than two vector data in any sort of digital science or art, is simply denoting a type of graphical representation using straight lines to construct the outlines of objects types in GIS). Feature classes are each only one geometry type, either a point A GIS vector data in any sort of digital science or art, is simply denoting a type of graphical representation using straight lines to construct the outlines of objects geometry type which is made up of just one vertex pl. vertices One of a set of ordered x,y coordinate pairs that defines the shape of a line or polygon feature. , marking a single XY location in any given geographic or projected coordinate system. , a polyline A GIS vector data in any sort of digital science or art, is simply denoting a type of graphical representation using straight lines to construct the outlines of objects geometry type which is made up of two or more vertices connected by straight lines. Often used to represent objects such as roads, river, and boundaries. , or a polygon. Feature classes are stored in geodatabases and are most often used when data relationships are important. or shapefile One of the two main types of vector data in any sort of digital science or art, is simply denoting a type of graphical representation using straight lines to construct the outlines of objects we learn in this class (there are more than two vector data in any sort of digital science or art, is simply denoting a type of graphical representation using straight lines to construct the outlines of objects types in GIS). Shapefiles are each only one geometry type, either a point, a polyline, or a polygon. Shapefiles are stored in folders and most often do not have relationships with other data. ) at any interval at any time. Rasters, however, have very strict rules. Each pixel is a defined size, both in height and width, and because each pixel is a square and all the rows and columns are coincident (have a shared boundary), by default, the center-to-center measurement, that is from the center of one pixel to the center of his direct neighbor (in straight lines, not diagonal), will be equal. You cannot delete pixels, but you can hide them from view by either setting them to a transparent color or assigning the pixel a special value of NODATA. You can cut out smaller rasters from larger ones, or create a subset raster, or you can join two or more rasters together to create a larger raster in a process called mosaicking, but that is pretty much it. We can run geoprocessing tools on rasters, creating new rasters by examining the properties of the non-spatial data Attributes related to a location but not describing its physical placement in space, such as information about a tree's age, type, and health. , but even that process doesn't destroy or modify the original raster pixels.
| Figure 3.7: Raster Properties |
|---|
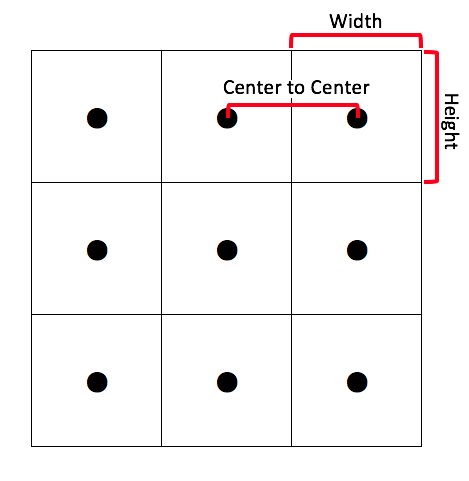 |
| All rasters are a series of pixels arranged in rows and columns, each with an equal height, width, and center-to-center value. |
The beauty of these strict raster rules is the fact that assumptions can be made about spatial rasters that cannot be made about vectors. Since each pixel is a perfect square, we can measure the distance on the Earth's surface that is covered by that raster, basically using the edge of a raster pixel as a ruler. This is called the raster's spatial resolution Spatial resolution refers to the level of detail or granularity in an image or a spatial dataset. , and it's one of several assumptions we can make. When we see an image of an area in a 30 meter spatial resolution Spatial resolution refers to the level of detail or granularity in an image or a spatial dataset. raster or a 30-meter raster, we know - for a fact - that the side of each pixel covers exactly 30 meters on the ground. Since the distance one pixel covers is a known value, we can measure distances and use geoprocessing tools to infer distribution and relationship properties of that raster compared to the coordinate system the data is stored in; compared to other rasters; or compared to vector data in any sort of digital science or art, is simply denoting a type of graphical representation using straight lines to construct the outlines of objects .
All rasters, whether they are spatial rasters or pictures of your pets, have numbers - and only numbers - associated with each pixel, called the digital number The numeric value stored with a single pixel in raster data Raster data is a type of digital data that stores information about a location using a grid of pixels or cells. All spatial rasters are raster files, but not all raster files are spatial rasters. (see glossary for more). (sometimes abbreviated as the 'dn'). Looking back at our color-by-number analogy, the digital number The numeric value stored with a single pixel in raster data Raster data is a type of digital data that stores information about a location using a grid of pixels or cells. All spatial rasters are raster files, but not all raster files are spatial rasters. (see glossary for more). is the number in the box. These numbers can represent the red, green, and blue values in the case of a color picture, or they can represent information, such as elevation the vertical distance between local mean sea level the measurement above or below the global average at a single point A GIS vector data in any sort of digital science or art, is simply denoting a type of graphical representation using straight lines to construct the outlines of objects geometry type which is made up of just one vertex pl. vertices One of a set of ordered x,y coordinate pairs that defines the shape of a line or polygon feature. , marking a single XY location in any given geographic or projected coordinate system. on the Earth's surface used for recording the elevation of topographic surface a detailed map of the surface features of land. It includes the mountains, hills, creeks, and other bumps and lumps on a particular hunk of earth. The word is a Greek-rooted combo of topos meaning "place" and graphein "to write." 's relief the difference between the highest and lowest point within a particular area while landforms are the descriptive words for individual features and a single point A GIS vector data in any sort of digital science or art, is simply denoting a type of graphical representation using straight lines to construct the outlines of objects geometry type which is made up of just one vertex pl. vertices One of a set of ordered x,y coordinate pairs that defines the shape of a line or polygon feature. , marking a single XY location in any given geographic or projected coordinate system. on the Earth's surface in the case of DEM Digital Elevation Model 's. The numbers within one raster can be either decimal numbers, or what we would call a float raster (float just being "coding language" for decimal) or whole numbers, called an integer raster. No raster has a combination of float and integer numbers for that is simply not allowed. If you see whole numbers represented in a float raster, they simply don't have an digits after the decimal.
Just as important as whether a raster stores integers or floats is how much information each pixel can store, which is determined by the raster's pixel depth The range of possible values that can be assigned to a pixel in a raster, measured in bits (e.g., 8-bit, 16-bit, 32-bit). Also called bit depth or pixel type See pixel depth . (also called bit depth See pixel depth The range of possible values that can be assigned to a pixel in a raster, measured in bits (e.g., 8-bit, 16-bit, 32-bit). Also called bit depth or pixel type See pixel depth . or pixel type See pixel depth ). Pixel depth defines the range of possible values that can be assigned to a pixel, and it's measured in bits. An unsigned 8-bit raster can store values from 0 to 255 (that's 256 possible values), which works great for storing things like simple classifications (more on classification rasters coming up), while a signed 8-bit raster can store values between -128 and +127 (still 256 possible values). A 16-bit raster expands that range dramatically to 0 to 65,535 values, making it useful for more detailed measurements like elevation the vertical distance between local mean sea level the measurement above or below the global average at a single point A GIS vector data in any sort of digital science or art, is simply denoting a type of graphical representation using straight lines to construct the outlines of objects geometry type which is made up of just one vertex pl. vertices One of a set of ordered x,y coordinate pairs that defines the shape of a line or polygon feature. , marking a single XY location in any given geographic or projected coordinate system. on the Earth's surface used for recording the elevation of topographic surface a detailed map of the surface features of land. It includes the mountains, hills, creeks, and other bumps and lumps on a particular hunk of earth. The word is a Greek-rooted combo of topos meaning "place" and graphein "to write." 's relief the difference between the highest and lowest point within a particular area while landforms are the descriptive words for individual features and a single point A GIS vector data in any sort of digital science or art, is simply denoting a type of graphical representation using straight lines to construct the outlines of objects geometry type which is made up of just one vertex pl. vertices One of a set of ordered x,y coordinate pairs that defines the shape of a line or polygon feature. , marking a single XY location in any given geographic or projected coordinate system. on the Earth's surface data and satellite imagery where you need to represent a wider range of heights. And if you need even more precision, 32-bit rasters can store massive ranges of values - perfect for scientific data or calculations that need extreme accuracy. 32-bit rasters can be either integer (signed/unsigned) or float (allowing decimal values). The catch is that the deeper the pixel depth The range of possible values that can be assigned to a pixel in a raster, measured in bits (e.g., 8-bit, 16-bit, 32-bit). Also called bit depth or pixel type See pixel depth . , the larger your file size becomes, since each pixel is storing more bits of information. It's a trade-off between the precision you need and the storage space you have available.
Even though a picture of your cat is technically a raster (as raster is another word borrowed by GIS Geographic Information Systems the software used to create, store, and manage spatial data, analyze spatial problems, and display the data in cartographic layouts Geographic Information Sciences and used in many other computer-based arts and sciences), what sets spatial rasters apart from a picture of Grumpy Cat is the spatial information. In addition to having either RGB values (color rasters) or black levels (black and white rasters), like all rasters, spatial rasters have a coordinate system and coordinates associated, meaning that every pixel "knows" exactly where in the world it lives. Each corner of each pixel has a stored geographic or projected coordinate pair (just like vertices in vector data in any sort of digital science or art, is simply denoting a type of graphical representation using straight lines to construct the outlines of objects ), making the image georeferenced, or defining and storing very specific location data about the image - aka: geo = Earth and reference = reference, so referencing the Earth (a coordinate system representing the Earth).
| Properties of Rasters |
|---|
|
Concept Quiz
3.3.2: Classification Rasters
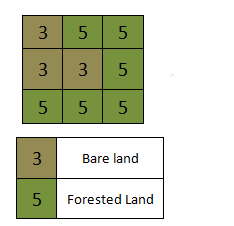
While many rasters are images, such as aerial photographs or satellite imagery, classification rasters serve a different purpose. Instead of displaying a captured image of the Earth's surface, classification rasters use integer values to represent different land cover types, such as water, vegetation, urban areas, or bare ground. These rasters create a thematic map, where each pixel The smallest unit of information in a digital image or raster map, usually square or rectangular. Often used synonymously with cell. Pixel is an abbreviation of "picture element". is assigned a category based on its dominant characteristic. The result is a color-coded representation of the landscape that simplifies complex imagery into distinct, easy-to-interpret regions.
The classification process involves categorizing pixels based on specific attributes. GIS Geographic Information Systems the software used to create, store, and manage spatial data Data that deals with location, such as lists of addresses, the footprint of a building, the boundaries of cities and counties, etc. , analyze spatial problems, and display the data in cartographic layouts Geographic Information Sciences software evaluates the pixel The smallest unit of information in a digital image or raster map, usually square or rectangular. Often used synonymously with cell. Pixel is an abbreviation of "picture element". ’s characteristics—such as reflectance values in remote sensing data—and assigns it to a predefined class, like "forest," "urban," or "water." However, because each raster cell covers an area of land (sometimes several meters or more), it is possible for a single pixel The smallest unit of information in a digital image or raster map, usually square or rectangular. Often used synonymously with cell. Pixel is an abbreviation of "picture element". to contain multiple land cover types. When this happens, the software must determine which category best represents the cell, a process known as pixel The smallest unit of information in a digital image or raster map, usually square or rectangular. Often used synonymously with cell. Pixel is an abbreviation of "picture element". classification. One common approach is the majority rule, where the class occupying the greatest percentage of the cell is assigned to that pixel The smallest unit of information in a digital image or raster map, usually square or rectangular. Often used synonymously with cell. Pixel is an abbreviation of "picture element". . For example, if a pixel The smallest unit of information in a digital image or raster map, usually square or rectangular. Often used synonymously with cell. Pixel is an abbreviation of "picture element". is 50% or more water, it will be classified as "water," even if other land types are present.
Unlike vector data in any sort of digital science or art, is simply denoting a type of graphical representation using straight lines to construct the outlines of objects , which represents features using points, lines, and polygons with precise boundaries, raster data Raster data is a type of digital data that stores information about a location using a grid of pixels or cells. All spatial rasters are raster files, but not all raster files are spatial rasters. models the world as a continuous grid. This makes classification rasters particularly useful for land cover mapping, environmental monitoring, and suitability analysis, where broad patterns and distributions are more important than exact feature boundaries. While GIS Geographic Information Systems the software used to create, store, and manage spatial data Data that deals with location, such as lists of addresses, the footprint of a building, the boundaries of cities and counties, etc. , analyze spatial problems, and display the data in cartographic layouts Geographic Information Sciences 1040 primarily focuses on vector data in any sort of digital science or art, is simply denoting a type of graphical representation using straight lines to construct the outlines of objects , understanding the properties of raster data Raster data is a type of digital data that stores information about a location using a grid of pixels or cells. All spatial rasters are raster files, but not all raster files are spatial rasters. is essential for future applications, as many spatial analyses involve both raster and vector datasets working together.
| Figure 3.8: The Classification of Raster Images | |||
|---|---|---|---|
 | 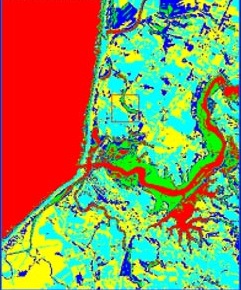 |  |  |
| Satellite Image of a Coastline | Classification Result | Close-up of Classification Result | Raster Values Exposed |
3.3.3: Recognizing Raster Data in ArcGIS Pro
In the vector section of the reading, we noted that when we look at spatial data Data that deals with location, such as lists of addresses, the footprint of a building, the boundaries of cities and counties, etc. in the GIS Geographic Information Systems the software used to create, store, and manage spatial data Data that deals with location, such as lists of addresses, the footprint of a building, the boundaries of cities and counties, etc. , analyze spatial problems, and display the data in cartographic layouts Geographic Information Sciences , the file icons associated with each vector file are a key to recognizing what the geometry type is (based on the decoration of the icon) and if the file is a shapefile One of the two main types of vector data in any sort of digital science or art, is simply denoting a type of graphical representation using straight lines to construct the outlines of objects we learn in this class (there are more than two vector data in any sort of digital science or art, is simply denoting a type of graphical representation using straight lines to construct the outlines of objects types in GIS). Shapefiles are each only one geometry type, either a point, a polyline, or a polygon. Shapefiles are stored in folders and most often do not have relationships with other data. or a feature class One of the two main types of vector data in any sort of digital science or art, is simply denoting a type of graphical representation using straight lines to construct the outlines of objects we learn in this class (there are more than two vector data in any sort of digital science or art, is simply denoting a type of graphical representation using straight lines to construct the outlines of objects types in GIS). Feature classes are each only one geometry type, either a point A GIS vector data in any sort of digital science or art, is simply denoting a type of graphical representation using straight lines to construct the outlines of objects geometry type which is made up of just one vertex pl. vertices One of a set of ordered x,y coordinate pairs that defines the shape of a line or polygon feature. , marking a single XY location in any given geographic or projected coordinate system. , a polyline A GIS vector data in any sort of digital science or art, is simply denoting a type of graphical representation using straight lines to construct the outlines of objects geometry type which is made up of two or more vertices connected by straight lines. Often used to represent objects such as roads, river, and boundaries. , or a polygon. Feature classes are stored in geodatabases and are most often used when data relationships are important. (green vs blue). Raster data is no different, the software provides us with file icons to recognize if a file is a raster file and where the raster is stored.
For both rasters stored inside a geodatabase electronic storage container specifically used to store geographic/ spatial data Data that deals with location, such as lists of addresses, the footprint of a building, the boundaries of cities and counties, etc. with a top-down structure in which the items contained are related to each other and that relationship allows for the data to be quickly and efficiently queried and retrieved for use. and those stored inside a folder, the icon is the same - a small grid with twelve "pixels". Just a small representation of the basic raster structure. Remember, all of these file icons can be looked up in the File Icon page on the wiki (link button in the top toolbar).
| Figure 3.9: Raster Icons in ArcGIS Software | |
|---|---|
| Rasters stored in a geodatabase electronic storage container specifically used to store geographic/ spatial data Data that deals with location, such as lists of addresses, the footprint of a building, the boundaries of cities and counties, etc. with a top-down structure in which the items contained are related to each other and that relationship allows for the data to be quickly and efficiently queried and retrieved for use. have a blue raster structure looking icon. | Raster images stored inside folders have a yellow file icon, with the same icon structure as the geodatabases raster icon. |
3.3.4: Spatial Raster Types
Spatial raster datasets serve a variety of purposes in GIS Geographic Information Systems the software used to create, store, and manage spatial data Data that deals with location, such as lists of addresses, the footprint of a building, the boundaries of cities and counties, etc. , analyze spatial problems, and display the data in cartographic layouts Geographic Information Sciences analysis, with different raster types representing distinct physical or thematic attributes of the Earth's surface. Classification rasters, such as land cover and land use maps, categorize areas into specific types based on dominant characteristics, while continuous rasters, such as digital elevation the vertical distance between local mean sea level the measurement above or below the global average at a single point A GIS vector data in any sort of digital science or art, is simply denoting a type of graphical representation using straight lines to construct the outlines of objects geometry type which is made up of just one vertex pl. vertices One of a set of ordered x,y coordinate pairs that defines the shape of a line or polygon feature. , marking a single XY location in any given geographic or projected coordinate system. on the Earth's surface used for recording the elevation of topographic surface a detailed map of the surface features of land. It includes the mountains, hills, creeks, and other bumps and lumps on a particular hunk of earth. The word is a Greek-rooted combo of topos meaning "place" and graphein "to write." 's relief the difference between the highest and lowest point within a particular area while landforms are the descriptive words for individual features and a single point A GIS vector data in any sort of digital science or art, is simply denoting a type of graphical representation using straight lines to construct the outlines of objects geometry type which is made up of just one vertex pl. vertices One of a set of ordered x,y coordinate pairs that defines the shape of a line or polygon feature. , marking a single XY location in any given geographic or projected coordinate system. on the Earth's surface models (DEMs), represent gradually changing surfaces like elevation the vertical distance between local mean sea level the measurement above or below the global average at a single point A GIS vector data in any sort of digital science or art, is simply denoting a type of graphical representation using straight lines to construct the outlines of objects geometry type which is made up of just one vertex pl. vertices One of a set of ordered x,y coordinate pairs that defines the shape of a line or polygon feature. , marking a single XY location in any given geographic or projected coordinate system. on the Earth's surface used for recording the elevation of topographic surface a detailed map of the surface features of land. It includes the mountains, hills, creeks, and other bumps and lumps on a particular hunk of earth. The word is a Greek-rooted combo of topos meaning "place" and graphein "to write." 's relief the difference between the highest and lowest point within a particular area while landforms are the descriptive words for individual features and a single point A GIS vector data in any sort of digital science or art, is simply denoting a type of graphical representation using straight lines to construct the outlines of objects geometry type which is made up of just one vertex pl. vertices One of a set of ordered x,y coordinate pairs that defines the shape of a line or polygon feature. , marking a single XY location in any given geographic or projected coordinate system. on the Earth's surface or temperature.
Many classification rasters have well-defined names based on the type of information they encode, including:
- Land Use Rasters – Represent what an area is used for, such as urban development, agriculture, or conservation.
- Land Cover Rasters – Indicate the physical materials present, such as forests, grasslands, snow, or water.
- Slope Rasters – Measure the steepness of terrain.
- Aspect Rasters – Indicate which direction a slope A numeric value - either in percent or degree - expressing the steepness or the rise/run of the landscape. faces.
- Hillshade Rasters – Simulate how terrain would appear under a light source, enhancing 3D visualization.
These specialized rasters allow GIS Geographic Information Systems the software used to create, store, and manage spatial data Data that deals with location, such as lists of addresses, the footprint of a building, the boundaries of cities and counties, etc. , analyze spatial problems, and display the data in cartographic layouts Geographic Information Sciences users to analyze landscapes, model environmental conditions, and make informed decisions about land management, hazards, and resource allocation.
Digital Elevation Model ( DEM Digital Elevation Model ) Rasters
A Digital Elevation Model ( DEM Digital Elevation Model ) is a special type of continuous raster that represents elevation the vertical distance between local mean sea level the measurement above or below the global average at a single point A GIS vector data in any sort of digital science or art, is simply denoting a type of graphical representation using straight lines to construct the outlines of objects geometry type which is made up of just one vertex pl. vertices One of a set of ordered x,y coordinate pairs that defines the shape of a line or polygon feature. , marking a single XY location in any given geographic or projected coordinate system. on the Earth's surface used for recording the elevation of topographic surface a detailed map of the surface features of land. It includes the mountains, hills, creeks, and other bumps and lumps on a particular hunk of earth. The word is a Greek-rooted combo of topos meaning "place" and graphein "to write." 's relief the difference between the highest and lowest point within a particular area while landforms are the descriptive words for individual features and a single point A GIS vector data in any sort of digital science or art, is simply denoting a type of graphical representation using straight lines to construct the outlines of objects geometry type which is made up of just one vertex pl. vertices One of a set of ordered x,y coordinate pairs that defines the shape of a line or polygon feature. , marking a single XY location in any given geographic or projected coordinate system. on the Earth's surface values across a landscape. Unlike classification rasters that assign discrete categories to pixels, DEMs store measured elevation the vertical distance between local mean sea level the measurement above or below the global average at a single point A GIS vector data in any sort of digital science or art, is simply denoting a type of graphical representation using straight lines to construct the outlines of objects geometry type which is made up of just one vertex pl. vertices One of a set of ordered x,y coordinate pairs that defines the shape of a line or polygon feature. , marking a single XY location in any given geographic or projected coordinate system. on the Earth's surface used for recording the elevation of topographic surface a detailed map of the surface features of land. It includes the mountains, hills, creeks, and other bumps and lumps on a particular hunk of earth. The word is a Greek-rooted combo of topos meaning "place" and graphein "to write." 's relief the difference between the highest and lowest point within a particular area while landforms are the descriptive words for individual features and a single point A GIS vector data in any sort of digital science or art, is simply denoting a type of graphical representation using straight lines to construct the outlines of objects geometry type which is made up of just one vertex pl. vertices One of a set of ordered x,y coordinate pairs that defines the shape of a line or polygon feature. , marking a single XY location in any given geographic or projected coordinate system. on the Earth's surface values, making them useful for terrain analysis. Each pixel The smallest unit of information in a digital image or raster map, usually square or rectangular. Often used synonymously with cell. Pixel is an abbreviation of "picture element". in a DEM Digital Elevation Model represents the average elevation the vertical distance between local mean sea level the measurement above or below the global average at a single point A GIS vector data in any sort of digital science or art, is simply denoting a type of graphical representation using straight lines to construct the outlines of objects geometry type which is made up of just one vertex pl. vertices One of a set of ordered x,y coordinate pairs that defines the shape of a line or polygon feature. , marking a single XY location in any given geographic or projected coordinate system. on the Earth's surface used for recording the elevation of topographic surface a detailed map of the surface features of land. It includes the mountains, hills, creeks, and other bumps and lumps on a particular hunk of earth. The word is a Greek-rooted combo of topos meaning "place" and graphein "to write." 's relief the difference between the highest and lowest point within a particular area while landforms are the descriptive words for individual features and a single point A GIS vector data in any sort of digital science or art, is simply denoting a type of graphical representation using straight lines to construct the outlines of objects geometry type which is made up of just one vertex pl. vertices One of a set of ordered x,y coordinate pairs that defines the shape of a line or polygon feature. , marking a single XY location in any given geographic or projected coordinate system. on the Earth's surface for a given area, commonly at resolutions of 1 meter, 10 meters, or 30 meters. Higher-resolution DEMs capture more detailed elevation the vertical distance between local mean sea level the measurement above or below the global average at a single point A GIS vector data in any sort of digital science or art, is simply denoting a type of graphical representation using straight lines to construct the outlines of objects geometry type which is made up of just one vertex pl. vertices One of a set of ordered x,y coordinate pairs that defines the shape of a line or polygon feature. , marking a single XY location in any given geographic or projected coordinate system. on the Earth's surface used for recording the elevation of topographic surface a detailed map of the surface features of land. It includes the mountains, hills, creeks, and other bumps and lumps on a particular hunk of earth. The word is a Greek-rooted combo of topos meaning "place" and graphein "to write." 's relief the difference between the highest and lowest point within a particular area while landforms are the descriptive words for individual features and a single point A GIS vector data in any sort of digital science or art, is simply denoting a type of graphical representation using straight lines to construct the outlines of objects geometry type which is made up of just one vertex pl. vertices One of a set of ordered x,y coordinate pairs that defines the shape of a line or polygon feature. , marking a single XY location in any given geographic or projected coordinate system. on the Earth's surface variations, but they also require more storage and processing power.
DEMs serve as the foundation for a variety of derivative products, including slope A numeric value - either in percent or degree - expressing the steepness or the rise/run of the landscape. , aspect [geographic coordinate systems] The direction the developable surface a geometric shape which will not be distorted when flattened. Used as the base shape to transfer features during projections. Most often a cone, cylinder, or plane (azimuthal) faces in relation to the geographic coordinate system. Normal; transverse, oblique[topography] The cardinal direction a slope A numeric value - either in percent or degree - expressing the steepness or the rise/run of the landscape. faces (NSEW) , and contour maps. ArcGIS can process DEMs of all spatial resolutions, adjusting output accuracy based on input quality. For most GIS Geographic Information Systems the software used to create, store, and manage spatial data Data that deals with location, such as lists of addresses, the footprint of a building, the boundaries of cities and counties, etc. , analyze spatial problems, and display the data in cartographic layouts Geographic Information Sciences applications, 30-meter DEM Digital Elevation Model data is sufficient for regional terrain analysis, while higher-resolution DEMs (such as 1-meter lidar-derived models) are used for detailed local studies.
| Figure 3.10: A Digital Elevation Model ( DEM Digital Elevation Model ) |
|---|
 |
| A digital elevation the vertical distance between local mean sea level the measurement above or below the global average at a single point A GIS vector data in any sort of digital science or art, is simply denoting a type of graphical representation using straight lines to construct the outlines of objects geometry type which is made up of just one vertex pl. vertices One of a set of ordered x,y coordinate pairs that defines the shape of a line or polygon feature. , marking a single XY location in any given geographic or projected coordinate system. on the Earth's surface used for recording the elevation of topographic surface a detailed map of the surface features of land. It includes the mountains, hills, creeks, and other bumps and lumps on a particular hunk of earth. The word is a Greek-rooted combo of topos meaning "place" and graphein "to write." 's relief the difference between the highest and lowest point within a particular area while landforms are the descriptive words for individual features and a single point A GIS vector data in any sort of digital science or art, is simply denoting a type of graphical representation using straight lines to construct the outlines of objects geometry type which is made up of just one vertex pl. vertices One of a set of ordered x,y coordinate pairs that defines the shape of a line or polygon feature. , marking a single XY location in any given geographic or projected coordinate system. on the Earth's surface model is a raster which stores elevation the vertical distance between local mean sea level the measurement above or below the global average at a single point A GIS vector data in any sort of digital science or art, is simply denoting a type of graphical representation using straight lines to construct the outlines of objects geometry type which is made up of just one vertex pl. vertices One of a set of ordered x,y coordinate pairs that defines the shape of a line or polygon feature. , marking a single XY location in any given geographic or projected coordinate system. on the Earth's surface used for recording the elevation of topographic surface a detailed map of the surface features of land. It includes the mountains, hills, creeks, and other bumps and lumps on a particular hunk of earth. The word is a Greek-rooted combo of topos meaning "place" and graphein "to write." 's relief the difference between the highest and lowest point within a particular area while landforms are the descriptive words for individual features and a single point A GIS vector data in any sort of digital science or art, is simply denoting a type of graphical representation using straight lines to construct the outlines of objects geometry type which is made up of just one vertex pl. vertices One of a set of ordered x,y coordinate pairs that defines the shape of a line or polygon feature. , marking a single XY location in any given geographic or projected coordinate system. on the Earth's surface data. From elevation the vertical distance between local mean sea level the measurement above or below the global average at a single point A GIS vector data in any sort of digital science or art, is simply denoting a type of graphical representation using straight lines to construct the outlines of objects geometry type which is made up of just one vertex pl. vertices One of a set of ordered x,y coordinate pairs that defines the shape of a line or polygon feature. , marking a single XY location in any given geographic or projected coordinate system. on the Earth's surface used for recording the elevation of topographic surface a detailed map of the surface features of land. It includes the mountains, hills, creeks, and other bumps and lumps on a particular hunk of earth. The word is a Greek-rooted combo of topos meaning "place" and graphein "to write." 's relief the difference between the highest and lowest point within a particular area while landforms are the descriptive words for individual features and a single point A GIS vector data in any sort of digital science or art, is simply denoting a type of graphical representation using straight lines to construct the outlines of objects geometry type which is made up of just one vertex pl. vertices One of a set of ordered x,y coordinate pairs that defines the shape of a line or polygon feature. , marking a single XY location in any given geographic or projected coordinate system. on the Earth's surface , slope A numeric value - either in percent or degree - expressing the steepness or the rise/run of the landscape. , aspect [geographic coordinate systems] The direction the developable surface a geometric shape which will not be distorted when flattened. Used as the base shape to transfer features during projections. Most often a cone, cylinder, or plane (azimuthal) faces in relation to the geographic coordinate system. Normal; transverse, oblique[topography] The cardinal direction a slope A numeric value - either in percent or degree - expressing the steepness or the rise/run of the landscape. faces (NSEW) , and contour lines can all be derived mathematically. |
Hillshades and Shaded Reliefs Rasters
One of the most visually useful transformations of a DEM Digital Elevation Model is a hillshade or shaded relief the difference between the highest and lowest point within a particular area while landforms are the descriptive words for individual features raster. These layers simulate how terrain would appear under a hypothetical light source, shading areas facing away from the sun and highlighting areas that receive direct light. Hillshades are commonly used as basemaps A foundational layer on a map that is the basis of GIS visual and geographic context. to enhance the 3D appearance of other layers, such as roads, rivers, and land cover classifications.
- Hillshade Rasters use grayscale shading to simulate terrain relief the difference between the highest and lowest point within a particular area while landforms are the descriptive words for individual features .
- Shaded Relief Rasters apply color gradients (reds, greens, and yellows) to improve readability and depth perception.
Although hillshades and shaded reliefs do not contain analytical data themselves, they help GIS Geographic Information Systems the software used to create, store, and manage spatial data Data that deals with location, such as lists of addresses, the footprint of a building, the boundaries of cities and counties, etc. , analyze spatial problems, and display the data in cartographic layouts Geographic Information Sciences users interpret elevation the vertical distance between local mean sea level the measurement above or below the global average at a single point A GIS vector data in any sort of digital science or art, is simply denoting a type of graphical representation using straight lines to construct the outlines of objects geometry type which is made up of just one vertex pl. vertices One of a set of ordered x,y coordinate pairs that defines the shape of a line or polygon feature. , marking a single XY location in any given geographic or projected coordinate system. on the Earth's surface used for recording the elevation of topographic surface a detailed map of the surface features of land. It includes the mountains, hills, creeks, and other bumps and lumps on a particular hunk of earth. The word is a Greek-rooted combo of topos meaning "place" and graphein "to write." 's relief the difference between the highest and lowest point within a particular area while landforms are the descriptive words for individual features and a single point A GIS vector data in any sort of digital science or art, is simply denoting a type of graphical representation using straight lines to construct the outlines of objects geometry type which is made up of just one vertex pl. vertices One of a set of ordered x,y coordinate pairs that defines the shape of a line or polygon feature. , marking a single XY location in any given geographic or projected coordinate system. on the Earth's surface changes visually, making them valuable for cartographic presentation.
| Figure 3.11: Hillshade and Shaded Reliefs | |
|---|---|
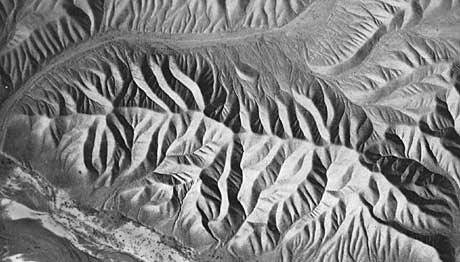 | 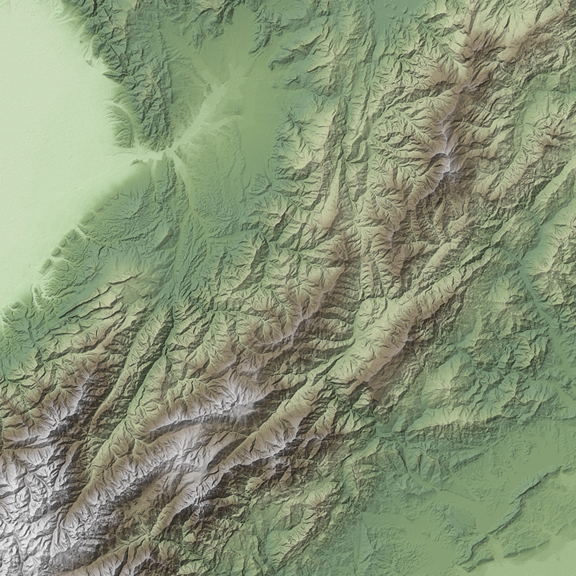 |
| Hillshades express the relief the difference between the highest and lowest point within a particular area while landforms are the descriptive words for individual features of the topographic surface a detailed map of the surface features of land. It includes the mountains, hills, creeks, and other bumps and lumps on a particular hunk of earth. The word is a Greek-rooted combo of topos meaning "place" and graphein "to write." in a 2D image which has a 3D appearance using shades of gray. | Shaded reliefs express the same relief the difference between the highest and lowest point within a particular area while landforms are the descriptive words for individual features using color. |
Slope and Aspect Rasters
Two additional derivative products from DEMs are slope A numeric value - either in percent or degree - expressing the steepness or the rise/run of the landscape. and aspect [geographic coordinate systems] The direction the developable surface a geometric shape which will not be distorted when flattened. Used as the base shape to transfer features during projections. Most often a cone, cylinder, or plane (azimuthal) faces in relation to the geographic coordinate system. Normal; transverse, oblique[topography] The cardinal direction a slope A numeric value - either in percent or degree - expressing the steepness or the rise/run of the landscape. faces (NSEW) rasters, both of which are critical for terrain analysis, watershed modeling, and environmental assessments.
- Slope Rasters measure the rate of elevation the vertical distance between local mean sea level the measurement above or below the global average at a single point A GIS vector data in any sort of digital science or art, is simply denoting a type of graphical representation using straight lines to construct the outlines of objects geometry type which is made up of just one vertex pl. vertices One of a set of ordered x,y coordinate pairs that defines the shape of a line or polygon feature. , marking a single XY location in any given geographic or projected coordinate system. on the Earth's surface used for recording the elevation of topographic surface a detailed map of the surface features of land. It includes the mountains, hills, creeks, and other bumps and lumps on a particular hunk of earth. The word is a Greek-rooted combo of topos meaning "place" and graphein "to write." 's relief the difference between the highest and lowest point within a particular area while landforms are the descriptive words for individual features and a single point A GIS vector data in any sort of digital science or art, is simply denoting a type of graphical representation using straight lines to construct the outlines of objects geometry type which is made up of just one vertex pl. vertices One of a set of ordered x,y coordinate pairs that defines the shape of a line or polygon feature. , marking a single XY location in any given geographic or projected coordinate system. on the Earth's surface change across a surface, expressed in degrees measurement of plane angle, representing 1⁄360 of a full rotation (circle). In full, a degree of arc or arc degree. Usually denoted by ° or percentages. Steep slopes are represented with higher values, while flatter areas have lower values.
- Aspect Rasters indicate the direction a slope A numeric value - either in percent or degree - expressing the steepness or the rise/run of the landscape. faces (N, NE, E, SE, S, SW, W, NW). Aspect is crucial for applications such as solar exposure analysis, erosion prediction, and vegetation distribution modeling.
GIS Geographic Information Systems the software used to create, store, and manage spatial data Data that deals with location, such as lists of addresses, the footprint of a building, the boundaries of cities and counties, etc. , analyze spatial problems, and display the data in cartographic layouts Geographic Information Sciences software calculates slope A numeric value - either in percent or degree - expressing the steepness or the rise/run of the landscape. and aspect [geographic coordinate systems] The direction the developable surface a geometric shape which will not be distorted when flattened. Used as the base shape to transfer features during projections. Most often a cone, cylinder, or plane (azimuthal) faces in relation to the geographic coordinate system. Normal; transverse, oblique[topography] The cardinal direction a slope A numeric value - either in percent or degree - expressing the steepness or the rise/run of the landscape. faces (NSEW) using neighborhood analysis, comparing a pixel The smallest unit of information in a digital image or raster map, usually square or rectangular. Often used synonymously with cell. Pixel is an abbreviation of "picture element". ’s elevation the vertical distance between local mean sea level the measurement above or below the global average at a single point A GIS vector data in any sort of digital science or art, is simply denoting a type of graphical representation using straight lines to construct the outlines of objects geometry type which is made up of just one vertex pl. vertices One of a set of ordered x,y coordinate pairs that defines the shape of a line or polygon feature. , marking a single XY location in any given geographic or projected coordinate system. on the Earth's surface used for recording the elevation of topographic surface a detailed map of the surface features of land. It includes the mountains, hills, creeks, and other bumps and lumps on a particular hunk of earth. The word is a Greek-rooted combo of topos meaning "place" and graphein "to write." 's relief the difference between the highest and lowest point within a particular area while landforms are the descriptive words for individual features and a single point A GIS vector data in any sort of digital science or art, is simply denoting a type of graphical representation using straight lines to construct the outlines of objects geometry type which is made up of just one vertex pl. vertices One of a set of ordered x,y coordinate pairs that defines the shape of a line or polygon feature. , marking a single XY location in any given geographic or projected coordinate system. on the Earth's surface to its eight neighboring pixels. If the elevation the vertical distance between local mean sea level the measurement above or below the global average at a single point A GIS vector data in any sort of digital science or art, is simply denoting a type of graphical representation using straight lines to construct the outlines of objects geometry type which is made up of just one vertex pl. vertices One of a set of ordered x,y coordinate pairs that defines the shape of a line or polygon feature. , marking a single XY location in any given geographic or projected coordinate system. on the Earth's surface used for recording the elevation of topographic surface a detailed map of the surface features of land. It includes the mountains, hills, creeks, and other bumps and lumps on a particular hunk of earth. The word is a Greek-rooted combo of topos meaning "place" and graphein "to write." 's relief the difference between the highest and lowest point within a particular area while landforms are the descriptive words for individual features and a single point A GIS vector data in any sort of digital science or art, is simply denoting a type of graphical representation using straight lines to construct the outlines of objects geometry type which is made up of just one vertex pl. vertices One of a set of ordered x,y coordinate pairs that defines the shape of a line or polygon feature. , marking a single XY location in any given geographic or projected coordinate system. on the Earth's surface difference is large, the slope A numeric value - either in percent or degree - expressing the steepness or the rise/run of the landscape. is steep; if the difference is small, the slope A numeric value - either in percent or degree - expressing the steepness or the rise/run of the landscape. is gentle. Similarly, aspect [geographic coordinate systems] The direction the developable surface a geometric shape which will not be distorted when flattened. Used as the base shape to transfer features during projections. Most often a cone, cylinder, or plane (azimuthal) faces in relation to the geographic coordinate system. Normal; transverse, oblique[topography] The cardinal direction a slope A numeric value - either in percent or degree - expressing the steepness or the rise/run of the landscape. faces (NSEW) is determined by identifying the direction of the greatest downward slope A numeric value - either in percent or degree - expressing the steepness or the rise/run of the landscape. from a given pixel The smallest unit of information in a digital image or raster map, usually square or rectangular. Often used synonymously with cell. Pixel is an abbreviation of "picture element". .
Both slope A numeric value - either in percent or degree - expressing the steepness or the rise/run of the landscape. and aspect [geographic coordinate systems] The direction the developable surface a geometric shape which will not be distorted when flattened. Used as the base shape to transfer features during projections. Most often a cone, cylinder, or plane (azimuthal) faces in relation to the geographic coordinate system. Normal; transverse, oblique[topography] The cardinal direction a slope A numeric value - either in percent or degree - expressing the steepness or the rise/run of the landscape. faces (NSEW) rasters can be visualized using color gradients in ArcGIS, making it easier to interpret terrain characteristics. These derived datasets play a critical role in hydrology studies, construction planning, and environmental monitoring.
| Figure 3.12: Slope and Aspect Layers | |
|---|---|
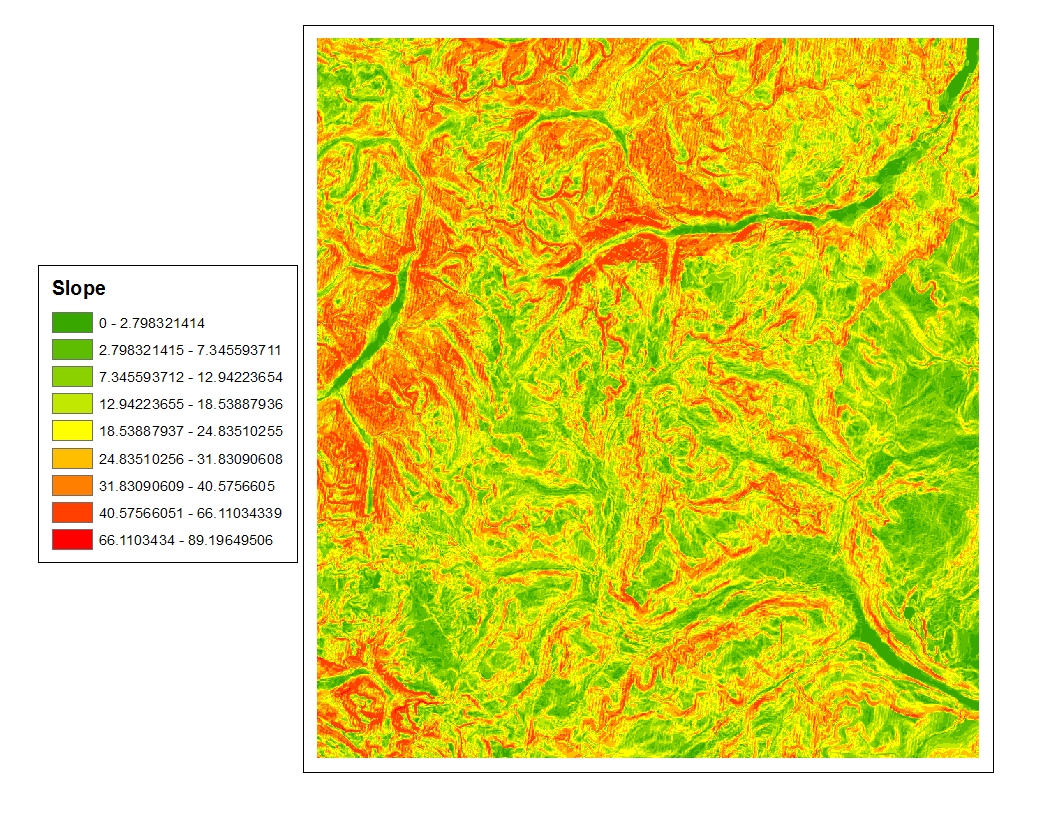 |  |
| Slope is the grade of the topographic surface a detailed map of the surface features of land. It includes the mountains, hills, creeks, and other bumps and lumps on a particular hunk of earth. The word is a Greek-rooted combo of topos meaning "place" and graphein "to write." . | Aspect is the cardinal direction of the slope A numeric value - either in percent or degree - expressing the steepness or the rise/run of the landscape. . Both layers are derived mathematically by the GIS Geographic Information Systems the software used to create, store, and manage spatial data Data that deals with location, such as lists of addresses, the footprint of a building, the boundaries of cities and counties, etc. , analyze spatial problems, and display the data in cartographic layouts Geographic Information Sciences software using elevation the vertical distance between local mean sea level the measurement above or below the global average at a single point A GIS vector data in any sort of digital science or art, is simply denoting a type of graphical representation using straight lines to construct the outlines of objects geometry type which is made up of just one vertex pl. vertices One of a set of ordered x,y coordinate pairs that defines the shape of a line or polygon feature. , marking a single XY location in any given geographic or projected coordinate system. on the Earth's surface used for recording the elevation of topographic surface a detailed map of the surface features of land. It includes the mountains, hills, creeks, and other bumps and lumps on a particular hunk of earth. The word is a Greek-rooted combo of topos meaning "place" and graphein "to write." 's relief the difference between the highest and lowest point within a particular area while landforms are the descriptive words for individual features and a single point A GIS vector data in any sort of digital science or art, is simply denoting a type of graphical representation using straight lines to construct the outlines of objects geometry type which is made up of just one vertex pl. vertices One of a set of ordered x,y coordinate pairs that defines the shape of a line or polygon feature. , marking a single XY location in any given geographic or projected coordinate system. on the Earth's surface values stored in DEMs. |
While GIS Geographic Information Systems the software used to create, store, and manage spatial data Data that deals with location, such as lists of addresses, the footprint of a building, the boundaries of cities and counties, etc. , analyze spatial problems, and display the data in cartographic layouts Geographic Information Sciences 1040 primarily focuses on vector data in any sort of digital science or art, is simply denoting a type of graphical representation using straight lines to construct the outlines of objects , understanding spatial raster Spatial raster data is a type of digital data that stores information about a location using a grid of pixels or cells AND has stored coordinate information based on any given geographic or projected coordinate system. datasets is essential for terrain analysis, remote sensing, and environmental modeling. Raster data, particularly DEM Digital Elevation Model -based layers, provide key insights into the physical landscape, allowing GIS Geographic Information Systems the software used to create, store, and manage spatial data Data that deals with location, such as lists of addresses, the footprint of a building, the boundaries of cities and counties, etc. , analyze spatial problems, and display the data in cartographic layouts Geographic Information Sciences users to perform advanced analyses that complement traditional vector-based methods. As you continue working with GIS Geographic Information Systems the software used to create, store, and manage spatial data Data that deals with location, such as lists of addresses, the footprint of a building, the boundaries of cities and counties, etc. , analyze spatial problems, and display the data in cartographic layouts Geographic Information Sciences , raster datasets will become an increasingly important part of spatial problem-solving.
Concept Quiz
3.3.4: Raster Pyramids: Optimizing Raster Performance in ArcGIS Pro
When you load raster data Raster data is a type of digital data that stores information about a location using a grid of pixels or cells. All spatial rasters are raster files, but not all raster files are spatial rasters. into ArcGIS Pro, you may be prompted with the option to "build raster pyramids Several re-sampled, reduced resolution versions of the original data that allows you to work with raster data faster by only showing the low resolution images (longer ground distance per pixel edge) when you are zoomed out, and the higher resolution image when you are zoomed in. ." While this might sound like a mysterious GIS Geographic Information Systems the software used to create, store, and manage spatial data Data that deals with location, such as lists of addresses, the footprint of a building, the boundaries of cities and counties, etc. , analyze spatial problems, and display the data in cartographic layouts Geographic Information Sciences process, raster pyramids Several re-sampled, reduced resolution versions of the original data that allows you to work with raster data faster by only showing the low resolution images (longer ground distance per pixel edge) when you are zoomed out, and the higher resolution image when you are zoomed in. are simply re-sampled, reduced-resolution versions of the original raster dataset. These lower-resolution copies improve performance by allowing the software to display simplified versions of the raster when zoomed out, while retaining full detail when zoomed in.
Raster pyramids significantly reduce drawing time, improving the responsiveness of the GIS Geographic Information Systems the software used to create, store, and manage spatial data Data that deals with location, such as lists of addresses, the footprint of a building, the boundaries of cities and counties, etc. , analyze spatial problems, and display the data in cartographic layouts Geographic Information Sciences software. Without pyramids, the software would have to load and redraw the full-resolution raster at every zoom level, which can lead to slow performance—especially when working with high-resolution imagery or large datasets. Think back to the days of dial-up internet, when downloading a high-resolution image meant watching it load line by line. In GIS Geographic Information Systems the software used to create, store, and manage spatial data Data that deals with location, such as lists of addresses, the footprint of a building, the boundaries of cities and counties, etc. , analyze spatial problems, and display the data in cartographic layouts Geographic Information Sciences , the situation is similar: high-resolution raster data Raster data is a type of digital data that stores information about a location using a grid of pixels or cells. All spatial rasters are raster files, but not all raster files are spatial rasters. requires more processing time, but pyramids allow for faster rendering, much like having optimized images for different levels of detail.
How Raster Pyramids Work
When you build raster pyramids Several re-sampled, reduced resolution versions of the original data that allows you to work with raster data faster by only showing the low resolution images (longer ground distance per pixel edge) when you are zoomed out, and the higher resolution image when you are zoomed in. , ArcGIS Pro generates multiple versions of the raster at progressively lower resolutions. When you zoom out, ArcGIS Pro automatically selects a coarser version (with fewer pixels per unit area), and when you zoom in, it retrieves the higher-resolution version for greater detail. This dynamic scaling reduces processing time and speeds up map navigation without altering the original raster data Raster data is a type of digital data that stores information about a location using a grid of pixels or cells. All spatial rasters are raster files, but not all raster files are spatial rasters. .
Where Are Raster Pyramids Stored?
Unlike ArcMap's MXD project files, which stored certain display optimizations internally, ArcGIS Pro saves raster pyramids Several re-sampled, reduced resolution versions of the original data that allows you to work with raster data faster by only showing the low resolution images (longer ground distance per pixel edge) when you are zoomed out, and the higher resolution image when you are zoomed in. as auxiliary files alongside the original raster dataset. These files typically have an .ovr extension (short for "overview"). Since they are stored externally, the pyramids remain available for use across multiple projects, preventing the need to rebuild them each time you load the raster.
While raster pyramids Several re-sampled, reduced resolution versions of the original data that allows you to work with raster data faster by only showing the low resolution images (longer ground distance per pixel edge) when you are zoomed out, and the higher resolution image when you are zoomed in. do not change the actual data or its spatial accuracy, they are an essential optimization tool for handling large rasters efficiently. In most cases, enabling raster pyramids Several re-sampled, reduced resolution versions of the original data that allows you to work with raster data faster by only showing the low resolution images (longer ground distance per pixel edge) when you are zoomed out, and the higher resolution image when you are zoomed in. is recommended, especially when working with high-resolution aerial imagery, LiDAR-derived DEMs, or other detailed raster datasets.
| Figure 3.13: A Graphical Example of Raster Pyramid Creation |
|---|
 |
| In this graphic, we can see the resampling of the raster pixels within the software. For every four pixels, in this example, the dominate color is found, then the next layer creates a pixel The smallest unit of information in a digital image or raster map, usually square or rectangular. Often used synonymously with cell. Pixel is an abbreviation of "picture element". of that color. This process is repeated for each resampled layer. |