2.8.1: Projection Methods to Projected Coordinate Systems
Up to this point A GIS vector data in any sort of digital science or art, is simply denoting a type of graphical representation using straight lines to construct the outlines of objects geometry type which is made up of just one vertex pl. vertices One of a set of ordered x,y coordinate pairs that defines the shape of a line or polygon feature. , marking a single XY location in any given geographic or projected coordinate system. , we've been examining projection technically: the result of using one of variety of methods to transfer the geographic locations of features from a geographic coordinate system to a developable surface everyday use: any coordinate system, geographic or projected methods and not projected coordinate systems. Just like when we learned geographic coordinate systems, there were steps we took to move from the geoid a model of the variation between global mean (average) sea level and local mean sea level the measurement above or below the global average at a single point A GIS vector data in any sort of digital science or art, is simply denoting a type of graphical representation using straight lines to construct the outlines of objects geometry type which is made up of just one vertex pl. vertices One of a set of ordered x,y coordinate pairs that defines the shape of a line or polygon feature. , marking a single XY location in any given geographic or projected coordinate system. on the Earth's surface used for recording the elevation of topographic surface a detailed map of the surface features of land. It includes the mountains, hills, creeks, and other bumps and lumps on a particular hunk of earth. The word is a Greek-rooted combo of topos meaning "place" and graphein "to write." 's relief the difference between the highest and lowest point within a particular area while landforms are the descriptive words for individual features , which is used to measure precise elevations on the topographic surface a detailed map of the surface features of land. It includes the mountains, hills, creeks, and other bumps and lumps on a particular hunk of earth. The word is a Greek-rooted combo of topos meaning "place" and graphein "to write." , to a reference ellipsoid an ellipsoid that is drawn to best-fit an area. World reference ellipsoids are drawn to best-fit the entire geoid; local ellipsoids are best fit on one side to a single place of the geoid , to a geographic grid the result of using an established angular unit of measure to label the intersections of north-south and east-west lines on the surface of the Earth starting the labels at a principal meridian the north-south line from which the labeling begins. East-west lines have a very obvious start point: the equator. North-south lines must start somewhere, so when it is established for a particular geographic grid, it can be considered the principal meridian. , to a datum, and finally to a geographic coordinate system. Projection methods stop being just methods and start to be projected coordinate systems after two more steps have been taken: 1. a linear unit of measure is decided, and 2. a coordinate system origin is established. All coordinate systems have a single origin point A GIS vector data in any sort of digital science or art, is simply denoting a type of graphical representation using straight lines to construct the outlines of objects geometry type which is made up of just one vertex pl. vertices One of a set of ordered x,y coordinate pairs that defines the shape of a line or polygon feature. , marking a single XY location in any given geographic or projected coordinate system. , a point A GIS vector data in any sort of digital science or art, is simply denoting a type of graphical representation using straight lines to construct the outlines of objects geometry type which is made up of just one vertex pl. vertices One of a set of ordered x,y coordinate pairs that defines the shape of a line or polygon feature. , marking a single XY location in any given geographic or projected coordinate system. usually labeled (0, 0), however, some systems, like UTM Universal Transverse Mercator , use a different origin value to prevent negative numbers (discussed in more detail in Section 2.8.4). No matter if the origin is labeled (0, 0) or something else, the action is the same where each of the intersections along the X and Y axis are labeled, counting up or down from the origin values.
Utilizing a variety of origin points, which come from moving around one tangential line or splitting the difference between to secant lines, allows for the distortion to be the least along either the X or Y axis, depending on the aspect [geographic coordinate systems] The direction the developable surface a geometric shape which will not be distorted when flattened. Used as the base shape to transfer features during projections. Most often a cone, cylinder, or plane (azimuthal) faces in relation to the geographic coordinate system. Normal; transverse, oblique[topography] The cardinal direction a slope A numeric value - either in percent or degree - expressing the steepness or the rise/run of the landscape. faces (NSEW) of the projection technically: the result of using one of variety of methods to transfer the geographic locations of features from a geographic coordinate system to a developable surface everyday use: any coordinate system, geographic or projected method. This movement, in addition to a large selection of reference ellipsoids allows for the maps we create to have the highest accuracy and precision paired with the least amount of distortion while still using linear units.
As stated above, the second factor that a projected coordinate system needs that takes it from a projection technically: the result of using one of variety of methods to transfer the geographic locations of features from a geographic coordinate system to a developable surface everyday use: any coordinate system, geographic or projected method to establish the linear units it's going to use, most commonly, feet, meters, and international feet. When a geographic grid the result of using an established angular unit of measure to label the intersections of north-south and east-west lines on the surface of the Earth starting the labels at a principal meridian the north-south line from which the labeling begins. East-west lines have a very obvious start point: the equator. North-south lines must start somewhere, so when it is established for a particular geographic grid, it can be considered the principal meridian. 's intersections are labeled via measuring from either the equator or principal meridian the north-south line from which the labeling begins. East-west lines have a very obvious start point: the equator. North-south lines must start somewhere, so when it is established for a particular geographic grid, it can be considered the principal meridian. , angles are easier to use since we are dealing with a sphere which later goes through a affine transformation to become an ellipsoid. When we are making measurements on a flat map - a projection technically: the result of using one of variety of methods to transfer the geographic locations of features from a geographic coordinate system to a developable surface everyday use: any coordinate system, geographic or projected - we then switch to linear units of measure, which are much more convenient and make more sense to us.
To review, a projection technically: the result of using one of variety of methods to transfer the geographic locations of features from a geographic coordinate system to a developable surface everyday use: any coordinate system, geographic or projected method includes selecting a projected coordinate system, a developable surface a geometric shape which will not be distorted when flattened. Used as the base shape to transfer features during projections. Most often a cone, cylinder, or plane (azimuthal) , such as a cone, cylinder, or flat plane (azimuthal), and an aspect [geographic coordinate systems] The direction the developable surface a geometric shape which will not be distorted when flattened. Used as the base shape to transfer features during projections. Most often a cone, cylinder, or plane (azimuthal) faces in relation to the geographic coordinate system. Normal; transverse, oblique[topography] The cardinal direction a slope A numeric value - either in percent or degree - expressing the steepness or the rise/run of the landscape. faces (NSEW) , selecting which direction to turn the Earth within the given developable surface a geometric shape which will not be distorted when flattened. Used as the base shape to transfer features during projections. Most often a cone, cylinder, or plane (azimuthal) . It becomes a projected coordinate system when a linear unit and a single secant line or pair of tangential lines have been selected prior to transferring the land and ocean masses to the developable surface a geometric shape which will not be distorted when flattened. Used as the base shape to transfer features during projections. Most often a cone, cylinder, or plane (azimuthal) , which is then cut and unrolled into a flat map. The selection of the placement of the secant or tangential lines define the location of the system's origin, as these lines will have the least amount of distortion. Selecting and moving the secant or tangential lines is made easier with software like ArcGIS, since it allows you to simple type in which line(s) you'd like to use and it makes all of the adjustments necessary.
As you will learn throughout the semester, there are several words in GIS Geographic Information Systems the software used to create, store, and manage spatial data Data that deals with location, such as lists of addresses, the footprint of a building, the boundaries of cities and counties, etc. , analyze spatial problems, and display the data in cartographic layouts Geographic Information Sciences which are used incorrectly or may have a double meaning. This is in no way done to confuse you (really), but it’s just a language that has been used by lots of folks, most of whom came from other sciences. As GIS Geographic Information Systems the software used to create, store, and manage spatial data Data that deals with location, such as lists of addresses, the footprint of a building, the boundaries of cities and counties, etc. , analyze spatial problems, and display the data in cartographic layouts Geographic Information Sciences is a fairly young science, most of it, including the terminology, comes from other places. This, in addition to a whole lot of "DIY GIS Geographic Information Systems the software used to create, store, and manage spatial data Data that deals with location, such as lists of addresses, the footprint of a building, the boundaries of cities and counties, etc. , analyze spatial problems, and display the data in cartographic layouts Geographic Information Sciences ", has led to a fair number of words which are used either incorrectly, partially correct, or that have two, and sometimes three, meanings. The term " projection technically: the result of using one of variety of methods to transfer the geographic locations of features from a geographic coordinate system to a developable surface everyday use: any coordinate system, geographic or projected " is one of those words which, in addition to having a couple of meanings (which, luckily, are mostly correct and mostly similar), is used as a rather "all encompassing" term to mean "geographic coordinate system", "projected coordinate system", " projection technically: the result of using one of variety of methods to transfer the geographic locations of features from a geographic coordinate system to a developable surface everyday use: any coordinate system, geographic or projected method", and "convert data from one coordinate system to another".
Technically, the word " projection technically: the result of using one of variety of methods to transfer the geographic locations of features from a geographic coordinate system to a developable surface everyday use: any coordinate system, geographic or projected " or "to project" is in reference to the action of creating a projection technically: the result of using one of variety of methods to transfer the geographic locations of features from a geographic coordinate system to a developable surface everyday use: any coordinate system, geographic or projected and "projected coordinate system (PCS)" is the result of the action, after a linear unit and system origin has been set. For example, "Lambert Conformal Conic" is However, you’ll almost always here a projected coordinate system (and geographic coordinate systems, for that fact) referred to as a " projection technically: the result of using one of variety of methods to transfer the geographic locations of features from a geographic coordinate system to a developable surface everyday use: any coordinate system, geographic or projected ", simply because it’s shorter and easier. This text attempts to use the correct terms in the correct places while you’re still learning the process, but later will switch to using " projection technically: the result of using one of variety of methods to transfer the geographic locations of features from a geographic coordinate system to a developable surface everyday use: any coordinate system, geographic or projected " to mean both the action and the product - but by then, you’ll be able to note the difference in context.
We noted earlier that the word projection technically: the result of using one of variety of methods to transfer the geographic locations of features from a geographic coordinate system to a developable surface everyday use: any coordinate system, geographic or projected refers to the method used to create a the first part of a projected coordinate system. This idea will come up again when we begin to explore coordinate systems (both geographic and projected) in the GIS Geographic Information Systems the software used to create, store, and manage spatial data Data that deals with location, such as lists of addresses, the footprint of a building, the boundaries of cities and counties, etc. , analyze spatial problems, and display the data in cartographic layouts Geographic Information Sciences software. For every projected coordinate system, it will have a very specific name that represents where is should be used and the method by which it was created, as well as additional information about the method with which it was created - including the name. That is to say, the name of the PCS is the most specific thing, consisting of where you should use that particular PCS and the method it was created, and not exactly to be redundant, as there are always cases which vary from the norm, you will find the projection technically: the result of using one of variety of methods to transfer the geographic locations of features from a geographic coordinate system to a developable surface everyday use: any coordinate system, geographic or projected method listed, which is slightly less specific. For example, you might see USA Contiguous Lambert Conformal Conic as the specific name of a projected coordinate system and Lambert Conformal Conic as the projection technically: the result of using one of variety of methods to transfer the geographic locations of features from a geographic coordinate system to a developable surface everyday use: any coordinate system, geographic or projected method. The name Lambert Conformal Conic, as we learned earlier, means the projection technically: the result of using one of variety of methods to transfer the geographic locations of features from a geographic coordinate system to a developable surface everyday use: any coordinate system, geographic or projected method used a cone as the developable surface a geometric shape which will not be distorted when flattened. Used as the base shape to transfer features during projections. Most often a cone, cylinder, or plane (azimuthal) and it is meant to be used with projected coordinate systems which need to preserve shape ( conformal serve the purpose of preserving shape, distance, and bearing, at the expense of area and scale ) within the contiguous United States.
2.8.2: Map Scale
Before we look at how to choose a projection technically: the result of using one of variety of methods to transfer the geographic locations of features from a geographic coordinate system to a developable surface everyday use: any coordinate system, geographic or projected , lets first look at the idea of map scale a mathematical representation expressing distance on a map vs distance on the ground . Map scale is simply the mathematical ratio of the distance between two points represented on a map and the same two points in the real world expressed in one of two ways:
- A Statement of EquivalencyorVerbal Scale
- A Representative Fraction
- Scale Bars
Statement of Equivalency or Verbal Scale
A statement of equivalency (also known as '' verbal scale see statement of equivalency ''): the relative scale is expressly defined on a map: 1 cm = 1 kilometer; 1 inch = 10 miles (also known as verbal scale see statement of equivalency ) is when the relative scale is expressly defined on a map: 1cm = 1 kilometer; 1 inch = 10 miles, 5 nanometers = 12 kilometers (even though that last one would be a bit silly to use). For every measured unit on the map, one would travel the same distance in the real world. For the map where one inch equals ten miles, if you were to use a wooden ruler and measure an inch on the map, you can safely assume that the distance between those two points in the real world would be 10 miles.
The catch with a statement of equivalency (also known as '' verbal scale see statement of equivalency ''): the relative scale is expressly defined on a map: 1 cm = 1 kilometer; 1 inch = 10 miles is, however, that the statement is only good for those units. If you were to measure the same map as above in centimeters, you could not assume that the distance between one centimeter is going to be ten miles. You could, using unit conversion, assume that 2.54 centimeters on the map would equal ten miles, however, but that means you'd be doing a whole lot of math and conversions. This is why, when you don't know what units your map's audience best thinks in, is to use representative fractions instead.
Representative Fractions
Similar to statements of equivalency, a representative fraction expression of map scale in ratio form utilizing non-specific linear unit, such as 1 map unit equals 250,000 real world units, or 1:250,000 is unitless. Presented as a ratio such as1:24,000; 1:100,000; 1:1,000,000; and so on, one unit on the map equals the stated units in the real world. In other words, a map that has a scale of 1:24,000 means that one inch equals 24,000 inches in the real world OR 1 centimeter equals 24,000 centimeters in the real world. With representative fractions, you don't need to assume what units your audience thinks best in, but you also assume they know how many inches are in a mile, since the representative fractions only work with a single unit at a time.
Scale Bars
Lastly, with maps, we often see scale bars drawn on the bottom. Like a statement of equivalency (also known as '' verbal scale see statement of equivalency ''): the relative scale is expressly defined on a map: 1 cm = 1 kilometer; 1 inch = 10 miles , the scale bar will be shown in a set unit of measure, and not a representative fraction expression of map scale in ratio form utilizing non-specific linear unit, such as 1 map unit equals 250,000 real world units, or 1:250,000 . Unlike statement of equivalencies, however, you could potentially use a ruler of a different unit scale to measure the map. If the map scale a mathematical representation expressing distance on a map vs distance on the ground bar is shown in inches and miles, you could use a centimeter ruler to find the distancein miles. You're not exactly limited by the unit of measure of the ruler, but since the scale bar is set up for one kind of units, you can't convert the units back and forth, but you could successfully use a different kind of ruler.
- One note: When it comes to reproducing maps, the only one of these three which stays constant is a scale bar. Statement of equivalencies and representative fractions are only true for the size of map the originally refereed to. If a map is copied at a smaller or larger size, the two ratios will be incorrect while the scale bar remains correct.
Large and Small Scale
In GIS Geographic Information Systems the software used to create, store, and manage spatial data Data that deals with location, such as lists of addresses, the footprint of a building, the boundaries of cities and counties, etc. , analyze spatial problems, and display the data in cartographic layouts Geographic Information Sciences and cartography, we often use the terms small scale, which are equally as often mixed up. When we look at the representative fraction expression of map scale in ratio form utilizing non-specific linear unit, such as 1 map unit equals 250,000 real world units, or 1:250,000 scale of a map and see a large number in the denominator, we tend toincorrectlyconclude the map is the large scale, when in fact a large denominator leads to a small number (a number a long distance from one on the number line)- thus a small scale map a map where the representative fraction is far from one and the objects in the map are relatively small (zoomed out) . Large scale maps have a small denominator where the number is closer to one on the number line.
The confusion is clear. When you see a map with a representative scale fraction with a large denominator and a larger geographic extent, your first inclination is to assume the map has a large scale. If we keep looking back on the representative fraction expression of map scale in ratio form utilizing non-specific linear unit, such as 1 map unit equals 250,000 real world units, or 1:250,000 , we see that fractions with a smaller denominator are closer to one on the number line (and a scale of 1:1 is the real world) and fractions with larger denominators are further away from the representative size being the same as the real world. To keep it straight, think that smaller denominators lead to larger features (more like the real world) and larger features lead to large scale maps.
| Figure 2.36: Small and Large Scale Maps | |
|---|---|
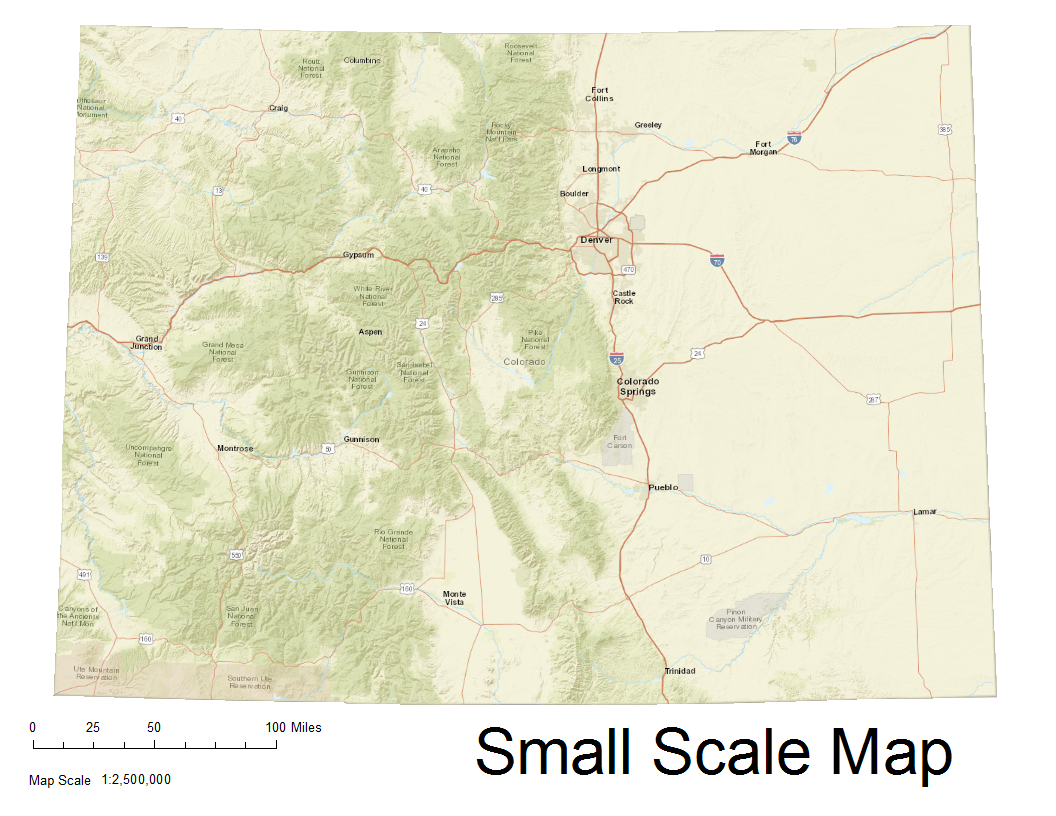 | 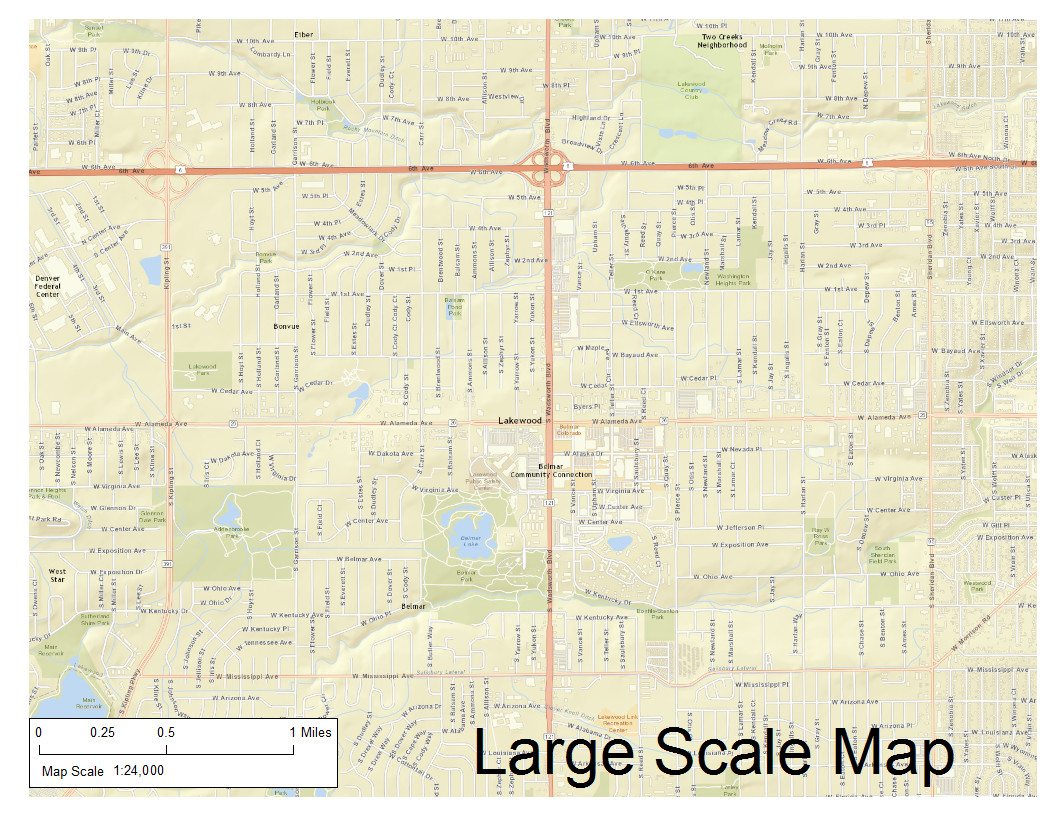 |
2.8.3: Projection Selection
So far in this Chapter, we have looked at the idea of geodesy the science of measuring and monitoring the size and shape of the Earth and the location of points on its surface and measuring the Earth, representing the Earth’s odd shape as a geoid a model of the variation between global mean (average) sea level and local mean sea level the measurement above or below the global average at a single point A GIS vector data in any sort of digital science or art, is simply denoting a type of graphical representation using straight lines to construct the outlines of objects geometry type which is made up of just one vertex pl. vertices One of a set of ordered x,y coordinate pairs that defines the shape of a line or polygon feature. , marking a single XY location in any given geographic or projected coordinate system. on the Earth's surface used for recording the elevation of topographic surface a detailed map of the surface features of land. It includes the mountains, hills, creeks, and other bumps and lumps on a particular hunk of earth. The word is a Greek-rooted combo of topos meaning "place" and graphein "to write." 's relief the difference between the highest and lowest point within a particular area while landforms are the descriptive words for individual features , which is used to measure precise elevations on the topographic surface a detailed map of the surface features of land. It includes the mountains, hills, creeks, and other bumps and lumps on a particular hunk of earth. The word is a Greek-rooted combo of topos meaning "place" and graphein "to write." and a mathematical ellipsoid, creating measurable locations on the Earth’s surface by combining reference ellipsoids and datums to create geographic coordinate systems, how to use the idea of projections to convert a round Earth to a flat map, and lastly, how different projections are designed to minimize different distortions. Whew! That’s a lot of information - but we are not done quite yet. A solid understanding of how GCS’s and projections are created is essential to understanding how we use them in GIS Geographic Information Systems the software used to create, store, and manage spatial data Data that deals with location, such as lists of addresses, the footprint of a building, the boundaries of cities and counties, etc. , analyze spatial problems, and display the data in cartographic layouts Geographic Information Sciences , so we are going to finish off this chapter with a bit of practical projection technically: the result of using one of variety of methods to transfer the geographic locations of features from a geographic coordinate system to a developable surface everyday use: any coordinate system, geographic or projected use.
One of the most common questions asked by introduction to GIS Geographic Information Systems the software used to create, store, and manage spatial data Data that deals with location, such as lists of addresses, the footprint of a building, the boundaries of cities and counties, etc. , analyze spatial problems, and display the data in cartographic layouts Geographic Information Sciences students after learning about projections is: "What projection technically: the result of using one of variety of methods to transfer the geographic locations of features from a geographic coordinate system to a developable surface everyday use: any coordinate system, geographic or projected is best for my project"? This is one of those questions which has the unfortunate answer of "Well, that depends". When you look at how projections are created and what distortions come into play with their use, you will start to realize that being able to select the "proper" projection technically: the result of using one of variety of methods to transfer the geographic locations of features from a geographic coordinate system to a developable surface everyday use: any coordinate system, geographic or projected is just an understanding of the gains and setbacks of each kind of projection technically: the result of using one of variety of methods to transfer the geographic locations of features from a geographic coordinate system to a developable surface everyday use: any coordinate system, geographic or projected . While there are no real “rules” on projection technically: the result of using one of variety of methods to transfer the geographic locations of features from a geographic coordinate system to a developable surface everyday use: any coordinate system, geographic or projected selection, there are a few guidelines to help you choose:
- What distortion can you give up in favor of the one(s) you really need?
- All projected coordinate systems come with some distortion, as we've learned there are no projections which preserve all kinds at one time. The biggest decision of which projection technically: the result of using one of variety of methods to transfer the geographic locations of features from a geographic coordinate system to a developable surface everyday use: any coordinate system, geographic or projected to use for a project is that of distortion. If you have a project which deals with solving the the area which has changed, selecting a projection technically: the result of using one of variety of methods to transfer the geographic locations of features from a geographic coordinate system to a developable surface everyday use: any coordinate system, geographic or projected which preserves shape will produce errors in the solved measurements. On the other hand, when you go to present your work at the end of the project, keeping the projection technically: the result of using one of variety of methods to transfer the geographic locations of features from a geographic coordinate system to a developable surface everyday use: any coordinate system, geographic or projected which preserved area and distorted shape will look quite odd to your reader.
- How big is your project area?
- Now that we understand what scale is in regards to GIS Geographic Information Systems the software used to create, store, and manage spatial data Data that deals with location, such as lists of addresses, the footprint of a building, the boundaries of cities and counties, etc. , analyze spatial problems, and display the data in cartographic layouts Geographic Information Sciences and cartography, we can explore projections in these same terms. As we learned with reference ellipsoids, better accuracy and precision come with better localization, and the same is held true with projections. Selecting a localized projection technically: the result of using one of variety of methods to transfer the geographic locations of features from a geographic coordinate system to a developable surface everyday use: any coordinate system, geographic or projected will decrease distortion close to the tangential point A GIS vector data in any sort of digital science or art, is simply denoting a type of graphical representation using straight lines to construct the outlines of objects geometry type which is made up of just one vertex pl. vertices One of a set of ordered x,y coordinate pairs that defines the shape of a line or polygon feature. , marking a single XY location in any given geographic or projected coordinate system. , and that distortion will increase as you move away, so choosing a projection technically: the result of using one of variety of methods to transfer the geographic locations of features from a geographic coordinate system to a developable surface everyday use: any coordinate system, geographic or projected designed for use in Florida and applying it to Oregon is most likely a bad idea. And when you are completing a project which covers the entire United States, choosing a projection technically: the result of using one of variety of methods to transfer the geographic locations of features from a geographic coordinate system to a developable surface everyday use: any coordinate system, geographic or projected designed for either Oregon or Florida (or the whole Earth, for that fact) is also a bad idea.
- What unit of measure (feet, inches,
degrees
measurement of plane angle, representing 1⁄360 of a full rotation (circle). In full, a degree of arc or arc degree. Usually denoted by °
...) would you like your map to be measured in?
- We know that geographic coordinate systems consist of a datum, a reference ellipsoid an ellipsoid that is drawn to best-fit an area. World reference ellipsoids are drawn to best-fit the entire geoid; local ellipsoids are best fit on one side to a single place of the geoid , and an angular unit of measure the selected units for measuring angles. Choices include degree and radians. (such as degree with the latitude also known as 'parallels' the east-west portion of a geographic grid measured with angles between 0 and 90° /longitude system) - which means that spatial objects collected in a GCS will be measured in that unit of measure. For example, if you create a GIS Geographic Information Systems the software used to create, store, and manage spatial data Data that deals with location, such as lists of addresses, the footprint of a building, the boundaries of cities and counties, etc. , analyze spatial problems, and display the data in cartographic layouts Geographic Information Sciences layer of roads, and the chosen GCS is WGS84, the length of the roads will be measured in degrees measurement of plane angle, representing 1⁄360 of a full rotation (circle). In full, a degree of arc or arc degree. Usually denoted by ° . When we go through the process of creating a projection technically: the result of using one of variety of methods to transfer the geographic locations of features from a geographic coordinate system to a developable surface everyday use: any coordinate system, geographic or projected , moving from the round (measured in angles) to the flat, we can move from an angular unit of measure the selected units for measuring angles. Choices include degree and radians. to a linear one, such as feet and meters. When you move the roads layer you created in WGS84, and move it, or project it, from the GCS WGS84 to a flat map (say WGS84 California (Teale) Albers), you are now capable of measuring in feet, yards, and miles.
- What is the end goal of your project?
- While we will spend quite a bit of time discussing this in Chapter Nine, for now, we can just look at the end goal as how is it the map should look? Will it be displayed on a wall and you need to preserve shape and size or used for navigation where distance and bearing are important. Choosing the correct projection technically: the result of using one of variety of methods to transfer the geographic locations of features from a geographic coordinate system to a developable surface everyday use: any coordinate system, geographic or projected leads to the proper end product.
2.8.4: Examples Of Projected Coordinate Systems
Up to this point A GIS vector data in any sort of digital science or art, is simply denoting a type of graphical representation using straight lines to construct the outlines of objects geometry type which is made up of just one vertex pl. vertices One of a set of ordered x,y coordinate pairs that defines the shape of a line or polygon feature. , marking a single XY location in any given geographic or projected coordinate system. , we've spent quite a lot of time examining the process of creating projected coordinate systems: the projection technically: the result of using one of variety of methods to transfer the geographic locations of features from a geographic coordinate system to a developable surface everyday use: any coordinate system, geographic or projected methods, the distortions that are a result of the process, kinds of developable surfaces, and kinds of aspects. To be a quality GIS Geographic Information Systems the software used to create, store, and manage spatial data Data that deals with location, such as lists of addresses, the footprint of a building, the boundaries of cities and counties, etc. , analyze spatial problems, and display the data in cartographic layouts Geographic Information Sciences technician, it's important to understand the process of creating these coordinate systems which we use every day. With this understanding comes the ability to make better decisions about maps, products, and solutions. Within the GIS Geographic Information Systems the software used to create, store, and manage spatial data Data that deals with location, such as lists of addresses, the footprint of a building, the boundaries of cities and counties, etc. , analyze spatial problems, and display the data in cartographic layouts Geographic Information Sciences software, you will find all of the information about how a particular projection technically: the result of using one of variety of methods to transfer the geographic locations of features from a geographic coordinate system to a developable surface everyday use: any coordinate system, geographic or projected was created, which will help you understand it's strength and weaknesses.
In the next section, will look at four common projected coordinate systems and examine how they were made, which - as stated above - will let us in on the benefits of selecting that projection technically: the result of using one of variety of methods to transfer the geographic locations of features from a geographic coordinate system to a developable surface everyday use: any coordinate system, geographic or projected for a specific project.
Normal Mercator and Transverse Mercator
Normal Mercator
The Normal Mercator projection technically: the result of using one of variety of methods to transfer the geographic locations of features from a geographic coordinate system to a developable surface everyday use: any coordinate system, geographic or projected is one of the most common, and most controversial, projections out there. Just like it was stated in the West Wing clip we watched, the Mercator projection technically: the result of using one of variety of methods to transfer the geographic locations of features from a geographic coordinate system to a developable surface everyday use: any coordinate system, geographic or projected is a conformal serve the purpose of preserving shape, distance, and bearing, at the expense of area and scale cylindrical projection technically: the result of using one of variety of methods to transfer the geographic locations of features from a geographic coordinate system to a developable surface everyday use: any coordinate system, geographic or projected , tangent at the Equator, and designed to preserve shape, distance, and bearing. Adjacent to the tangential line, distortion is minimal, but increases rapidly as one moves north or south. The Mercator projection technically: the result of using one of variety of methods to transfer the geographic locations of features from a geographic coordinate system to a developable surface everyday use: any coordinate system, geographic or projected (and it’s cousin, Web Mercator) is used for large areas (small scale) nearest the mid-latitudes.
Transverse Mercator
The Transverse Mercator projections, like we learned in the previous section, turn the tangential line from a parallel to a meridian, which reduces distortion along a North-South line, with that distortion increasing moving east or west.
| Figure 2.37: Normal and Transverse Mercator Projected Coordinate Systems | |
|---|---|
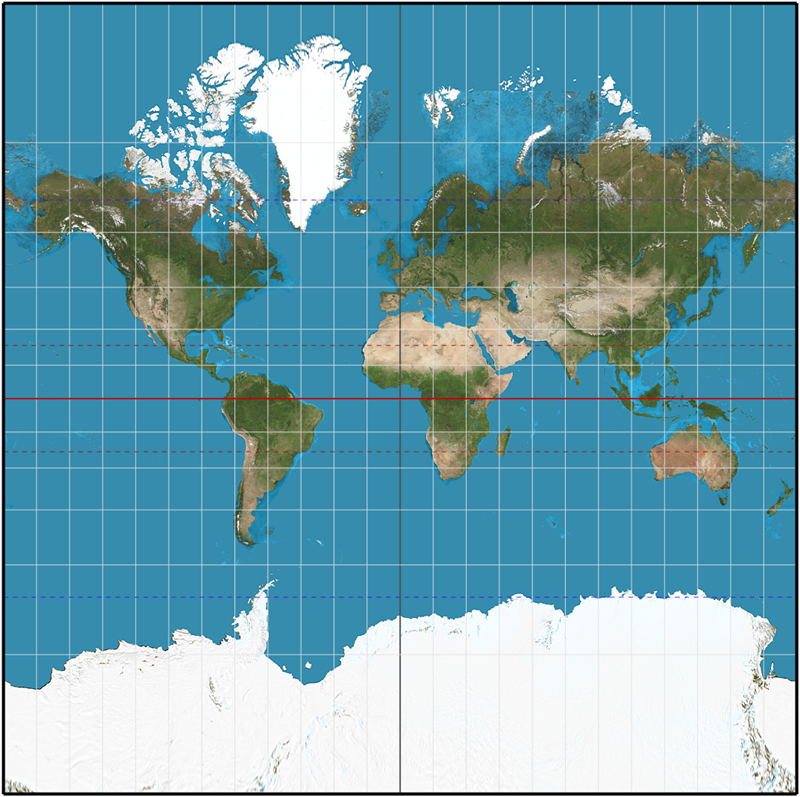 | |
Normal Mercator Projected Coordinate System | Transverse Mercator Projected Coordinate System |
Lambert Conformal Conic
Looking at the name, we immediately know this projection technically: the result of using one of variety of methods to transfer the geographic locations of features from a geographic coordinate system to a developable surface everyday use: any coordinate system, geographic or projected is designed to preserve shape, distance, and bearing ( conformal serve the purpose of preserving shape, distance, and bearing, at the expense of area and scale ) and is created from a conic developable surface a geometric shape which will not be distorted when flattened. Used as the base shape to transfer features during projections. Most often a cone, cylinder, or plane (azimuthal) (and was designed by a guy named Lambert). Designed by Johann Heinrich Lambert in 1772, the Lambert Conformal Conic projection technically: the result of using one of variety of methods to transfer the geographic locations of features from a geographic coordinate system to a developable surface everyday use: any coordinate system, geographic or projected is used to map large areas (small scale), especially in the mid-latitudes, where the secant lines are placed at roughly 20°N and 60°S.
| Figure 2.38: Lambert Conformal Conic Projected Coordinate System |
|---|
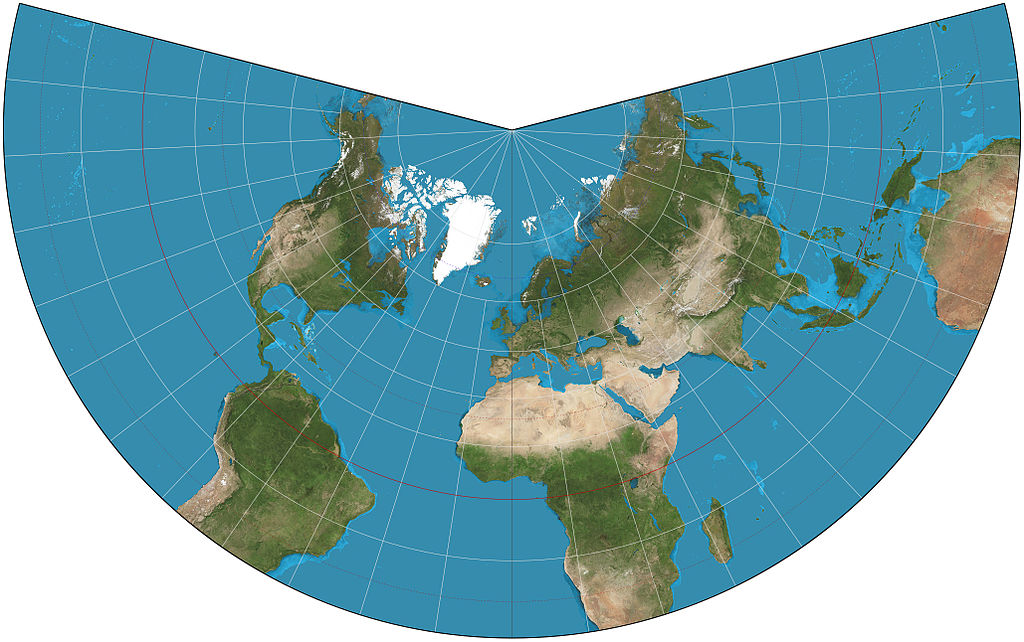 |
Universal Transverse Mercator( UTM Universal Transverse Mercator )
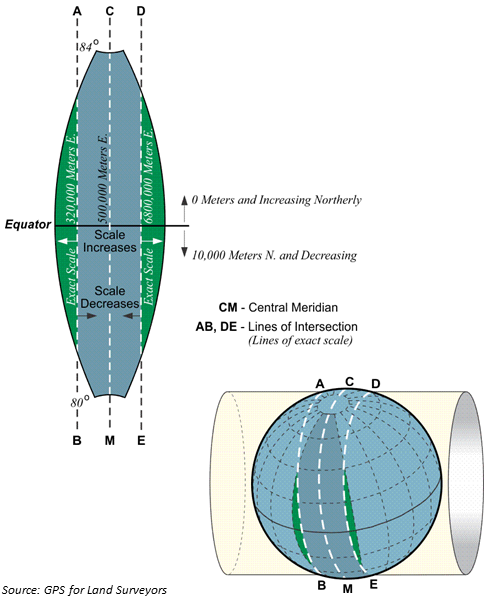
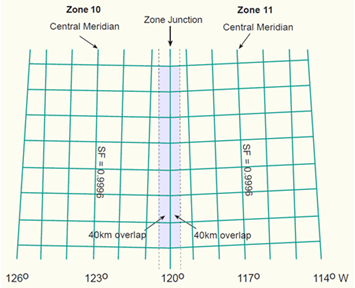
Universal Transverse Mercator is a technically a planar coordinate system the result of converting an angular unit of measure used to locate objects on a geographic coordinate system to a linear unit of measure via a Cartesian Coordinate System. Planar Coordinate Systems utilize linear units such as feet, meters, and international feet. - a specially designed method for finding a location on a two-dimensional map, which is based on a projection technically: the result of using one of variety of methods to transfer the geographic locations of features from a geographic coordinate system to a developable surface everyday use: any coordinate system, geographic or projected . Like with the Lambert Conformal Conic projection technically: the result of using one of variety of methods to transfer the geographic locations of features from a geographic coordinate system to a developable surface everyday use: any coordinate system, geographic or projected , we can look to the name - Universal Transverse Mercator - to see the projection technically: the result of using one of variety of methods to transfer the geographic locations of features from a geographic coordinate system to a developable surface everyday use: any coordinate system, geographic or projected is based on the transverse Mercator projection technically: the result of using one of variety of methods to transfer the geographic locations of features from a geographic coordinate system to a developable surface everyday use: any coordinate system, geographic or projected . The “universal” part comes in by altering the transverse methods slightly instead of being tangent at one line and projecting the entire globe, a smaller projection technically: the result of using one of variety of methods to transfer the geographic locations of features from a geographic coordinate system to a developable surface everyday use: any coordinate system, geographic or projected is made by placing the cylinder secant at two lines 6° apart, creating a strip or “zone”. The secant lines are then rotated, and another strip is taken (360° / 6° = 60 zones). By stitching together all 60 zones together, a complete world projection technically: the result of using one of variety of methods to transfer the geographic locations of features from a geographic coordinate system to a developable surface everyday use: any coordinate system, geographic or projected is made with distortion reduced in every zone (vs at a only single meridian). Like the Transverse Mercator projection technically: the result of using one of variety of methods to transfer the geographic locations of features from a geographic coordinate system to a developable surface everyday use: any coordinate system, geographic or projected , however, the distortion is too extreme at the poles (the sweet spots are between 84°N and 80°S) and UTM Universal Transverse Mercator is not used.
| Figure 2.39: Universal Transverse Mercator Projected Coordinate System |
|---|
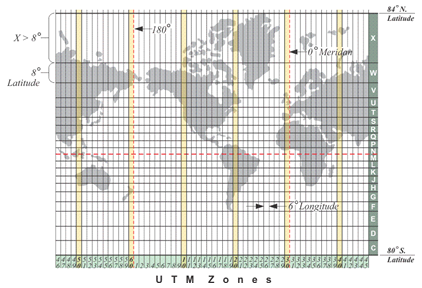 |
Since UTM Universal Transverse Mercator is a planar coordinate system the result of converting an angular unit of measure used to locate objects on a geographic coordinate system to a linear unit of measure via a Cartesian Coordinate System. Planar Coordinate Systems utilize linear units such as feet, meters, and international feet. , it utilizes a Cartesian Coordinate system affixed to an origin and labels XY intersections by measuring the linear distance from that origin. Yet, the UTM Universal Transverse Mercator system delivers the geographic grid the result of using an established angular unit of measure to label the intersections of north-south and east-west lines on the surface of the Earth starting the labels at a principal meridian the north-south line from which the labeling begins. East-west lines have a very obvious start point: the equator. North-south lines must start somewhere, so when it is established for a particular geographic grid, it can be considered the principal meridian. in a unique way - with 60 different origins, one for each zone.
Using the equator as the X axis, each UTM Universal Transverse Mercator zone is bisected right down the middle creating a central meridian, with 3° on the east and 3° on the west (and the Y axis). North of the equator is the North Zone, denoted with the number of the zone and an N, such as Zone 18N, and an S for south, such as Zone 18S. If the origin was labeled 0,0 where the equator and central meridian intersect in each zone, that means there would have to be negative numbers - those west of the central meridian and south of the equator. To combat the negative numbers, the 0,0 was arbitrarily changed to 500,000 and 10,000,000, meaning coordinates west of the central meridian start counting down from 499,999 meters and south of the equator count down from 9,999,999 meters. Since UTM Universal Transverse Mercator measurements come from a projection technically: the result of using one of variety of methods to transfer the geographic locations of features from a geographic coordinate system to a developable surface everyday use: any coordinate system, geographic or projected and not a GCS, the terms false easting and false northing are used in place of North and East, like we see with Latitude and Longitude.
Whew! That was a lot of information in two paragraphs. Let’s look at some examples to help understand what we just read.
| Figure 2.40: The UTM Universal Transverse Mercator System Explained | |
|---|---|
 |  |
| First, we place the cylinder secant along two lines 6° apart to make a zone. | Since our goal is to reduce distortion and create a flat map with planar coordinates, the two curved sections are overlapped with the neighboring zone to make a rectangular strip. |
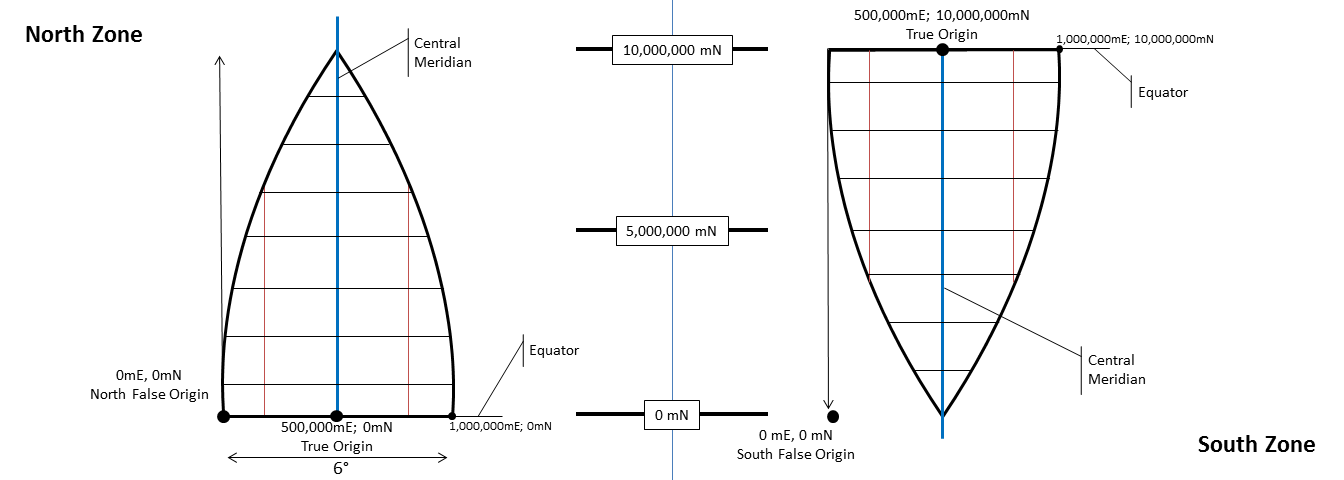 | |
| The North and South halves of each zone contains a false and a true origin, with the false origin located at 0 mE, 0mN, as expected, and the false origin located where the central meridian and equator intersect. The North Zone true origin is located at 5000,000 mE, 0mN while the South Zone true origin is located at 500,000 mE, 10,000,000mN. The arbitrary numbers assigned to the false origins prevents the use of negative numbers for
UTM
Universal Transverse Mercator
coordinates. Since each zone is labeled the same way in reference to the UTM Universal Transverse Mercator coordinates, each unique coordinate pair occurs 120 times, thus making the addition of the zone number and North or South designation imperative for the coordinate label. For example, 420235 mE, 3868323mN occurs 120 times, but UTM Universal Transverse Mercator 11N 420235 mE, 3868323mN occurs only once. | |
State Plane Coordinate System(SPCS)
The UTM Universal Transverse Mercator planar coordinate system the result of converting an angular unit of measure used to locate objects on a geographic coordinate system to a linear unit of measure via a Cartesian Coordinate System. Planar Coordinate Systems utilize linear units such as feet, meters, and international feet. is a great example of a “global” system designed to minimize distortion and locate positions over a large area using series of multiple, smaller projections stitched together. An excellent example of a “local” coordinate system with the same purpose is the State Plane Coordinate System or SPCS.
SPCS breaks the United States into sections by state, and in many cases, breaks states into zones, all with the goal of reducing distortion and labeling locations. For east-west trending states, such as Tennessee and Colorado, utilize a Lambert Conformal Conic projection technically: the result of using one of variety of methods to transfer the geographic locations of features from a geographic coordinate system to a developable surface everyday use: any coordinate system, geographic or projected , while north-south trending states such as Illinois and Mississippi, use a Transverse Mercator projection technically: the result of using one of variety of methods to transfer the geographic locations of features from a geographic coordinate system to a developable surface everyday use: any coordinate system, geographic or projected (The panhandle of Alaska didn’t fall into either category, thus an Oblique Mercator was used). Thinking about what we’ve learned so far, why were the Lambert Conformal Conic and Transverse Mercator projections used?
| Figure 2.41: State Plane Coordinate System (SPCS) |
|---|
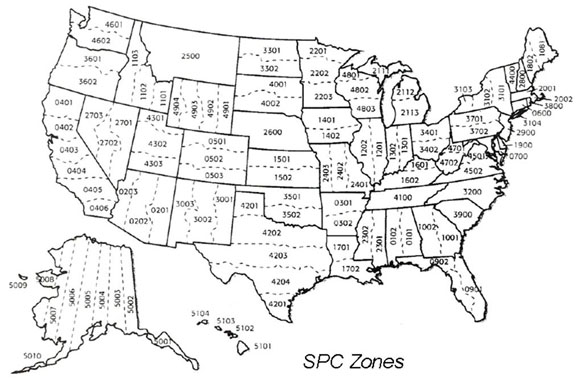 |
The State Plane Coordinate System (SPCS) with zone numbers |
In addition to each state being projected independently to reduce distortion, most of the states were actually broken down further, such as Colorado which contains three zones - Colorado North (0501), Colorado Central (0502), and Colorado South (0503). This means the distortion for each section is about as small as it can be. One thing to note is while distortion is reduced greatly for each zone, the inter-zone distortion can be greater then desired, especially when two neighboring states are created from two base projections.
Like UTM Universal Transverse Mercator , SPCS is a not a projection technically: the result of using one of variety of methods to transfer the geographic locations of features from a geographic coordinate system to a developable surface everyday use: any coordinate system, geographic or projected , but rather a planar coordinate system the result of converting an angular unit of measure used to locate objects on a geographic coordinate system to a linear unit of measure via a Cartesian Coordinate System. Planar Coordinate Systems utilize linear units such as feet, meters, and international feet. , utilizing a false origin originally located in Meades Ranch, Kansas (when the system was based on the North American Datum 1927 NAD27), and the idea of counting coordinates with a false easting and a false northing. With an effort to convert angular units of measure ( degrees measurement of plane angle, representing 1⁄360 of a full rotation (circle). In full, a degree of arc or arc degree. Usually denoted by ° ) into a Cartesian Coordinate System for ease of navigation, the SPCS was developed in 1930. Since then, the system has been revised a few times, most notably in 1983 after NAD83 was completed, and more recently, when the origin was moved to the center of the Earth to improve calculations when using the system with GPS Global Positioning System: A satellite-based navigation system owned and operated by the United States Department of Defense that provides location and time information anywhere on Earth. units. SPCS can be found in feet, meters, and international feet.
Also like UTM Universal Transverse Mercator , the idea of using a technique of projecting small sections and merging them together into a large network can be tough for a new GIS Geographic Information Systems the software used to create, store, and manage spatial data Data that deals with location, such as lists of addresses, the footprint of a building, the boundaries of cities and counties, etc. , analyze spatial problems, and display the data in cartographic layouts Geographic Information Sciences student, since the answer “What projection technically: the result of using one of variety of methods to transfer the geographic locations of features from a geographic coordinate system to a developable surface everyday use: any coordinate system, geographic or projected is your data in?” regarding data near Denver would be “SPCS Colorado Central (0502)”. SPCS is often used as a local projection technically: the result of using one of variety of methods to transfer the geographic locations of features from a geographic coordinate system to a developable surface everyday use: any coordinate system, geographic or projected (since each zone is based on a projection technically: the result of using one of variety of methods to transfer the geographic locations of features from a geographic coordinate system to a developable surface everyday use: any coordinate system, geographic or projected ), even though it is technically a planar coordinate system the result of converting an angular unit of measure used to locate objects on a geographic coordinate system to a linear unit of measure via a Cartesian Coordinate System. Planar Coordinate Systems utilize linear units such as feet, meters, and international feet. . Think about it this way: if you are working in Oregon and would like the data to be as exact as possible, you know that if you use Oregon North, the cone used in the projection technically: the result of using one of variety of methods to transfer the geographic locations of features from a geographic coordinate system to a developable surface everyday use: any coordinate system, geographic or projected was tangent to a line running through the center of the zone, vs a cone which was tangent thought the center of the United States for a continent-based projection technically: the result of using one of variety of methods to transfer the geographic locations of features from a geographic coordinate system to a developable surface everyday use: any coordinate system, geographic or projected . When the projection technically: the result of using one of variety of methods to transfer the geographic locations of features from a geographic coordinate system to a developable surface everyday use: any coordinate system, geographic or projected is designed for a smaller area, distortion is reduced, larger projections have the least amount of distortion along the tangential line, and increasing distortion from there. If your entire area is only a few hundred miles across, the distortion is negligible, and when the area is thousands of miles across, the distortion is noticeable.
Supported Projected Coordinate Systems
Open in a Separate Page| Name | WKID | Area of Use | Minimum Latitude | Minimum Longitude | Maximum Latitude | Maximum Longitude |
|---|---|---|---|---|---|---|
| Abidjan_1987_TM_5_NW | 2165 | Cote d'Ivoire (Ivory Coast) - offshore | 1.02 | -7.55 | 5.19 | -3.11 |
| Abidjan_1987_UTM_Zone_29N | 2043 | Cote d'Ivoire (Ivory Coast) - west of 6°W | 4.29 | -8.61 | 10.74 | -6 |
| Abidjan_1987_UTM_Zone_30N | 2041 | Cote d'Ivoire (Ivory Coast) - east of 6°W | 4.92 | -6 | 10.46 | -2.48 |
| AbInvA96_2020_Grid | 9387 | UK - Aberdeen to Inverness | 57.1 | -4.3 | 57.7 | -2.1 |
| Accra_Ghana_Grid | 2136 | Ghana - onshore | 4.67 | -3.25 | 11.16 | 1.23 |
| Accra_TM_1_NW | 2137 | Ghana - offshore | 1.4 | -3.79 | 6.06 | 2.1 |
| Adindan_UTM_Zone_35N | 20135 | Africa - South Sudan and Sudan - 24°E to 30°E | 4.21 | 23.99 | 22.01 | 30.01 |
| Adindan_UTM_Zone_36N | 20136 | Africa - Ethiopia and Sudan - 30°E to 36°E | 3.49 | 29.99 | 22.24 | 36 |
| Adindan_UTM_Zone_37N | 20137 | Africa - Eritrea, Ethiopia and Sudan - 36°E to 42°E | 3.4 | 36 | 22.01 | 42 |
| Adindan_UTM_Zone_38N | 20138 | Ethiopia - east of 42°E | 4.11 | 42 | 12.85 | 47.99 |
| Afgooye_UTM_Zone_38N | 20538 | Somalia - 42°E to 48°E, N hemisphere onshore | 0 | 42 | 11.52 | 48 |
| Afgooye_UTM_Zone_39N | 20539 | Somalia - onshore east of 48°E | 4.44 | 48 | 12.03 | 51.47 |
| Africa_Albers_Equal_Area_Conic | 102022 | Africa | -35 | -25 | 39 | 55 |
| Africa_Equidistant_Conic | 102023 | Africa | -35 | -25 | 39 | 55 |
| Africa_Lambert_Conformal_Conic | 102024 | Africa | -35 | -25 | 39 | 55 |
| Africa_Sinusoidal | 102011 | Africa | -35 | -25 | 39 | 55 |
| AGD_1966_ACT_Grid_AGC_Zone | 102071 | Australia - Australian Capital Territory | -35.93 | 148.76 | -35.12 | 149.4 |
| AGD_1966_ACT_Standard_Grid | 5825 | Australia - Australian Capital Territory | -35.93 | 148.76 | -35.12 | 149.4 |
| AGD_1966_AMG_Zone_48 | 20248 | Australia - 102°E to 108°E | -56 | 102 | -10 | 108 |
| AGD_1966_AMG_Zone_49 | 20249 | Australia - 108°E to 114°E (EEZ) | -37.84 | 109.23 | -17.19 | 114 |
| AGD_1966_AMG_Zone_50 | 20250 | Australia - 114°E to 120°E (EEZ) | -38.53 | 114 | -12.61 | 120 |
| AGD_1966_AMG_Zone_51 | 20251 | Australia - 120°E to 126°E | -38.07 | 120 | -10.46 | 126.01 |
| AGD_1966_AMG_Zone_52 | 20252 | Australia - 126°E to 132°E | -37.38 | 125.99 | -9.1 | 132 |
| AGD_1966_AMG_Zone_53 | 20253 | Australia - 132°E to 138°E | -40.71 | 132 | -8.88 | 138.01 |
| AGD_1966_AMG_Zone_54 | 20254 | Australasia - Australia and PNG - 138°E to 144°E | -46.63 | 138 | -2.53 | 144.01 |
| AGD_1966_AMG_Zone_55 | 20255 | Australasia - Australia and PNG - 144°E to 150°E | -47.2 | 144 | -1.3 | 150.01 |
| AGD_1966_AMG_Zone_56 | 20256 | Australasia - Australia and PNG - 150°E to 156°E | -46.44 | 150 | -2.32 | 156 |
| AGD_1966_AMG_Zone_57 | 20257 | Australia - 156°E to 162°E | -35.13 | 156 | -14.08 | 162.01 |
| AGD_1966_AMG_Zone_58 | 20258 | Australia - EEZ east of 162°E | -34.22 | 162 | -27.25 | 163.2 |
| AGD_1966_ISG_54_2 | 102072 | Australia - New South Wales - 140~E to 142~E (ISG 54/2) | -46.63 | 140 | -28.15 | 142 |
| AGD_1966_ISG_54_3 | 102073 | Australia - New South Wales - 142~E to 144~E (ISG 54/3) | -46.63 | 142 | -28.15 | 144 |
| AGD_1966_ISG_55_1 | 102074 | Australia - New South Wales - 144~E to 146~E (ISG 55/1) | -47.2 | 144 | -28.15 | 146 |
| AGD_1966_ISG_55_2 | 102075 | Australia - New South Wales - 146~E to 148~E (ISG 55/2) | -47.2 | 146 | -28.15 | 148 |
| AGD_1966_ISG_55_3 | 102076 | Australia - New South Wales - 148~E to 150~E (ISG 55/3) | -47.2 | 148 | -28.15 | 150 |
| AGD_1966_ISG_56_1 | 102077 | Australia - New South Wales - 150~E to 152~E (ISG 56/1) | -46.44 | 150 | -28.15 | 152 |
| AGD_1966_ISG_56_2 | 102078 | Australia - New South Wales - 152~E to 154~E (ISG 56/2) | -46.44 | 152 | -28.15 | 154 |
| AGD_1966_ISG_56_3 | 102079 | Australia - New South Wales - 154~E to 156~E (ISG 56/3) | -46.44 | 154 | -28.15 | 156 |
| AGD_1966_ISG_57_2 | 102961 | Australia - Lord Howe Island - 158~E to 160~E (ISG 57/2) | -47.2 | 158 | -28.15 | 160 |
| AGD_1966_VICGRID | 3110 | Australia - Victoria | -39.2 | 140.96 | -33.98 | 150.04 |
| AGD_1984_AMG_Zone_48 | 20348 | Australia - 102°E to 108°E | -56 | 102 | -10 | 108 |
| AGD_1984_AMG_Zone_49 | 20349 | Australia - 108°E to 114°E (EEZ) | -37.84 | 109.23 | -17.19 | 114 |
| AGD_1984_AMG_Zone_50 | 20350 | Australia - 114°E to 120°E (EEZ) | -38.53 | 114 | -12.61 | 120 |
| AGD_1984_AMG_Zone_51 | 20351 | Australia - 120°E to 126°E | -38.07 | 120 | -10.46 | 126.01 |
| AGD_1984_AMG_Zone_52 | 20352 | Australia - SA and WA 126°E to 132°E | -37.05 | 125.99 | -9.37 | 132.01 |
| AGD_1984_AMG_Zone_53 | 20353 | Australia - SA 132°E to 138°E | -36.14 | 132 | -25.99 | 138 |
| AGD_1984_AMG_Zone_54 | 20354 | Australia - SA and Qld 138°E to 144°E | -38.13 | 138 | -9.86 | 144.01 |
| AGD_1984_AMG_Zone_55 | 20355 | Australia - Qld 144°E to 150°E | -29.01 | 144 | -14.01 | 150 |
| AGD_1984_AMG_Zone_56 | 20356 | Australia - Qld east of 150°E | -29.19 | 150 | -22 | 153.61 |
| AGD_1984_AMG_Zone_57 | 20357 | Australia - 156°E to 162°E | -35.13 | 156 | -14.08 | 162.01 |
| AGD_1984_AMG_Zone_58 | 20358 | Australia - EEZ east of 162°E | -34.22 | 162 | -27.25 | 163.2 |
| Ain_el_Abd_1970_Aramco_Lambert_2 | 102204 | Saudi Arabia - onshore | 16.37 | 34.51 | 32.16 | 55.67 |
| Ain_el_Abd_Aramco_Lambert | 2318 | Saudi Arabia - onshore | 16.37 | 34.51 | 32.16 | 55.67 |
| Ain_el_Abd_UTM_Zone_36N | 20436 | Saudi Arabia - onshore west of 36°E | 26.82 | 34.51 | 29.38 | 36 |
| Ain_el_Abd_UTM_Zone_37N | 20437 | Saudi Arabia - onshore 36°E to 42°E | 16.59 | 36 | 32.16 | 42 |
| Ain_el_Abd_UTM_Zone_38N | 20438 | Asia - Middle East - Kuwait and Saudi - 42°E to 48°E | 16.37 | 42 | 31.15 | 48.01 |
| Ain_el_Abd_UTM_Zone_39N | 20439 | Asia - Middle East - Kuwait and Saudi - 48°E to 54°E | 17.94 | 47.99 | 30.04 | 54.01 |
| Ain_el_Abd_UTM_Zone_40N | 20440 | Saudi Arabia - east of 54°E | 19.66 | 54 | 22.77 | 55.67 |
| Albanian_1987_GK_Zone_4 | 2462 | Albania - onshore | 39.64 | 19.22 | 42.67 | 21.06 |
| American_Samoa_1962_StatePlane_ American_Samoa_FIPS_5300 | 65062 | American Samoa | -17.56 | -173.75 | -10.02 | -165.2 |
| American_Samoa_1962_UTM_Zone_2S | 102116 | American Samoa | -17.56 | -173.75 | -10.02 | -165.2 |
| Anguilla_1957_British_West_Indies_Grid | 2000 | Anguilla - onshore | 18.11 | -63.22 | 18.33 | -62.92 |
| Antigua_1943_British_West_Indies_Grid | 2001 | Antigua - onshore | 16.94 | -61.95 | 17.22 | -61.61 |
| Aratu_UTM_Zone_22S | 20822 | Brazil - 54°W to 48°W and Aratu | -35.71 | -53.38 | -25.01 | -47.99 |
| Aratu_UTM_Zone_23S | 20823 | Brazil - 48°W to 42°W and Aratu | -33.5 | -48.01 | 0 | -41.99 |
| Aratu_UTM_Zone_24S | 20824 | Brazil - 42°W to 36°W and Aratu | -26.35 | -42.01 | 0.01 | -36 |
| Aratu_UTM_Zone_25S | 5337 | Brazil - 36°W to 30°W offshore | -20.11 | -36 | 0 | -30 |
| Arc_1950_UTM_Zone_34S | 20934 | Africa - Botswana and Zambia - west of 24°E | -26.88 | 19.99 | -10.86 | 24 |
| Arc_1950_UTM_Zone_35S | 20935 | Africa - Botswana, Zambia and Zimbabwe - 24°E to 30°E | -25.84 | 24 | -8.31 | 30 |
| Arc_1950_UTM_Zone_36S | 20936 | Africa - Malawi, Zambia and Zimbabwe - east of 30°E | -22.42 | 30 | -8.19 | 35.93 |
| Arc_1960_UTM_Zone_35N | 21095 | Uganda - north of equator and west of 30°E | 0 | 29.71 | 0.86 | 30 |
| Arc_1960_UTM_Zone_35S | 21035 | Africa - Tanzania and Uganda - south of equator and west of 30°E | -6.81 | 29.34 | 0 | 30 |
| Arc_1960_UTM_Zone_36N | 21096 | Africa - Kenya and Uganda - north of equator and 30°E to 36°E | 0 | 29.99 | 4.63 | 36 |
| Arc_1960_UTM_Zone_36S | 21036 | Africa - Kenya, Tanzania and Uganda - south of equator and 30°E to 36°E | -11.61 | 29.99 | 0.01 | 36 |
| Arc_1960_UTM_Zone_37N | 21097 | Kenya - north of equator and east of 36°E | 0 | 36 | 4.49 | 41.91 |
| Arc_1960_UTM_Zone_37S | 21037 | Africa - Kenya and Tanzania - south of equator and east of 36°E | -11.75 | 36 | 0 | 41.6 |
| Argentina_Zone_1 | 22191 | Argentina - west of 70.5°W | -52 | -73.59 | -36.16 | -70.5 |
| Argentina_Zone_2 | 22192 | Argentina - 70.5°W to 67.5°W onshore | -54.9 | -70.5 | -24.08 | -67.49 |
| Argentina_Zone_3 | 22193 | Argentina - 67.5°W to 64.5°W onshore | -55.11 | -67.5 | -21.78 | -64.49 |
| Argentina_Zone_4 | 22194 | Argentina - 64.5°W to 61.5°W onshore | -54.91 | -64.5 | -21.99 | -61.5 |
| Argentina_Zone_5 | 22195 | Argentina - 61.5°W to 58.5°W onshore | -39.06 | -61.51 | -23.37 | -58.5 |
| Argentina_Zone_6 | 22196 | Argentina - 58.5°W to 55.5°W onshore | -38.59 | -58.5 | -24.84 | -55.49 |
| Argentina_Zone_7 | 22197 | Argentina - east of 55.5°W onshore | -28.11 | -55.5 | -25.49 | -53.65 |
| Asia_Lambert_Conformal_Conic | 102012 | Asia | -10 | 25 | 85 | 185 |
| Asia_North_Albers_Equal_Area_Conic | 102025 | Asia - North | 10 | 25 | 85 | 185 |
| Asia_North_Equidistant_Conic | 102026 | Asia - North | 10 | 25 | 85 | 185 |
| Asia_North_Lambert_Conformal_Conic | 102027 | Asia - North | 10 | 25 | 85 | 185 |
| Asia_South_Albers_Equal_Area_Conic | 102028 | Asia - South | -10 | 25 | 30 | 165 |
| Asia_South_Equidistant_Conic | 102029 | Asia - South | -10 | 25 | 30 | 165 |
| Asia_South_Lambert_Conformal_Conic | 102030 | Asia - South | -10 | 25 | 30 | 165 |
| Astro_DOS_71_4_SHLG71 | 7877 | St Helena - St Helena Island | -16.08 | -5.85 | -15.85 | -5.58 |
| Astro_DOS_71_4_UTM_zone_30S | 7878 | St Helena - St Helena Island | -16.08 | -5.85 | -15.85 | -5.58 |
| ATS_1977_MTM_4_Nova_Scotia | 2294 | Canada - Nova Scotia - east of 63°W | 44.64 | -63 | 47.08 | -59.73 |
| ATS_1977_MTM_5_Nova_Scotia | 2295 | Canada - Nova Scotia - west of 63°W | 43.41 | -66.28 | 46.02 | -63 |
| ATS_1977_New_Brunswick_ Stereographic | 2200 | Canada - New Brunswick | 44.56 | -69.05 | 48.07 | -63.7 |
| ATS_1977_UTM_Zone_19N | 2219 | Canada - Maritime Provinces - west of 66°W | 43.64 | -69 | 48.07 | -66 |
| ATS_1977_UTM_Zone_20N | 2220 | Canada - Maritime Provinces - east of 66°W | 43.41 | -66 | 47.98 | -59.73 |
| Austria_Central_Zone | 31282 | Austria - 11°50'E to 14°50'E | 46.4 | 11.83 | 48.79 | 14.84 |
| Austria_East_Zone | 31283 | Austria - east of 14°50'E | 46.56 | 14.83 | 49.02 | 17.17 |
| Austria_West_Zone | 31281 | Austria - west of 11°50'E | 46.77 | 9.53 | 47.61 | 11.84 |
| Azores_Central_1948_UTM_Zone_26N | 2189 | Portugal - Azores C - onshore | 38.32 | -28.9 | 39.14 | -26.97 |
| Azores_Central_1995_UTM_Zone_26N | 3063 | Portugal - Azores C - onshore | 38.32 | -28.9 | 39.14 | -26.97 |
| Azores_Occidental_1939_UTM_Zone_25 N | 2188 | Portugal - Azores W - onshore | 39.3 | -31.34 | 39.77 | -31.02 |
| Azores_Oriental_1940_UTM_Zone_26N | 2190 | Portugal - Azores E - onshore | 36.87 | -25.92 | 37.96 | -24.62 |
| Azores_Oriental_1995_UTM_Zone_26N | 3062 | Portugal - Azores E - onshore | 36.87 | -25.92 | 37.96 | -24.62 |
| Bab_South_Palau_Azimuthal_Equidistant | 102096 | Palau | 1.64 | 129.48 | 11.45 | 136.98 |
| Bahrain_State_Grid | 20499 | Bahrain - onshore | 25.53 | 50.39 | 26.34 | 50.85 |
| Barbados_1938_Barbados_Grid | 21292 | Barbados - onshore | 13 | -59.71 | 13.39 | -59.37 |
| Barbados_1938_British_West_Indies_ Grid | 21291 | Barbados - onshore | 13 | -59.71 | 13.39 | -59.37 |
| Batavia_Jakarta_NEIEZ | 5330 | Indonesia - Bali, Java and western Sumatra onshore | -8.91 | 95.16 | 5.97 | 115.77 |
| Batavia_NEIEZ | 3001 | Indonesia - Bali, Java and western Sumatra onshore | -8.91 | 95.16 | 5.97 | 115.77 |
| Batavia_TM_109_SE | 2308 | Indonesia - Java Sea - offshore northwest Java | -6.89 | 105.77 | -4.07 | 110.01 |
| Batavia_UTM_Zone_48S | 21148 | Indonesia - Java and Java Sea - west of 108°E | -7.79 | 105.06 | -4.07 | 108 |
| Batavia_UTM_Zone_49S | 21149 | Indonesia - Java and Java Sea - 108°E to 114°E | -8.67 | 108 | -4.27 | 114 |
| Batavia_UTM_Zone_50S | 21150 | Indonesia - Java and Java Sea - east of 114°E | -8.91 | 114 | -5.33 | 117.01 |
| Beduaram_TM_13_NE | 2931 | Niger - southeast | 12.8 | 7.81 | 16.7 | 14.9 |
| Beijing_1954_3_Degree_GK_CM_102E | 2431 | China - 100.5°E to 103.5°E | 21.13 | 100.5 | 42.69 | 103.5 |
| Beijing_1954_3_Degree_GK_CM_105E | 2432 | China - 103.5°E to 106.5°E | 22.5 | 103.5 | 42.21 | 106.51 |
| Beijing_1954_3_Degree_GK_CM_108E | 2433 | China - 106.5°E to 109.5°E onshore | 18.19 | 106.5 | 42.47 | 109.51 |
| Beijing_1954_3_Degree_GK_CM_111E | 2434 | China - 109.5°E to 112.5°E onshore | 18.11 | 109.5 | 45.11 | 112.5 |
| Beijing_1954_3_Degree_GK_CM_114E | 2435 | China - 112.5°E to 115.5°E onshore | 21.52 | 112.5 | 45.45 | 115.5 |
| Beijing_1954_3_Degree_GK_CM_117E | 2436 | China - 115.5°E to 118.5°E onshore | 22.6 | 115.5 | 49.88 | 118.5 |
| Beijing_1954_3_Degree_GK_CM_120E | 2437 | China - 118.5°E to 121.5°E onshore | 24.43 | 118.5 | 53.33 | 121.5 |
| Beijing_1954_3_Degree_GK_CM_123E | 2438 | China - 121.5°E to 124.5°E onshore | 28.22 | 121.5 | 53.56 | 124.5 |
| Beijing_1954_3_Degree_GK_CM_126E | 2439 | China - 124.5°E to 127.5°E onshore | 40.19 | 124.5 | 53.2 | 127.5 |
| Beijing_1954_3_Degree_GK_CM_129E | 2440 | China - 127.5°E to 130.5°E | 41.37 | 127.5 | 50.25 | 130.5 |
| Beijing_1954_3_Degree_GK_CM_132E | 2441 | China - 130.5°E to 133.5°E | 42.42 | 130.5 | 48.88 | 133.5 |
| Beijing_1954_3_Degree_GK_CM_135E | 2442 | China - east of 133.5°E | 45.85 | 133.5 | 48.4 | 134.77 |
| Beijing_1954_3_Degree_GK_CM_75E | 2422 | China - west of 76.5°E | 35.81 | 73.62 | 40.65 | 76.5 |
| Beijing_1954_3_Degree_GK_CM_78E | 2423 | China - 76.5°E to 79.5°E | 31.03 | 76.5 | 41.83 | 79.5 |
| Beijing_1954_3_Degree_GK_CM_81E | 2424 | China - 79.5°E to 82.5°E | 29.95 | 79.5 | 45.88 | 82.51 |
| Beijing_1954_3_Degree_GK_CM_84E | 2425 | China - 82.5°E to 85.5°E | 28.26 | 82.5 | 47.23 | 85.5 |
| Beijing_1954_3_Degree_GK_CM_87E | 2426 | China - 85.5°E to 88.5°E | 27.8 | 85.5 | 49.18 | 88.5 |
| Beijing_1954_3_Degree_GK_CM_90E | 2427 | China - 88.5°E to 91.5°E | 27.32 | 88.49 | 48.42 | 91.51 |
| Beijing_1954_3_Degree_GK_CM_93E | 2428 | China - 91.5°E to 94.5°E | 27.71 | 91.5 | 45.13 | 94.5 |
| Beijing_1954_3_Degree_GK_CM_96E | 2429 | China - 94.5°E to 97.5°E | 28.23 | 94.5 | 44.5 | 97.51 |
| Beijing_1954_3_Degree_GK_CM_99E | 2430 | China - 97.5°E to 100.5°E | 21.43 | 97.5 | 42.76 | 100.5 |
| Beijing_1954_3_Degree_GK_Zone_25 | 2401 | China - west of 76.5°E | 35.81 | 73.62 | 40.65 | 76.5 |
| Beijing_1954_3_Degree_GK_Zone_26 | 2402 | China - 76.5°E to 79.5°E | 31.03 | 76.5 | 41.83 | 79.5 |
| Beijing_1954_3_Degree_GK_Zone_27 | 2403 | China - 79.5°E to 82.5°E | 29.95 | 79.5 | 45.88 | 82.51 |
| Beijing_1954_3_Degree_GK_Zone_28 | 2404 | China - 82.5°E to 85.5°E | 28.26 | 82.5 | 47.23 | 85.5 |
| Beijing_1954_3_Degree_GK_Zone_29 | 2405 | China - 85.5°E to 88.5°E | 27.8 | 85.5 | 49.18 | 88.5 |
| Beijing_1954_3_Degree_GK_Zone_30 | 2406 | China - 88.5°E to 91.5°E | 27.32 | 88.49 | 48.42 | 91.51 |
| Beijing_1954_3_Degree_GK_Zone_31 | 2407 | China - 91.5°E to 94.5°E | 27.71 | 91.5 | 45.13 | 94.5 |
| Beijing_1954_3_Degree_GK_Zone_32 | 2408 | China - 94.5°E to 97.5°E | 28.23 | 94.5 | 44.5 | 97.51 |
| Beijing_1954_3_Degree_GK_Zone_33 | 2409 | China - 97.5°E to 100.5°E | 21.43 | 97.5 | 42.76 | 100.5 |
| Beijing_1954_3_Degree_GK_Zone_34 | 2410 | China - 100.5°E to 103.5°E | 21.13 | 100.5 | 42.69 | 103.5 |
| Beijing_1954_3_Degree_GK_Zone_35 | 2411 | China - 103.5°E to 106.5°E | 22.5 | 103.5 | 42.21 | 106.51 |
| Beijing_1954_3_Degree_GK_Zone_36 | 2412 | China - 106.5°E to 109.5°E onshore | 18.19 | 106.5 | 42.47 | 109.51 |
| Beijing_1954_3_Degree_GK_Zone_37 | 2413 | China - 109.5°E to 112.5°E onshore | 18.11 | 109.5 | 45.11 | 112.5 |
| Beijing_1954_3_Degree_GK_Zone_38 | 2414 | China - 112.5°E to 115.5°E onshore | 21.52 | 112.5 | 45.45 | 115.5 |
| Beijing_1954_3_Degree_GK_Zone_39 | 2415 | China - 115.5°E to 118.5°E onshore | 22.6 | 115.5 | 49.88 | 118.5 |
| Beijing_1954_3_Degree_GK_Zone_40 | 2416 | China - 118.5°E to 121.5°E onshore | 24.43 | 118.5 | 53.33 | 121.5 |
| Beijing_1954_3_Degree_GK_Zone_41 | 2417 | China - 121.5°E to 124.5°E onshore | 28.22 | 121.5 | 53.56 | 124.5 |
| Beijing_1954_3_Degree_GK_Zone_42 | 2418 | China - 124.5°E to 127.5°E onshore | 40.19 | 124.5 | 53.2 | 127.5 |
| Beijing_1954_3_Degree_GK_Zone_43 | 2419 | China - 127.5°E to 130.5°E | 41.37 | 127.5 | 50.25 | 130.5 |
| Beijing_1954_3_Degree_GK_Zone_44 | 2420 | China - 130.5°E to 133.5°E | 42.42 | 130.5 | 48.88 | 133.5 |
| Beijing_1954_3_Degree_GK_Zone_45 | 2421 | China - east of 133.5°E | 45.85 | 133.5 | 48.4 | 134.77 |
| Beijing_1954_Gauss_Kruger_CM_105E | 21458 | China - 102°E to 108°E onshore | 21.53 | 102 | 42.47 | 108 |
| Beijing_1954_Gauss_Kruger_CM_111E | 21459 | China - 108°E to 114°E onshore | 18.11 | 108 | 45.11 | 114 |
| Beijing_1954_Gauss_Kruger_CM_117E | 21460 | China - 114°E to 120°E onshore | 22.14 | 114 | 51.52 | 120 |
| Beijing_1954_Gauss_Kruger_CM_123E | 21461 | China - 120°E to 126°E onshore | 26.34 | 120 | 53.56 | 126 |
| Beijing_1954_Gauss_Kruger_CM_129E | 21462 | China - 126°E to 132°E onshore | 40.89 | 126 | 52.79 | 132 |
| Beijing_1954_Gauss_Kruger_CM_135E | 21463 | China - east of 132°E | 45.02 | 132 | 48.4 | 134.77 |
| Beijing_1954_Gauss_Kruger_CM_75E | 21453 | China - west of 78°E | 35.42 | 73.62 | 41.07 | 78.01 |
| Beijing_1954_Gauss_Kruger_CM_81E | 21454 | China - 78°E to 84°E | 29.16 | 77.98 | 47.23 | 84 |
| Beijing_1954_Gauss_Kruger_CM_87E | 21455 | China - 84°E to 90°E | 27.32 | 84 | 49.18 | 90 |
| Beijing_1954_Gauss_Kruger_CM_93E | 21456 | China - 90°E to 96°E | 27.71 | 90 | 47.9 | 96.01 |
| Beijing_1954_Gauss_Kruger_CM_99E | 21457 | China - 96°E to 102°E | 21.13 | 96 | 43.18 | 102.01 |
| Beijing_1954_GK_Zone_13 | 21413 | China - west of 78°E | 35.42 | 73.62 | 41.07 | 78.01 |
| Beijing_1954_GK_Zone_13N | 21473 | China - west of 78°E | 35.42 | 73.62 | 41.07 | 78.01 |
| Beijing_1954_GK_Zone_14 | 21414 | China - 78°E to 84°E | 29.16 | 77.98 | 47.23 | 84 |
| Beijing_1954_GK_Zone_14N | 21474 | China - 78°E to 84°E | 29.16 | 77.98 | 47.23 | 84 |
| Beijing_1954_GK_Zone_15 | 21415 | China - 84°E to 90°E | 27.32 | 84 | 49.18 | 90 |
| Beijing_1954_GK_Zone_15N | 21475 | China - 84°E to 90°E | 27.32 | 84 | 49.18 | 90 |
| Beijing_1954_GK_Zone_16 | 21416 | China - 90°E to 96°E | 27.71 | 90 | 47.9 | 96.01 |
| Beijing_1954_GK_Zone_16N | 21476 | China - 90°E to 96°E | 27.71 | 90 | 47.9 | 96.01 |
| Beijing_1954_GK_Zone_17 | 21417 | China - 96°E to 102°E | 21.13 | 96 | 43.18 | 102.01 |
| Beijing_1954_GK_Zone_17N | 21477 | China - 96°E to 102°E | 21.13 | 96 | 43.18 | 102.01 |
| Beijing_1954_GK_Zone_18 | 21418 | China - 102°E to 108°E onshore | 21.53 | 102 | 42.47 | 108 |
| Beijing_1954_GK_Zone_18N | 21478 | China - 102°E to 108°E onshore | 21.53 | 102 | 42.47 | 108 |
| Beijing_1954_GK_Zone_19 | 21419 | China - 108°E to 114°E onshore | 18.11 | 108 | 45.11 | 114 |
| Beijing_1954_GK_Zone_19N | 21479 | China - 108°E to 114°E onshore | 18.11 | 108 | 45.11 | 114 |
| Beijing_1954_GK_Zone_20 | 21420 | China - 114°E to 120°E onshore | 22.14 | 114 | 51.52 | 120 |
| Beijing_1954_GK_Zone_20N | 21480 | China - 114°E to 120°E onshore | 22.14 | 114 | 51.52 | 120 |
| Beijing_1954_GK_Zone_21 | 21421 | China - 120°E to 126°E onshore | 26.34 | 120 | 53.56 | 126 |
| Beijing_1954_GK_Zone_21N | 21481 | China - 120°E to 126°E onshore | 26.34 | 120 | 53.56 | 126 |
| Beijing_1954_GK_Zone_22 | 21422 | China - 126°E to 132°E onshore | 40.89 | 126 | 52.79 | 132 |
| Beijing_1954_GK_Zone_22N | 21482 | China - 126°E to 132°E onshore | 40.89 | 126 | 52.79 | 132 |
| Beijing_1954_GK_Zone_23 | 21423 | China - east of 132°E | 45.02 | 132 | 48.4 | 134.77 |
| Beijing_1954_GK_Zone_23N | 21483 | China - east of 132°E | 45.02 | 132 | 48.4 | 134.77 |
| Belge_Lambert_1950 | 21500 | Belgium - onshore | 49.5 | 2.5 | 51.51 | 6.4 |
| Belge_Lambert_1972 | 31370 | Belgium - onshore | 49.5 | 2.5 | 51.51 | 6.4 |
| Belge_Lambert_1972_bad_FE_FN | 102499 | Belgium - onshore | 49.5 | 2.5 | 51.51 | 6.4 |
| Belge_Lambert_2005 | 3447 | Belgium - onshore | 49.5 | 2.5 | 51.51 | 6.4 |
| Belge_Lambert_2008 | 3812 | Belgium - onshore | 49.5 | 2.5 | 51.51 | 6.4 |
| Berghaus_Star_AAG | 102299 | World | -90 | -180 | 90 | 180 |
| Bermuda_1957_UTM_Zone_20N | 3769 | Bermuda - onshore | 32.21 | -64.89 | 32.43 | -64.61 |
| Bermuda_2000_National_Grid | 3770 | Bermuda | 28.91 | -68.83 | 35.73 | -60.7 |
| Bern_1898_Bern_LV03C | 21780 | Europe - Liechtenstein and Switzerland | 45.82 | 5.96 | 47.81 | 10.49 |
| BGS2005_CCS2005 | 7801 | Bulgaria - onshore | 41.24 | 22.36 | 44.23 | 28.68 |
| BGS2005_UTM_zone_34N | 7803 | Bulgaria - west of 24°E | 41.32 | 22.36 | 44.23 | 24 |
| BGS2005_UTM_zone_34N_(N-E) | 7799 | Bulgaria - west of 24°E | 41.32 | 22.36 | 44.23 | 24 |
| BGS2005_UTM_zone_35N | 7804 | Bulgaria - 24°E to 30°E | 41.24 | 24 | 44.15 | 30.01 |
| BGS2005_UTM_zone_35N_(N-E) | 7800 | Bulgaria - 24°E to 30°E | 41.24 | 24 | 44.15 | 30.01 |
| BGS2005_UTM_zone_36N | 7805 | Bulgaria - east of 30°E | 42.56 | 30 | 43.67 | 31.35 |
| Bissau_UTM_Zone_28N | 2095 | Guinea-Bissau - onshore | 10.87 | -16.77 | 12.69 | -13.64 |
| Bogota_Ciudad_Bogota | 102232 | Colombia region 8 | -4.23 | -74.4 | 7.1 | -66.87 |
| Bogota_UTM_Zone_17N | 21817 | Colombia - west of 75°35'W | 0.03 | -79.1 | 10.21 | -75.58 |
| Bogota_UTM_Zone_18N | 21818 | Colombia - offshore Caribbean west of 72°W | 7.9 | -77.37 | 13.68 | -72 |
| British_National_Grid | 27700 | UK - Britain and UKCS 49°46'N to 61°01'N, 7°33'W to 3°33'E | 49.75 | -9.2 | 61.14 | 2.88 |
| BUTM2010 | 102954 | Bangladesh | 18.56 | 88.01 | 26.64 | 92.67 |
| Cadastre_1997_UTM_Zone_38S | 5879 | Mayotte - onshore | -13.05 | 44.98 | -12.61 | 45.35 |
| Camacupa_TM_11_30_SE | 22091 | Angola - offshore block 15 | -6.59 | 10.83 | -6.03 | 11.67 |
| Camacupa_TM_12_SE | 22092 | Angola - Angola proper - offshore | -17.26 | 8.2 | -6.01 | 13.86 |
| Camacupa_UTM_Zone_32S | 22032 | Angola - Angola proper - offshore - west of 12°E | -17.26 | 8.2 | -6.03 | 12 |
| Camacupa_UTM_Zone_33S | 22033 | Angola - Angola proper - 12°E to 18°E | -17.44 | 12 | -5.82 | 18 |
| Campo_Inchauspe_UTM_19S | 2315 | Argentina - Tierra del Fuego offshore west of 66°W | -54.61 | -68.62 | -51.65 | -66 |
| Campo_Inchauspe_UTM_20S | 2316 | Argentina - Tierra del Fuego offshore east of 66°W | -54.93 | -66 | -51.36 | -61.49 |
| Canada_Albers_Equal_Area_Conic | 102001 | Canada | 38.21 | -141.01 | 86.46 | -40.73 |
| Canada_Lambert_Conformal_Conic | 102002 | Canada | 38.21 | -141.01 | 86.46 | -40.73 |
| Cape_Lo15 | 102470 | Namibia - Walvis Bay | -23.15 | 14.35 | -22.68 | 14.6 |
| Cape_Lo17 | 102471 | South Africa - west of 18°E | -33.1 | 16.45 | -28.03 | 18 |
| Cape_Lo19 | 102472 | South Africa - 18°E to 20°E | -34.88 | 17.99 | -28.38 | 20 |
| Cape_Lo21 | 102473 | South Africa - 20°E to 22°E | -34.88 | 19.99 | -24.76 | 22.01 |
| Cape_Lo23 | 102474 | South Africa - 22°E to 24°E | -34.26 | 22 | -25.26 | 24.01 |
| Cape_Lo25 | 102475 | South Africa - 24°E to 26°E | -34.26 | 24 | -24.71 | 26.01 |
| Cape_Lo27 | 102476 | South Africa - 26°E to 28°E | -33.83 | 26 | -22.92 | 28 |
| Cape_Lo29 | 102477 | South Africa - 28°E to 30°E | -33.03 | 27.99 | -22.13 | 30 |
| Cape_Lo31 | 102478 | South Africa - 30°E to 32°E | -31.38 | 29.99 | -22.22 | 32.02 |
| Cape_Lo33 | 102479 | South Africa - east of 32°E | -28.94 | 31.95 | -26.8 | 32.95 |
| Cape_UTM_Zone_34S | 22234 | Botswana - west of 24°E | -26.88 | 19.99 | -17.99 | 24 |
| Cape_UTM_Zone_35S | 22235 | Botswana - east of 24°E | -25.84 | 24 | -17.78 | 29.38 |
| Cape_UTM_Zone_36S | 22236 | Botswana - 21°E to 27°E | -26.88 | 21 | -17.78 | 27 |
| Carthage_TM_11_NE | 2088 | Tunisia - offshore | 33.22 | 7.81 | 38.41 | 13.67 |
| Carthage_UTM_Zone_32N | 22332 | Tunisia - offshore | 33.22 | 7.81 | 38.41 | 13.67 |
| Cassini_Bangladesh_Zone_01_Dinajpur | 102934 | Bangladesh - Dinajpur | 25.217 | 88.083 | 26.633 | 89.3 |
| Cassini_Bangladesh_Zone_02_Rangpur | 102935 | Bangladesh - Rangpur | 25.033 | 88.9 | 26.45 | 89.883 |
| Cassini_Bangladesh_Zone_03_Rajshahi | 102936 | Bangladesh - Rajshahi | 24.1 | 88 | 25.2 | 89.333 |
| Cassini_Bangladesh_Zone_04_Bogura | 102937 | Bangladesh - Bogura | 24.533 | 88.917 | 25.267 | 89.75 |
| Cassini_Bangladesh_Zone_05_Pabna | 102938 | Bangladesh - Pabna | 23.8 | 88.983 | 24.767 | 89.817 |
| Cassini_Bangladesh_Zone_06_ Mymensingh | 102939 | Bangladesh - Mymensingh | 23.95 | 89.633 | 24.433 | 91.25 |
| Cassini_Bangladesh_Zone_07_Dhaka | 102940 | Bangladesh - Dhaka | 23.367 | 89.683 | 24.333 | 90.983 |
| Cassini_Bangladesh_Zone_08_Faridpur | 102941 | Bangladesh - Faridpur | 22.833 | 89.283 | 23.9 | 89.583 |
| Cassini_Bangladesh_Zone_09_Sylhet | 102942 | Bangladesh - Sylhet | 23.967 | 90.917 | 25.2 | 92.483 |
| Cassini_Bangladesh_Zone_10_Kushtia | 102943 | Bangladesh - Kushtia | 23.367 | 88.55 | 24.217 | 89.35 |
| Cassini_Bangladesh_Zone_11_Joshore | 102944 | Bangladesh - Joshore | 22.783 | 88.683 | 23.767 | 89.8 |
| Cassini_Bangladesh_Zone_12_Khulna | 102945 | Bangladesh - Khulna | 21.633 | 88.883 | 23 | 89.95 |
| Cassini_Bangladesh_Zone_13_Barishal | 102946 | Bangladesh - Barishal | 21.783 | 89.85 | 23.067 | 91.033 |
| Cassini_Bangladesh_Zone_14_Cumilla | 102947 | Bangladesh - Cumilla | 22.967 | 90.517 | 24.267 | 91.367 |
| Cassini_Bangladesh_Zone_15_Noakhali | 102948 | Bangladesh - Noakhali | 22.017 | 90.65 | 23.283 | 91.567 |
| Cassini_Bangladesh_Zone_16_ Chottogram | 102949 | Bangladesh - Chottogram | 20.583 | 91.3 | 22.983 | 92.367 |
| Cassini_Bangladesh_Zone_17_CHT | 102950 | Bangladesh - CHT | 21.183 | 91.7 | 23.733 | 92.667 |
| Cayman_Islands_National_Grid_2011 | 6391 | Cayman Islands | 17.58 | -83.6 | 20.68 | -78.72 |
| CGCS2000_3_Degree_GK_CM_102E | 4543 | China - 100.5°E to 103.5°E | 21.13 | 100.5 | 42.69 | 103.5 |
| CGCS2000_3_Degree_GK_CM_105E | 4544 | China - 103.5°E to 106.5°E | 22.5 | 103.5 | 42.21 | 106.51 |
| CGCS2000_3_Degree_GK_CM_108E | 4545 | China - 106.5°E to 109.5°E onshore | 18.19 | 106.5 | 42.47 | 109.51 |
| CGCS2000_3_Degree_GK_CM_111E | 4546 | China - 109.5°E to 112.5°E onshore | 18.11 | 109.5 | 45.11 | 112.5 |
| CGCS2000_3_Degree_GK_CM_114E | 4547 | China - 112.5°E to 115.5°E onshore | 21.52 | 112.5 | 45.45 | 115.5 |
| CGCS2000_3_Degree_GK_CM_117E | 4548 | China - 115.5°E to 118.5°E onshore | 22.6 | 115.5 | 49.88 | 118.5 |
| CGCS2000_3_Degree_GK_CM_120E | 4549 | China - 118.5°E to 121.5°E onshore | 24.43 | 118.5 | 53.33 | 121.5 |
| CGCS2000_3_Degree_GK_CM_123E | 4550 | China - 121.5°E to 124.5°E onshore | 28.22 | 121.5 | 53.56 | 124.5 |
| CGCS2000_3_Degree_GK_CM_126E | 4551 | China - 124.5°E to 127.5°E onshore | 40.19 | 124.5 | 53.2 | 127.5 |
| CGCS2000_3_Degree_GK_CM_129E | 4552 | China - 127.5°E to 130.5°E | 41.37 | 127.5 | 50.25 | 130.5 |
| CGCS2000_3_Degree_GK_CM_132E | 4553 | China - 130.5°E to 133.5°E | 42.42 | 130.5 | 48.88 | 133.5 |
| CGCS2000_3_Degree_GK_CM_135E | 4554 | China - east of 133.5°E | 45.85 | 133.5 | 48.4 | 134.77 |
| CGCS2000_3_Degree_GK_CM_75E | 4534 | China - west of 76.5°E | 35.81 | 73.62 | 40.65 | 76.5 |
| CGCS2000_3_Degree_GK_CM_78E | 4535 | China - 76.5°E to 79.5°E | 31.03 | 76.5 | 41.83 | 79.5 |
| CGCS2000_3_Degree_GK_CM_81E | 4536 | China - 79.5°E to 82.5°E | 29.95 | 79.5 | 45.88 | 82.51 |
| CGCS2000_3_Degree_GK_CM_84E | 4537 | China - 82.5°E to 85.5°E | 28.26 | 82.5 | 47.23 | 85.5 |
| CGCS2000_3_Degree_GK_CM_87E | 4538 | China - 85.5°E to 88.5°E | 27.8 | 85.5 | 49.18 | 88.5 |
| CGCS2000_3_Degree_GK_CM_90E | 4539 | China - 88.5°E to 91.5°E | 27.32 | 88.49 | 48.42 | 91.51 |
| CGCS2000_3_Degree_GK_CM_93E | 4540 | China - 91.5°E to 94.5°E | 27.71 | 91.5 | 45.13 | 94.5 |
| CGCS2000_3_Degree_GK_CM_96E | 4541 | China - 94.5°E to 97.5°E | 28.23 | 94.5 | 44.5 | 97.51 |
| CGCS2000_3_Degree_GK_CM_99E | 4542 | China - 97.5°E to 100.5°E | 21.43 | 97.5 | 42.76 | 100.5 |
| CGCS2000_3_Degree_GK_Zone_25 | 4513 | China - west of 76.5°E | 35.81 | 73.62 | 40.65 | 76.5 |
| CGCS2000_3_Degree_GK_Zone_26 | 4514 | China - 76.5°E to 79.5°E | 31.03 | 76.5 | 41.83 | 79.5 |
| CGCS2000_3_Degree_GK_Zone_27 | 4515 | China - 79.5°E to 82.5°E | 29.95 | 79.5 | 45.88 | 82.51 |
| CGCS2000_3_Degree_GK_Zone_28 | 4516 | China - 82.5°E to 85.5°E | 28.26 | 82.5 | 47.23 | 85.5 |
| CGCS2000_3_Degree_GK_Zone_29 | 4517 | China - 85.5°E to 88.5°E | 27.8 | 85.5 | 49.18 | 88.5 |
| CGCS2000_3_Degree_GK_Zone_30 | 4518 | China - 88.5°E to 91.5°E | 27.32 | 88.49 | 48.42 | 91.51 |
| CGCS2000_3_Degree_GK_Zone_31 | 4519 | China - 91.5°E to 94.5°E | 27.71 | 91.5 | 45.13 | 94.5 |
| CGCS2000_3_Degree_GK_Zone_32 | 4520 | China - 94.5°E to 97.5°E | 28.23 | 94.5 | 44.5 | 97.51 |
| CGCS2000_3_Degree_GK_Zone_33 | 4521 | China - 97.5°E to 100.5°E | 21.43 | 97.5 | 42.76 | 100.5 |
| CGCS2000_3_Degree_GK_Zone_34 | 4522 | China - 100.5°E to 103.5°E | 21.13 | 100.5 | 42.69 | 103.5 |
| CGCS2000_3_Degree_GK_Zone_35 | 4523 | China - 103.5°E to 106.5°E | 22.5 | 103.5 | 42.21 | 106.51 |
| CGCS2000_3_Degree_GK_Zone_36 | 4524 | China - 106.5°E to 109.5°E onshore | 18.19 | 106.5 | 42.47 | 109.51 |
| CGCS2000_3_Degree_GK_Zone_37 | 4525 | China - 109.5°E to 112.5°E onshore | 18.11 | 109.5 | 45.11 | 112.5 |
| CGCS2000_3_Degree_GK_Zone_38 | 4526 | China - 112.5°E to 115.5°E onshore | 21.52 | 112.5 | 45.45 | 115.5 |
| CGCS2000_3_Degree_GK_Zone_39 | 4527 | China - 115.5°E to 118.5°E onshore | 22.6 | 115.5 | 49.88 | 118.5 |
| CGCS2000_3_Degree_GK_Zone_40 | 4528 | China - 118.5°E to 121.5°E onshore | 24.43 | 118.5 | 53.33 | 121.5 |
| CGCS2000_3_Degree_GK_Zone_41 | 4529 | China - 121.5°E to 124.5°E onshore | 28.22 | 121.5 | 53.56 | 124.5 |
| CGCS2000_3_Degree_GK_Zone_42 | 4530 | China - 124.5°E to 127.5°E onshore | 40.19 | 124.5 | 53.2 | 127.5 |
| CGCS2000_3_Degree_GK_Zone_43 | 4531 | China - 127.5°E to 130.5°E | 41.37 | 127.5 | 50.25 | 130.5 |
| CGCS2000_3_Degree_GK_Zone_44 | 4532 | China - 130.5°E to 133.5°E | 42.42 | 130.5 | 48.88 | 133.5 |
| CGCS2000_3_Degree_GK_Zone_45 | 4533 | China - east of 133.5°E | 45.85 | 133.5 | 48.4 | 134.77 |
| CGCS2000_GK_CM_105E | 4507 | China - 102°E to 108°E | 17.75 | 102 | 42.47 | 108 |
| CGCS2000_GK_CM_111E | 4508 | China - 108°E to 114°E | 16.7 | 108 | 45.11 | 114 |
| CGCS2000_GK_CM_117E | 4509 | China - 114°E to 120°E | 19.02 | 114 | 51.52 | 120 |
| CGCS2000_GK_CM_123E | 4510 | China - 120°E to 126°E | 24.64 | 120 | 53.56 | 126 |
| CGCS2000_GK_CM_129E | 4511 | China - 126°E to 132°E | 29.7 | 126 | 52.79 | 132 |
| CGCS2000_GK_CM_135E | 4512 | China - east of 132°E | 45.02 | 132 | 48.4 | 134.77 |
| CGCS2000_GK_CM_75E | 4502 | China - west of 78°E | 35.42 | 73.62 | 41.07 | 78.01 |
| CGCS2000_GK_CM_81E | 4503 | China - 78°E to 84°E | 29.16 | 77.98 | 47.23 | 84 |
| CGCS2000_GK_CM_87E | 4504 | China - 84°E to 90°E | 27.32 | 84 | 49.18 | 90 |
| CGCS2000_GK_CM_93E | 4505 | China - 90°E to 96°E | 27.71 | 90 | 47.9 | 96.01 |
| CGCS2000_GK_CM_99E | 4506 | China - 96°E to 102°E | 21.13 | 96 | 43.18 | 102.01 |
| CGCS2000_GK_Zone_13 | 4491 | China - west of 78°E | 35.42 | 73.62 | 41.07 | 78.01 |
| CGCS2000_GK_Zone_14 | 4492 | China - 78°E to 84°E | 29.16 | 77.98 | 47.23 | 84 |
| CGCS2000_GK_Zone_15 | 4493 | China - 84°E to 90°E | 27.32 | 84 | 49.18 | 90 |
| CGCS2000_GK_Zone_16 | 4494 | China - 90°E to 96°E | 27.71 | 90 | 47.9 | 96.01 |
| CGCS2000_GK_Zone_17 | 4495 | China - 96°E to 102°E | 21.13 | 96 | 43.18 | 102.01 |
| CGCS2000_GK_Zone_18 | 4496 | China - 102°E to 108°E | 17.75 | 102 | 42.47 | 108 |
| CGCS2000_GK_Zone_19 | 4497 | China - 108°E to 114°E | 16.7 | 108 | 45.11 | 114 |
| CGCS2000_GK_Zone_20 | 4498 | China - 114°E to 120°E | 19.02 | 114 | 51.52 | 120 |
| CGCS2000_GK_Zone_21 | 4499 | China - 120°E to 126°E | 24.64 | 120 | 53.56 | 126 |
| CGCS2000_GK_Zone_22 | 4500 | China - 126°E to 132°E | 29.7 | 126 | 52.79 | 132 |
| CGCS2000_GK_Zone_23 | 4501 | China - east of 132°E | 45.02 | 132 | 48.4 | 134.77 |
| CGRS_1993_Cyprus_Local_Transverse_ Mercator | 6312 | Cyprus - onshore | 34.59 | 32.2 | 35.74 | 34.65 |
| CGRS_1993_LTM | 102319 | Cyprus - onshore | 34.59 | 32.2 | 35.74 | 34.65 |
| CH1903+_LV95 | 2056 | Europe - Liechtenstein and Switzerland | 45.82 | 5.96 | 47.81 | 10.49 |
| CH1903_LV03 | 21781 | Europe - Liechtenstein and Switzerland | 45.82 | 5.96 | 47.81 | 10.49 |
| CH1903_LV03C-G | 21782 | Liechtenstein | 47.05 | 9.47 | 47.28 | 9.64 |
| Chatham_Island_1971_Map_Grid | 5518 | New Zealand - Chatham Islands group | -44.64 | -177.25 | -43.3 | -175.54 |
| Chatham_Islands_1979_Map_Grid | 5519 | New Zealand - Chatham Islands group | -44.64 | -177.25 | -43.3 | -175.54 |
| Chos_Malal_1914_Argentina_2 | 2081 | Argentina - Mendoza and Neuquen 70.5°W to 67.5°W | -43.41 | -70.51 | -31.91 | -67.49 |
| Chua_UTM_Zone_23S | 4071 | Brazil - Distrito Federal | -15.94 | -48.1 | -15.37 | -47.1 |
| COB_NAD83_2007 | 102041 | USA - Washington - Bellevue | 47.5 | -122.26 | 47.69 | -122.06 |
| Colombia_Bogota_Zone | 21897 | Colombia - 75°35'W to 72°35'W | -2.51 | -75.59 | 11.82 | -72.58 |
| Colombia_East_Central_Zone | 21898 | Colombia - 72°35'W to 69°35'W | -4.23 | -72.59 | 12.52 | -69.58 |
| Colombia_East_Zone | 21899 | Colombia - east of 69°35'W | -2.25 | -69.59 | 6.31 | -66.87 |
| Colombia_West_West_Zone | 102231 | Colombia - west of 78°35'W | 1.23 | -79.1 | 2.48 | -78.58 |
| Colombia_West_Zone | 21896 | Colombia - west of 75°35'W | 0.03 | -79.1 | 10.21 | -75.58 |
| Combani_1950_UTM_38S | 2980 | Mayotte - onshore | -13.05 | 44.98 | -12.61 | 45.35 |
| Conakry_1905_UTM_Zone_28N | 31528 | Guinea - west of 12°W | 9.01 | -15.13 | 12.68 | -12 |
| Conakry_1905_UTM_Zone_29N | 31529 | Guinea - east of 12°W | 7.19 | -12 | 12.51 | -7.65 |
| Corrego_Alegre_1961_UTM_Zone_21S | 5536 | Brazil - west of 54°W and south of 18°S | -31.91 | -58.16 | -17.99 | -54 |
| Corrego_Alegre_1961_UTM_Zone_22S | 5537 | Brazil - 54°W to 48°W and south of 15°S | -33.78 | -54 | -15 | -48 |
| Corrego_Alegre_1961_UTM_Zone_23S | 5538 | Brazil - 48°W to 42°W and south of 15°S | -25.29 | -48 | -15 | -42 |
| Corrego_Alegre_1961_UTM_Zone_24S | 5539 | Brazil - 42°W to 36°W and south of 15°S onshore | -22.96 | -42 | -14.99 | -38.82 |
| Corrego_Alegre_UTM_Zone_21S | 22521 | Brazil - west of 54°W and south of 18°S | -31.91 | -58.16 | -17.99 | -54 |
| Corrego_Alegre_UTM_Zone_22S | 22522 | Brazil - 54°W to 48°W and south of 15°S | -33.78 | -54 | -15 | -48 |
| Corrego_Alegre_UTM_Zone_23S | 22523 | Brazil - 48°W to 42°W and south of 15°S | -25.29 | -48 | -15 | -42 |
| Corrego_Alegre_UTM_Zone_24S | 22524 | Brazil - 42°W to 36°W onshore | -22.96 | -42 | -2.68 | -36 |
| Corrego_Alegre_UTM_Zone_25S | 22525 | Brazil - east of 36°W onshore | -10.1 | -36 | -4.99 | -34.74 |
| CR-SIRGAS_CRTM05 | 8908 | Costa Rica - onshore | 7.98 | -85.97 | 11.22 | -82.53 |
| CR-SIRGAS_UTM_Zone_16N | 8909 | Costa Rica - offshore Pacific | 2.15 | -90.45 | 11.11 | -82.92 |
| CR-SIRGAS_UTM_Zone_17N | 8910 | Costa Rica - offshore Caribbean | 9.6 | -83.6 | 11.77 | -81.43 |
| CRTM05 | 5367 | Costa Rica - onshore and offshore east of 86°30'W | 2.21 | -86.5 | 11.77 | -81.43 |
| CSG_1967_UTM_22N | 2971 | French Guiana - coastal area east of 54°W | 3.43 | -54 | 5.81 | -51.61 |
| CSG_1967_UTM_Zone_21N | 3312 | French Guiana - coastal area west of 54°W | 4.84 | -54.45 | 5.69 | -54 |
| D48_Slovenia_TM | 102060 | Slovenia | 45.42 | 13.38 | 46.88 | 16.61 |
| Dabola_1981_UTM_Zone_28N | 3461 | Guinea - west of 12°W | 9.01 | -15.13 | 12.68 | -12 |
| Dabola_1981_UTM_Zone_29N | 3462 | Guinea - east of 12°W | 7.19 | -12 | 12.51 | -7.65 |
| Datum_73_Hayford_Gauss_IGeoE | 102160 | Portugal | 29.24 | -35.58 | 43.07 | -6.19 |
| Datum_73_Hayford_Gauss_IPCC | 102161 | Portugal | 29.24 | -35.58 | 43.07 | -6.19 |
| Datum_73_Modified_Portuguese_Grid | 27493 | Portugal - mainland - onshore | 36.95 | -9.56 | 42.16 | -6.19 |
| Datum_73_UTM_Zone_29N | 27429 | Portugal - mainland - onshore | 36.95 | -9.56 | 42.16 | -6.19 |
| DB_REF_3-Degree_GK_Zone_2_(E-N) | 5682 | Germany - West Germany - west of 7.5°E | 49.11 | 5.86 | 53.81 | 7.5 |
| DB_REF_3-Degree_GK_Zone_3_(E-N) | 5683 | Germany - onshore 7.5°E to 10.5°E | 47.27 | 7.5 | 55.09 | 10.51 |
| DB_REF_3-Degree_GK_Zone_4_(E-N) | 5684 | Germany - onshore 10.5°E to 13.5°E | 47.39 | 10.5 | 54.74 | 13.51 |
| DB_REF_3-Degree_GK_Zone_5_(E-N) | 5685 | Germany - onshore east of 13.5°E | 48.51 | 13.5 | 54.72 | 15.04 |
| Deir_ez_Zor_Levant_Stereographic | 22780 | Asia - Middle East - Lebanon and Syria onshore | 32.31 | 35.04 | 37.3 | 42.38 |
| Deir_ez_Zor_Levant_Zone | 22700 | Asia - Middle East - Lebanon and Syria onshore | 32.31 | 35.04 | 37.3 | 42.38 |
| Deir_ez_Zor_Syria_Lambert | 22770 | Asia - Middle East - Lebanon and Syria onshore | 32.31 | 35.04 | 37.3 | 42.38 |
| DGN_1995_Indonesia_TM-3_Zone_46.2 | 23830 | Indonesia - west of 96°E onshore | 2.55 | 95.16 | 5.97 | 96 |
| DGN_1995_Indonesia_TM-3_Zone_47.1 | 23831 | Indonesia - 96°E to 99°E onshore | -1.81 | 96 | 5.42 | 99 |
| DGN_1995_Indonesia_TM-3_Zone_47.2 | 23832 | Indonesia - 99°E to 102°E onshore | -3.57 | 99 | 3.71 | 102 |
| DGN_1995_Indonesia_TM-3_Zone_48.1 | 23833 | Indonesia - 102°E to 105°E onshore | -5.99 | 102 | 1.68 | 105 |
| DGN_1995_Indonesia_TM-3_Zone_48.2 | 23834 | Indonesia - 105°E to 108°E onshore | -7.79 | 105 | 4.11 | 108 |
| DGN_1995_Indonesia_TM-3_Zone_49.1 | 23835 | Indonesia - 108°E to 111°E onshore | -8.31 | 108 | 4.25 | 111 |
| DGN_1995_Indonesia_TM-3_Zone_49.2 | 23836 | Indonesia - 111°E to 114°E onshore | -8.67 | 111 | 1.59 | 114 |
| DGN_1995_Indonesia_TM-3_Zone_50.1 | 23837 | Indonesia - 114°E to 117°E onshore | -9.15 | 114 | 4.37 | 117.01 |
| DGN_1995_Indonesia_TM-3_Zone_50.2 | 23838 | Indonesia - 117°E to 120°E onshore | -10.15 | 117 | 4.36 | 120 |
| DGN_1995_Indonesia_TM-3_Zone_51.1 | 23839 | Indonesia - 120°E to 123°E onshore | -10.98 | 120 | 1.4 | 123 |
| DGN_1995_Indonesia_TM-3_Zone_51.2 | 23840 | Indonesia - 123°E to 126°E onshore | -10.92 | 123 | 3.84 | 126 |
| DGN_1995_Indonesia_TM-3_Zone_52.1 | 23841 | Indonesia - 126°E to 129°E onshore | -8.32 | 126 | 4.59 | 129 |
| DGN_1995_Indonesia_TM-3_Zone_52.2 | 23842 | Indonesia - 129°E to 132°E onshore | -8.41 | 129 | 0.1 | 132 |
| DGN_1995_Indonesia_TM-3_Zone_53.1 | 23843 | Indonesia - 132°E to 135°E onshore | -7.3 | 132 | -0.29 | 135 |
| DGN_1995_Indonesia_TM-3_Zone_53.2 | 23844 | Indonesia - 135°E to 138°E onshore | -8.49 | 135 | -0.58 | 138 |
| DGN_1995_Indonesia_TM-3_Zone_54.1 | 23845 | Indonesia - east of 138°E onshore | -9.19 | 138 | -1.49 | 141.01 |
| DGN_1995_UTM_Zone_46N | 23866 | Indonesia - west of 96°E, N hemisphere | 0 | 92.01 | 7.79 | 96 |
| DGN_1995_UTM_Zone_47N | 23867 | Indonesia - 96°E to 102°E, N hemisphere | 0 | 96 | 7.49 | 102 |
| DGN_1995_UTM_Zone_47S | 23877 | Indonesia - 96°E to 102°E, S hemisphere | -8.86 | 96 | 0 | 102 |
| DGN_1995_UTM_Zone_48N | 23868 | Indonesia - 102°E to 108°E, N hemisphere | 0 | 102 | 6.94 | 108 |
| DGN_1995_UTM_Zone_48S | 23878 | Indonesia - 102°E to 108°E, S hemisphere | -10.1 | 102 | 0 | 108.01 |
| DGN_1995_UTM_Zone_49N | 23869 | Indonesia - 108°E to 114°E, N hemisphere | 0 | 108 | 7.37 | 114 |
| DGN_1995_UTM_Zone_49S | 23879 | Indonesia - 108°E to 114°E, S hemisphere | -12.07 | 108 | 0 | 114 |
| DGN_1995_UTM_Zone_50N | 23870 | Indonesia - 114°E to 120°E, N hemisphere | 0 | 114 | 4.37 | 120 |
| DGN_1995_UTM_Zone_50S | 23880 | Indonesia - 114°E to 120°E, S hemisphere | -13.06 | 114 | 0 | 120.01 |
| DGN_1995_UTM_Zone_51N | 23871 | Indonesia - 120°E to 126°E, N hemisphere | 0 | 120 | 5.48 | 126 |
| DGN_1995_UTM_Zone_51S | 23881 | Indonesia - 120°E to 126°E, S hemisphere | -13.95 | 120 | 0.01 | 126.01 |
| DGN_1995_UTM_Zone_52N | 23872 | Indonesia - 126°E to 132°E, N hemisphere | 0 | 126 | 6.68 | 132 |
| DGN_1995_UTM_Zone_52S | 23882 | Indonesia - 126°E to 132°E, S hemisphere | -9.45 | 126 | 0 | 132 |
| DGN_1995_UTM_Zone_53S | 23883 | Indonesia - 132°E to 138°E, S hemisphere | -10.06 | 132 | 0 | 138.01 |
| DGN_1995_UTM_Zone_54S | 23884 | Indonesia - east of 138°E, S hemisphere | -10.84 | 138 | 0 | 141.46 |
| DHDN_3_Degree_Gauss_Zone_1 | 5520 | Germany - offshore North Sea west of 4.5°E | 55.24 | 3.34 | 55.92 | 4.5 |
| DHDN_3_Degree_Gauss_Zone_2 | 31466 | Germany - West Germany - west of 7.5°E | 49.11 | 5.86 | 53.81 | 7.5 |
| DHDN_3_Degree_Gauss_Zone_3 | 31467 | Germany - West- Germany - 7.5°E to 10.5°E | 47.27 | 7.5 | 55.09 | 10.51 |
| DHDN_3_Degree_Gauss_Zone_4 | 31468 | Germany - West Germany - 10.5°E to 13.5°E | 47.39 | 10.5 | 54.59 | 13.51 |
| DHDN_3_Degree_Gauss_Zone_5 | 31469 | Germany - West Germany - east of 13.5°E | 48.51 | 13.5 | 48.98 | 13.84 |
| DHDN_3_Degree_GK_Zone_1_E-N | 5680 | Germany - offshore North Sea west of 4.5°E | 55.24 | 3.34 | 55.92 | 4.5 |
| DHDN_3_Degree_GK_Zone_2_E-N | 5676 | Germany - West Germany - west of 7.5°E | 49.11 | 5.86 | 53.81 | 7.5 |
| DHDN_3_Degree_GK_Zone_3_E-N | 5677 | Germany - West- Germany - 7.5°E to 10.5°E | 47.27 | 7.5 | 55.09 | 10.51 |
| DHDN_3_Degree_GK_Zone_4_E-N | 5678 | Germany - West Germany - 10.5°E to 13.5°E | 47.39 | 10.5 | 54.59 | 13.51 |
| DHDN_3_Degree_GK_Zone_5_E-N | 5679 | Germany - West Germany - east of 13.5°E | 48.51 | 13.5 | 48.98 | 13.84 |
| DHDN_Soldner_Berlin | 3068 | Germany - Berlin | 52.33 | 13.09 | 52.65 | 13.76 |
| Dominica_1945_British_West_Indies_ Grid | 2002 | Dominica - onshore | 15.14 | -61.55 | 15.69 | -61.2 |
| Douala_1948_AEF_West | 3119 | Cameroon - coastal area | 2.16 | 8.45 | 4.99 | 10.4 |
| Douala_UTM_Zone_32N | 22832 | Cameroon | 1.65 | 8.32 | 13.09 | 16.21 |
| DRUKREF_03_Bhutan_National_Grid | 5266 | Bhutan | 26.7 | 88.74 | 28.33 | 92.13 |
| DRUKREF_03_Bumthang_TM | 5292 | Bhutan - Bumthang district | 27.33 | 90.46 | 28.09 | 91.02 |
| DRUKREF_03_Chhukha_TM | 5293 | Bhutan - Chhukha district | 26.71 | 89.26 | 27.32 | 89.83 |
| DRUKREF_03_Dagana_TM | 5294 | Bhutan - Dagana district | 26.7 | 89.63 | 27.29 | 90.08 |
| DRUKREF_03_Gasa_TM | 5295 | Bhutan - Gasa district | 27.72 | 89.44 | 28.33 | 90.47 |
| DRUKREF_03_Ha_TM | 5296 | Bhutan - Ha district | 27.02 | 88.9 | 27.62 | 89.39 |
| DRUKREF_03_Lhuentse_TM | 5297 | Bhutan - Lhuentse district | 27.39 | 90.77 | 28.09 | 91.49 |
| DRUKREF_03_Mongar_TM | 5298 | Bhutan - Mongar district | 26.93 | 90.95 | 27.61 | 91.5 |
| DRUKREF_03_Paro_TM | 5299 | Bhutan - Paro district | 27.18 | 89.12 | 27.79 | 89.56 |
| DRUKREF_03_Pemagatshel_TM | 5300 | Bhutan - Pemagatshel district | 26.78 | 91 | 27.18 | 91.56 |
| DRUKREF_03_Punakha_TM | 5301 | Bhutan - Punakha district | 27.46 | 89.63 | 27.87 | 90.08 |
| DRUKREF_03_Samdrup_Jongkhar_TM | 5302 | Bhutan - Samdrup Jongkhar district | 26.79 | 91.39 | 27.25 | 92.13 |
| DRUKREF_03_Samtse_TM | 5303 | Bhutan - Samtse district | 26.8 | 88.74 | 27.28 | 89.38 |
| DRUKREF_03_Sarpang_TM | 5304 | Bhutan - Sarpang district | 26.73 | 90.01 | 27.23 | 90.78 |
| DRUKREF_03_Thimphu_TM | 5305 | Bhutan - Thimphu district | 27.14 | 89.22 | 28.01 | 89.77 |
| DRUKREF_03_Trashigang_TM | 5306 | Bhutan - Trashigang district | 27.01 | 91.37 | 27.49 | 92.13 |
| DRUKREF_03_Trongsa_TM | 5307 | Bhutan - Trongsa district | 27.13 | 90.26 | 27.79 | 90.76 |
| DRUKREF_03_Tsirang_TM | 5308 | Bhutan - Tsirang district | 26.81 | 90 | 27.2 | 90.35 |
| DRUKREF_03_Wangdue_Phodrang_TM | 5309 | Bhutan - Wangdue Phodrang district | 27.11 | 89.71 | 28.08 | 90.54 |
| DRUKREF_03_Yangtse_TM | 5310 | Bhutan - Yangtse district | 27.37 | 91.34 | 28 | 91.77 |
| DRUKREF_03_Zhemgang_TM | 5311 | Bhutan - Zhemgang district | 26.77 | 90.53 | 27.39 | 91.19 |
| ECML14_NB_Grid | 9761 | UK - Newcastle to Ashington | 54.85 | -1.9 | 55.3 | -1.3 |
| ED_1950_3_Degree_GK_Zone_10 | 2207 | Turkey - 28.5°E to 31.5°E onshore | 36.06 | 28.5 | 41.46 | 31.5 |
| ED_1950_3_Degree_GK_Zone_11 | 2208 | Turkey - 31.5°E to 34.5°E onshore | 35.97 | 31.5 | 42.07 | 34.5 |
| ED_1950_3_Degree_GK_Zone_12 | 2209 | Turkey - 34.5°E to 37.5°E onshore | 35.81 | 34.5 | 42.15 | 37.5 |
| ED_1950_3_Degree_GK_Zone_13 | 2210 | Turkey - 37.5°E to 40.5°E onshore | 36.66 | 37.5 | 41.19 | 40.5 |
| ED_1950_3_Degree_GK_Zone_14 | 2211 | Turkey - 40.5°E to 43.5°E onshore | 37.02 | 40.5 | 41.6 | 43.5 |
| ED_1950_3_Degree_GK_Zone_15 | 2212 | Turkey - east of 43.5°E | 36.97 | 43.5 | 41.02 | 44.83 |
| ED_1950_3_Degree_GK_Zone_9 | 2206 | Turkey - west of 28.5°E onshore | 36.5 | 25.62 | 42.11 | 28.5 |
| ED_1950_ED77_UTM_Zone_38N | 2058 | Iran - west of 48°E | 30.99 | 44.03 | 39.78 | 48 |
| ED_1950_ED77_UTM_Zone_39N | 2059 | Iran - 48°E to 54°E | 25.47 | 48 | 39.71 | 54 |
| ED_1950_ED77_UTM_Zone_40N | 2060 | Iran - 54°E to 60°E | 25.32 | 54 | 38.29 | 60 |
| ED_1950_ED77_UTM_Zone_41N | 2061 | Iran - east of 60°E onshore | 25.02 | 60 | 37.06 | 63.34 |
| ED_1950_France_EuroLambert | 2192 | France - mainland onshore | 42.33 | -4.87 | 51.14 | 8.23 |
| ED_1950_Iraq_National_Grid | 3893 | Iraq - onshore | 29.06 | 38.79 | 37.39 | 48.61 |
| ED_1950_Jordan_TM | 3066 | Jordan | 29.18 | 34.88 | 33.38 | 39.31 |
| ED_1950_Southern_Permian_Basin_ Lambert | 5643 | Europe - South Permian basin | 50.5 | -1.67 | 56 | 22 |
| ED_1950_TM_0_N | 23090 | UK - offshore - North Sea | 51.03 | -5.05 | 62.03 | 3.4 |
| ED_1950_TM27 | 2319 | Turkey - west of 28.5°E onshore | 36.5 | 25.62 | 42.11 | 28.5 |
| ED_1950_TM30 | 2320 | Turkey - 28.5°E to 31.5°E onshore | 36.06 | 28.5 | 41.46 | 31.5 |
| ED_1950_TM33 | 2321 | Turkey - 31.5°E to 34.5°E onshore | 35.97 | 31.5 | 42.07 | 34.5 |
| ED_1950_TM36 | 2322 | Turkey - 34.5°E to 37.5°E onshore | 35.81 | 34.5 | 42.15 | 37.5 |
| ED_1950_TM39 | 2323 | Turkey - 37.5°E to 40.5°E onshore | 36.66 | 37.5 | 41.19 | 40.5 |
| ED_1950_TM42 | 2324 | Turkey - 40.5°E to 43.5°E onshore | 37.02 | 40.5 | 41.6 | 43.5 |
| ED_1950_TM45 | 2325 | Turkey - east of 43.5°E | 36.97 | 43.5 | 41.02 | 44.83 |
| ED_1950_TM_5_NE | 23095 | Netherlands - offshore | 51.45 | 2.53 | 55.77 | 6.41 |
| ED_1950_TM_6_NE | 5627 | France - offshore Mediterranean | 41.15 | 3.04 | 43.74 | 10.38 |
| ED_1950_Turkey_10 | 102551 | Turkey - 28.5°E to 31.5°E onshore | 36.06 | 28.5 | 41.46 | 31.5 |
| ED_1950_Turkey_11 | 102552 | Turkey - 31.5°E to 34.5°E onshore | 35.97 | 31.5 | 42.07 | 34.5 |
| ED_1950_Turkey_12 | 102553 | Turkey - 34.5°E to 37.5°E onshore | 35.81 | 34.5 | 42.15 | 37.5 |
| ED_1950_Turkey_13 | 102554 | Turkey - 37.5°E to 40.5°E onshore | 36.66 | 37.5 | 41.19 | 40.5 |
| ED_1950_Turkey_14 | 102555 | Turkey - 40.5°E to 43.5°E onshore | 37.02 | 40.5 | 41.6 | 43.5 |
| ED_1950_Turkey_15 | 102556 | Turkey - east of 43.5°E | 36.97 | 43.5 | 41.02 | 44.83 |
| ED_1950_Turkey_9 | 102550 | Turkey - west of 28.5°E onshore | 36.5 | 25.62 | 42.11 | 28.5 |
| ED_1950_UTM_Zone_28N | 23028 | Europe - 18°W to 12°W and ED50 by country | 48.43 | -16.1 | 56.57 | -12 |
| ED_1950_UTM_Zone_29N | 23029 | Europe - 12°W to 6°W and ED50 by country | 36.13 | -12 | 62.41 | -6 |
| ED_1950_UTM_Zone_30N | 23030 | Europe - 6°W to 0°W and ED50 by country | 35.26 | -6 | 80.49 | 0.01 |
| ED_1950_UTM_Zone_31N | 23031 | Europe - 0°E to 6°E and ED50 by country | 38.56 | 0 | 82.45 | 6.01 |
| ED_1950_UTM_Zone_32N | 23032 | Europe - 6°E to 12°E and ED50 by country | 36.53 | 5.99 | 84.33 | 12 |
| ED_1950_UTM_Zone_33N | 23033 | Europe - 12°E to 18°E and ED50 by country | 34.49 | 12 | 84.42 | 18 |
| ED_1950_UTM_Zone_34N | 23034 | Europe - 18°E to 24°E and ED50 by country | 33.59 | 18 | 84.54 | 24.01 |
| ED_1950_UTM_Zone_35N | 23035 | Europe - 24°E to 30°E and ED50 by country | 25.71 | 24 | 84.73 | 30.01 |
| ED_1950_UTM_Zone_36N | 23036 | Europe - 30°E to 36°E and ED50 by country | 29.19 | 30 | 84.7 | 36 |
| ED_1950_UTM_Zone_37N | 23037 | Europe - 36°E to 42°E and ED50 by country | 29.18 | 36 | 79.07 | 42 |
| ED_1950_UTM_Zone_38N | 23038 | Europe - 42°E to 48°E and ED50 by country | 36.97 | 42 | 41.6 | 44.83 |
| Egypt_Blue_Belt | 22991 | Egypt - east of 33°E onshore | 21.97 | 33 | 31.36 | 36.95 |
| Egypt_Extended_Purple_Belt | 22994 | Egypt - west of 29°E; south of 28°11'N | 21.99 | 24.99 | 28.19 | 29.01 |
| Egypt_Gulf_of_Suez_S-650_TL_Red_Belt | 3355 | Egypt - Gulf of Suez | 27.19 | 32.34 | 30.01 | 34.27 |
| Egypt_Purple_Belt | 22993 | Egypt - west of 29°E; north of 28°11'N | 28.18 | 24.7 | 31.68 | 29 |
| Egypt_Red_Belt | 22992 | Egypt - 29°E to 33°E | 21.99 | 29 | 33.82 | 34.27 |
| ELD_1979_Libya_10 | 2073 | Libya - 18°E to 20°E onshore | 21.54 | 18 | 32.17 | 20 |
| ELD_1979_Libya_11 | 2074 | Libya - 20°E to 22°E onshore | 20.54 | 20 | 33 | 22 |
| ELD_1979_Libya_12 | 2075 | Libya - 22°E to 24°E onshore | 19.5 | 22 | 32.97 | 24 |
| ELD_1979_Libya_13 | 2076 | Libya - east of 24°E onshore | 19.99 | 24 | 32.15 | 25.21 |
| ELD_1979_Libya_5 | 2068 | Libya - west of 10°E | 25.37 | 9.31 | 30.49 | 10.01 |
| ELD_1979_Libya_6 | 2069 | Libya - 10°E to 12°E onshore | 23.51 | 10 | 33.23 | 12 |
| ELD_1979_Libya_7 | 2070 | Libya - 12°E to 14°E onshore | 22.8 | 12 | 33.06 | 14 |
| ELD_1979_Libya_8 | 2071 | Libya - 14°E to 16°E onshore | 22.61 | 14 | 32.79 | 16 |
| ELD_1979_Libya_9 | 2072 | Libya - 16°E to 18°E onshore | 22.51 | 16 | 31.34 | 18.01 |
| ELD_1979_TM_12_NE | 2087 | Libya - west of 15°E onshore | 22.61 | 9.31 | 33.23 | 15 |
| ELD_1979_UTM_Zone_32N | 2077 | Libya - west of 12°E onshore | 23.51 | 9.31 | 33.23 | 12 |
| ELD_1979_UTM_Zone_33N | 2078 | Libya - 12°E to 18°E onshore | 22.51 | 12 | 33.06 | 18.01 |
| ELD_1979_UTM_Zone_34N | 2079 | Libya - 18°E to 24°E onshore | 19.5 | 17.99 | 33 | 24 |
| ELD_1979_UTM_Zone_35N | 2080 | Libya - east of 24°E onshore | 19.99 | 24 | 32.15 | 25.21 |
| EMEP_150_Kilometer_Grid | 102069 | Europe | 34 | -30 | 85 | 50 |
| EMEP_50_Kilometer_Grid | 102068 | Europe | 34 | -30 | 85 | 50 |
| EOS21_Grid | 9741 | UK - Tweedmouth to Aberdeen | 55.55 | -3.55 | 57.2 | -1.95 |
| Estonia_1997_Estonia_National_Grid | 3301 | Estonia | 57.52 | 20.37 | 60 | 28.2 |
| Estonian_Coordinate_System_of_1992 | 3300 | Estonia - onshore | 57.52 | 21.74 | 59.75 | 28.2 |
| ETRS_1989_Albania_2010 | 6870 | Albania - onshore | 39.64 | 19.22 | 42.67 | 21.06 |
| ETRS_1989_Albania_LCC_2010 | 6962 | Albania - onshore | 39.64 | 19.22 | 42.67 | 21.06 |
| ETRS_1989_Austria_Lambert | 3416 | Austria | 46.4 | 9.53 | 49.02 | 17.17 |
| ETRS_1989_DKTM1 | 4093 | Denmark - onshore Jutland west of 10°E | 54.8 | 8 | 57.64 | 10 |
| ETRS_1989_DKTM2 | 4094 | Denmark - onshore Jutland east of 9°E and Funen | 54.67 | 9 | 57.8 | 11.29 |
| ETRS_1989_DKTM3 | 4095 | Denmark - onshore Zealand and Lolland | 54.51 | 10.79 | 56.79 | 12.69 |
| ETRS_1989_DKTM4 | 4096 | Denmark - onshore Bornholm | 54.94 | 14.59 | 55.38 | 15.25 |
| ETRS_1989_EPSG_Arctic_zone_2-22 | 6069 | Arctic - 84°30'N to 79°30'N, 4°W to 36°E | 79.5 | -4 | 84.51 | 36.01 |
| ETRS_1989_EPSG_Arctic_zone_3-11 | 6070 | Arctic - 81°10'N to 76°10'N, 4°W to 38°E | 76.16 | -3.35 | 81.17 | 38 |
| ETRS_1989_EPSG_Arctic_zone_4-26 | 6071 | Arctic - 77°50'N to 72°50'N, 2°W to 22°E | 72.83 | -2 | 77.84 | 22.01 |
| ETRS_1989_EPSG_Arctic_zone_4-28 | 6072 | Arctic - 77°50'N to 72°50'N, 22°E to 46°E | 72.83 | 22 | 77.84 | 46.01 |
| ETRS_1989_EPSG_Arctic_zone_5-11 | 6073 | Arctic - 74°30'N to 69°30'N, 4°E to 24°E | 69.5 | 4 | 74.51 | 24.01 |
| ETRS_1989_EPSG_Arctic_zone_5-13 | 6074 | Arctic - 74°30'N to 69°30'N, 24°E to 44°E | 69.5 | 24 | 74.51 | 44.01 |
| ETRS_1989_EPSG_Arctic_zone_5-47 | 6125 | Arctic - 74°30'N to 69°30'N, 15°W to 5°E | 69.5 | -15 | 74.51 | 5.01 |
| ETRS_1989_ETRS-GK19FIN | 3126 | Finland - west of 19.5°E onshore | 60.08 | 19.24 | 60.34 | 19.5 |
| ETRS_1989_ETRS-GK20FIN | 3127 | Finland - 19.5°E to 20.5°E onshore | 59.92 | 19.5 | 60.48 | 20.5 |
| ETRS_1989_ETRS-GK21FIN | 3128 | Finland - 20.5°E to 21.5°E onshore | 59.84 | 20.5 | 69.33 | 21.5 |
| ETRS_1989_ETRS-GK22FIN | 3129 | Finland - 21.5°E to 22.5°E onshore | 59.76 | 21.5 | 69.31 | 22.5 |
| ETRS_1989_ETRS-GK23FIN | 3130 | Finland - 22.5°E to 23.5°E onshore | 59.75 | 22.5 | 68.74 | 23.5 |
| ETRS_1989_ETRS-GK24FIN | 3131 | Finland - 23.5°E to 24.5°E onshore | 59.86 | 23.5 | 68.84 | 24.5 |
| ETRS_1989_ETRS-GK25FIN | 3132 | Finland - 24.5°E to 25.5°E onshore | 59.94 | 24.5 | 68.9 | 25.5 |
| ETRS_1989_ETRS-GK26FIN | 3133 | Finland - 25.5°E to 26.5°E onshore | 60.18 | 25.5 | 69.94 | 26.5 |
| ETRS_1989_ETRS-GK27FIN | 3134 | Finland - 26.5°E to 27.5°E onshore | 60.36 | 26.5 | 70.05 | 27.5 |
| ETRS_1989_ETRS-GK28FIN | 3135 | Finland - 27.5°E to 28.5°E onshore | 60.42 | 27.5 | 70.09 | 28.5 |
| ETRS_1989_ETRS-GK29FIN | 3136 | Finland - 28.5°E to 29.5°E | 60.94 | 28.5 | 69.81 | 29.5 |
| ETRS_1989_ETRS-GK30FIN | 3137 | Finland - 29.5°E to 30.5°E | 61.43 | 29.5 | 67.98 | 30.5 |
| ETRS_1989_ETRS-GK31FIN | 3138 | Finland - east of 30.5°E | 62.08 | 30.5 | 64.27 | 31.59 |
| ETRS_1989_ETRS-TM26 | 3038 | Europe - 30°W to 24°W | 25.1 | -30 | 65.8 | -24 |
| ETRS_1989_ETRS-TM27 | 3039 | Europe - 24°W to 18°W | 27.6 | -24 | 66.5 | -18 |
| ETRS_1989_ETRS-TM28 | 3040 | Europe - 18°W to 12°W and ETRS89 by country | 34.93 | -16.1 | 72.44 | -11.99 |
| ETRS_1989_ETRS-TM29 | 3041 | Europe - 12°W to 6°W and ETRS89 by country | 34.91 | -12 | 74.13 | -6 |
| ETRS_1989_ETRS-TM30 | 3042 | Europe - 6°W to 0°W and ETRS89 by country | 35.26 | -6 | 80.49 | 0.01 |
| ETRS_1989_ETRS-TM31 | 3043 | Germany - west of 6°E | 50.97 | 3.34 | 55.92 | 6 |
| ETRS_1989_ETRS-TM32 | 3044 | Germany - 6°E to 12°E | 47.27 | 6 | 55.47 | 12 |
| ETRS_1989_ETRS-TM33 | 3045 | Germany - east of 12°E | 47.46 | 11.57 | 55.03 | 15.04 |
| ETRS_1989_ETRS-TM34 | 3046 | Europe - 18°E to 24°E and ETRS89 by country | 58.84 | 18 | 84.54 | 24.01 |
| ETRS_1989_ETRS-TM35 | 3047 | Europe - 24°E to 30°E and ETRS89 by country | 59.64 | 24 | 84.73 | 30.01 |
| ETRS_1989_ETRS-TM36 | 3048 | Europe - 30°E to 36°E and ETRS89 by country | 61.73 | 30 | 84.7 | 36 |
| ETRS_1989_ETRS-TM37 | 3049 | Europe - 36°E to 42°E and ETRS89 by country | 72.99 | 36 | 79.07 | 38 |
| ETRS_1989_ETRS-TM38 | 3050 | Europe - 42°E to 48°E | 36.95 | 42 | 75 | 48 |
| ETRS_1989_ETRS-TM39 | 3051 | Europe - 48°E to 54°E | 36 | 48 | 75 | 54 |
| ETRS_1989_FAROE_TM | 5316 | Faroe Islands | 59.94 | -13.91 | 65.7 | -0.48 |
| ETRS_1989_GK_CM_9E | 8395 | Germany - Hamburg | 53.36 | 8.33 | 53.99 | 10.41 |
| ETRS_1989_GK19FIN | 3873 | Finland - west of 19.5°E onshore nominal | 60.08 | 19.24 | 60.34 | 19.5 |
| ETRS_1989_GK20FIN | 3874 | Finland - 19.5°E to 20.5°E onshore nominal | 59.92 | 19.5 | 60.48 | 20.5 |
| ETRS_1989_GK21FIN | 3875 | Finland - 20.5°E to 21.5°E onshore nominal | 59.84 | 20.5 | 69.33 | 21.5 |
| ETRS_1989_GK22FIN | 3876 | Finland - 21.5°E to 22.5°E onshore nominal | 59.76 | 21.5 | 69.31 | 22.5 |
| ETRS_1989_GK23FIN | 3877 | Finland - 22.5°E to 23.5°E onshore nominal | 59.75 | 22.5 | 68.74 | 23.5 |
| ETRS_1989_GK24FIN | 3878 | Finland - 23.5°E to 24.5°E onshore nominal | 59.86 | 23.5 | 68.84 | 24.5 |
| ETRS_1989_GK25FIN | 3879 | Finland - 24.5°E to 25.5°E onshore nominal | 59.94 | 24.5 | 68.9 | 25.5 |
| ETRS_1989_GK26FIN | 3880 | Finland - 25.5°E to 26.5°E onshore nominal | 60.18 | 25.5 | 69.94 | 26.5 |
| ETRS_1989_GK27FIN | 3881 | Finland - 26.5°E to 27.5°E onshore nominal | 60.36 | 26.5 | 70.05 | 27.5 |
| ETRS_1989_GK28FIN | 3882 | Finland - 27.5°E to 28.5°E onshore nominal | 60.42 | 27.5 | 70.09 | 28.5 |
| ETRS_1989_GK29FIN | 3883 | Finland - 28.5°E to 29.5°E nominal | 60.94 | 28.5 | 69.81 | 29.5 |
| ETRS_1989_GK30FIN | 3884 | Finland - 29.5°E to 30.5°E nominal | 61.43 | 29.5 | 67.98 | 30.5 |
| ETRS_1989_GK31FIN | 3885 | Finland - east of 30.5°E nominal | 62.08 | 30.5 | 64.27 | 31.59 |
| ETRS_1989_Guernsey_Grid | 3108 | Channel Islands - Guernsey, Alderney, Sark | 49.11 | -3.73 | 50.16 | -2.02 |
| ETRS_1989_Jersey_Transverse_Mercator | 3109 | Channel Islands - Jersey, Les Ecrehos and Les Minquiers | 48.77 | -2.72 | 49.44 | -1.81 |
| ETRS_1989_Kosovo_Grid | 102157 | Serbia and Kosovo | 41.85 | 18.81 | 46.19 | 23.01 |
| ETRS_1989_Kp2000_Bornholm | 2198 | Denmark - onshore Bornholm | 54.94 | 14.59 | 55.38 | 15.25 |
| ETRS_1989_Kp2000_Jutland | 2196 | Denmark - onshore Jutland and Funen | 54.67 | 8 | 57.8 | 11.29 |
| ETRS_1989_Kp2000_Zealand | 2197 | Denmark - onshore Zealand and Lolland | 54.51 | 10.79 | 56.79 | 12.69 |
| ETRS_1989_LAEA | 3035 | Europe - ETRF by country | 32.88 | -16.1 | 84.73 | 40.18 |
| ETRS_1989_LCC | 3034 | Europe - ETRF by country | 32.88 | -16.1 | 84.73 | 40.18 |
| ETRS_1989_LCC_Germany_E-N | 5243 | Germany - onshore | 47.27 | 5.86 | 55.09 | 15.04 |
| ETRS_1989_LCC_Germany_N-E | 4839 | Germany - onshore | 47.27 | 5.86 | 55.09 | 15.04 |
| ETRS_1989_NTM_Zone_10 | 5110 | Norway - onshore - 10°E to 11°E | 58.9 | 10 | 65.04 | 11 |
| ETRS_1989_NTM_Zone_11 | 5111 | Norway - onshore - 11°E to 12°E | 58.88 | 11 | 65.76 | 12 |
| ETRS_1989_NTM_Zone_12 | 5112 | Norway - onshore - 12°E to 13°E | 59.88 | 12 | 68.15 | 13 |
| ETRS_1989_NTM_Zone_13 | 5113 | Norway - onshore - 13°E to 14°E | 64.01 | 13 | 68.37 | 14 |
| ETRS_1989_NTM_Zone_14 | 5114 | Norway - onshore - 14°E to 15°E | 64.03 | 14 | 69.05 | 15 |
| ETRS_1989_NTM_Zone_15 | 5115 | Norway - onshore - 15°E to 16°E | 66.14 | 15 | 69.35 | 16 |
| ETRS_1989_NTM_Zone_16 | 5116 | Norway - onshore - 16°E to 17°E | 66.88 | 16 | 69.45 | 17 |
| ETRS_1989_NTM_Zone_17 | 5117 | Norway - onshore - 17°E to 18°E | 67.94 | 17 | 69.68 | 18 |
| ETRS_1989_NTM_Zone_18 | 5118 | Norway - onshore - 18°E to 19°E | 68.04 | 18 | 70.27 | 19 |
| ETRS_1989_NTM_Zone_19 | 5119 | Norway - onshore - 19°E to 20°E | 68.33 | 19 | 70.34 | 20 |
| ETRS_1989_NTM_Zone_20 | 5120 | Norway - onshore - 20°E to 21°E | 68.37 | 20 | 70.29 | 21 |
| ETRS_1989_NTM_Zone_21 | 5121 | Norway - onshore - 21°E to 22°E | 69.03 | 21 | 70.71 | 22 |
| ETRS_1989_NTM_Zone_22 | 5122 | Norway - onshore - 22°E to 23°E | 68.69 | 22 | 70.81 | 23 |
| ETRS_1989_NTM_Zone_23 | 5123 | Norway - onshore - 23°E to 24°E | 68.62 | 23 | 71.08 | 24 |
| ETRS_1989_NTM_Zone_24 | 5124 | Norway - onshore - 24°E to 25°E | 68.58 | 24 | 71.16 | 25 |
| ETRS_1989_NTM_Zone_25 | 5125 | Norway - onshore - 25°E to 26°E | 68.59 | 25 | 71.21 | 26 |
| ETRS_1989_NTM_Zone_26 | 5126 | Norway - onshore - 26°E to 27°E | 69.71 | 26 | 71.17 | 27 |
| ETRS_1989_NTM_Zone_27 | 5127 | Norway - onshore - 27°E to 28°E | 69.9 | 27 | 71.17 | 28 |
| ETRS_1989_NTM_Zone_28 | 5128 | Norway - onshore - 28°E to 29°E | 69.03 | 28 | 71.13 | 29 |
| ETRS_1989_NTM_Zone_29 | 5129 | Norway - onshore - 29°E to 30°E | 69.02 | 29 | 70.93 | 30 |
| ETRS_1989_NTM_Zone_30 | 5130 | Norway - onshore - east of 30°E | 69.46 | 30 | 70.77 | 31.22 |
| ETRS_1989_NTM_Zone_5 | 5105 | Norway - onshore - west of 6°E | 58.32 | 4.68 | 62.49 | 6 |
| ETRS_1989_NTM_Zone_6 | 5106 | Norway - onshore - 6°E to 7°E | 57.93 | 6 | 63.02 | 7 |
| ETRS_1989_NTM_Zone_7 | 5107 | Norway - onshore - 7°E to 8°E | 57.93 | 7 | 63.52 | 8 |
| ETRS_1989_NTM_Zone_8 | 5108 | Norway - onshore - 8°E to 9°E | 58.03 | 8 | 63.87 | 9 |
| ETRS_1989_NTM_Zone_9 | 5109 | Norway - onshore - 9°E to 10°E | 58.52 | 9 | 64.16 | 10 |
| ETRS_1989_Poland_CS2000_Zone_5 | 2176 | Poland - west of 16.5°E | 50.26 | 14.14 | 55.35 | 16.5 |
| ETRS_1989_Poland_CS2000_Zone_6 | 2177 | Poland - 16.5°E to 19.5°E | 49.39 | 16.5 | 55.93 | 19.5 |
| ETRS_1989_Poland_CS2000_Zone_7 | 2178 | Poland - 19.5°E to 22.5°E | 49.09 | 19.5 | 54.55 | 22.5 |
| ETRS_1989_Poland_CS2000_Zone_8 | 2179 | Poland - east of 22.5°E | 49 | 22.5 | 54.41 | 24.15 |
| ETRS_1989_Poland_CS92 | 2180 | Poland | 49 | 14.14 | 55.93 | 24.15 |
| ETRS_1989_Portugal_TM06 | 3763 | Portugal - mainland - onshore | 36.95 | -9.56 | 42.16 | -6.19 |
| ETRS_1989_Slovenia_TM | 102109 | Slovenia | 45.42 | 13.38 | 46.88 | 16.61 |
| ETRS_1989_TM_30_NE | 2213 | Romania - offshore | 43.44 | 28.64 | 45.2 | 31.41 |
| ETRS_1989_TM35FIN_NE | 5048 | Finland | 58.84 | 19.08 | 70.09 | 31.59 |
| ETRS_1989_TM_Baltic_1993 | 25884 | Europe - Estonia; Latvia; Lithuania | 53.89 | 19.02 | 60 | 28.24 |
| ETRS_1989_UTM_Zone_26N | 102097 | Europe - 30°W to 24°W | 25.1 | -30 | 65.8 | -24 |
| ETRS_1989_UTM_Zone_27N | 102098 | Europe - 24°W to 18°W | 27.6 | -24 | 66.5 | -18 |
| ETRS_1989_UTM_Zone_28N | 25828 | Europe - 18°W to 12°W and ETRS89 by country | 34.93 | -16.1 | 72.44 | -11.99 |
| ETRS_1989_UTM_Zone_29N | 25829 | Europe - 12°W to 6°W and ETRS89 by country | 34.91 | -12 | 74.13 | -6 |
| ETRS_1989_UTM_Zone_30N | 25830 | Europe - 6°W to 0°W and ETRS89 by country | 35.26 | -6 | 80.49 | 0 |
| ETRS_1989_UTM_Zone_31N | 25831 | Europe - 0°E to 6°E and ETRS89 by country | 37 | 0 | 82.45 | 6.01 |
| ETRS_1989_UTM_Zone_31N_N-zE | 5651 | Germany - west of 6°E | 50.97 | 3.34 | 55.92 | 6 |
| ETRS_1989_UTM_Zone_31N_zE-N | 5649 | Germany - west of 6°E | 50.97 | 3.34 | 55.92 | 6 |
| ETRS_1989_UTM_Zone_32N | 25832 | Europe - 6°E to 12°E and ETRS89 by country | 38.76 | 6 | 84.33 | 12 |
| ETRS_1989_UTM_Zone_32N_7stellen | 102328 | Germany - west of 12°E | 47.27 | 5.5 | 55.9 | 12 |
| ETRS_1989_UTM_Zone_32N_8stellen | 102329 | Germany - east of 12°E | 47.27 | 12 | 55.9 | 15.03 |
| ETRS_1989_UTM_Zone_32N_N-zE | 5652 | Germany - 6°E to 12°E | 47.27 | 6 | 55.47 | 12 |
| ETRS_1989_UTM_Zone_33N | 25833 | Europe - 12°E to 18°E and ETRS89 by country | 46.4 | 12 | 84.42 | 18 |
| ETRS_1989_UTM_Zone_33N_7stellen | 102359 | Germany - west of 12°E | 47.27 | 5.5 | 55.9 | 12 |
| ETRS_1989_UTM_Zone_33N_8stellen | 102360 | Germany - east of 12°E | 47.27 | 12 | 55.9 | 15.03 |
| ETRS_1989_UTM_Zone_33N_N-zE | 5653 | Germany - east of 12°E | 47.46 | 11.57 | 55.03 | 15.04 |
| ETRS_1989_UTM_Zone_33N_zE-N | 5650 | Germany - east of 12°E | 47.46 | 11.57 | 55.03 | 15.04 |
| ETRS_1989_UTM_Zone_34N | 25834 | Europe - 18°E to 24°E and ETRS89 by country | 58.84 | 18 | 84.54 | 24.01 |
| ETRS_1989_UTM_Zone_35N | 25835 | Europe - 24°E to 30°E and ETRS89 by country | 59.64 | 24 | 84.73 | 30.01 |
| ETRS_1989_UTM_Zone_36N | 25836 | Europe - 30°E to 36°E and ETRS89 by country | 61.73 | 30 | 84.7 | 36.01 |
| ETRS_1989_UTM_Zone_37N | 25837 | Europe - 36°E to 42°E and ETRS89 by country | 72.99 | 36 | 79.07 | 38 |
| ETRS_1989_UTM_Zone_38N | 25838 | Europe - 42°E to 48°E and ETRS89 by country | 37 | 42 | 41.65 | 48 |
| ETRS_1989_UTM_Zone_39N | 102099 | Europe - 48°E to 54°E | 36 | 48 | 75 | 54 |
| ETRS_1989_UTM_Zone_N32 | 4647 | Germany - 6°E to 12°E | 47.27 | 6 | 55.47 | 12 |
| ETRS_1989_UWPP_1992 | 102173 | Poland | 49 | 14.14 | 55.93 | 24.15 |
| ETRS_1989_UWPP_2000_PAS_5 | 102174 | Poland - west of 16.5°E | 50.26 | 14.14 | 55.35 | 16.5 |
| ETRS_1989_UWPP_2000_PAS_6 | 102175 | Poland - 16.5°E to 19.5°E | 49.39 | 16.5 | 55.93 | 19.5 |
| ETRS_1989_UWPP_2000_PAS_7 | 102176 | Poland - 19.5°E to 22.5°E | 49.09 | 19.5 | 54.55 | 22.5 |
| ETRS_1989_UWPP_2000_PAS_8 | 102177 | Poland - east of 22.5°E | 49 | 22.5 | 54.41 | 24.15 |
| EUREF_FIN_TM35FIN | 3067 | Finland | 58.84 | 19.08 | 70.09 | 31.59 |
| Europe_Albers_Equal_Area_Conic | 102013 | Europe | 34 | -30 | 85 | 50 |
| Europe_Equidistant_Conic | 102031 | Europe | 34 | -30 | 85 | 50 |
| Europe_Lambert_Conformal_Conic | 102014 | Europe | 34 | -30 | 85 | 50 |
| Everest_Modified_1969_RSO_Malaya_ Meters | 102061 | Malaysia - West Malaysia - onshore | 1.21 | 99.59 | 6.72 | 104.6 |
| EWR2_Grid | 9766 | UK - Oxford to Bedford | 51.7 | -1.43 | 52.24 | -0.36 |
| Fahud_UTM_Zone_39N | 23239 | Oman - onshore west of 54°E | 16.59 | 51.99 | 19.67 | 54 |
| Fahud_UTM_Zone_40N | 23240 | Oman - mainland east of 54°E | 16.89 | 54 | 26.42 | 59.91 |
| Fatu_Iva_1972_UTM_Zone_7S | 3303 | French Polynesia - Marquesas Islands - Fatu Hiva | -10.6 | -138.75 | -10.36 | -138.54 |
| FD_1954_UTM_Zone_29N | 3374 | Faroe Islands - onshore | 61.33 | -7.49 | 62.41 | -6.33 |
| FD_1958_Iraq | 3200 | Iran - FD58 | 26.21 | 47.13 | 33.22 | 53.61 |
| FEH2010_Fehmarnbelt_TM | 5596 | Europe - Fehmarnbelt outer | 54.33 | 10.66 | 54.83 | 12.01 |
| Fiji_1956_UTM_Zone_1S | 3142 | Fiji - main islands - east of 180° | -17.04 | -180 | -16.1 | -179.77 |
| Fiji_1956_UTM_Zone_60S | 3141 | Fiji - main islands - west of 180° | -19.22 | 176.81 | -16.1 | 180 |
| Fiji_1986_Fiji_Map_Grid | 3460 | Fiji - onshore | -20.81 | 176.81 | -12.42 | -178.15 |
| Finland_Zone_1 | 2391 | Finland - 19.5°E to 22.5°E onshore | 59.76 | 19.5 | 69.33 | 22.5 |
| Finland_Zone_2 | 2392 | Finland - 22.5°E to 25.5°E onshore | 59.75 | 22.5 | 68.9 | 25.5 |
| Finland_Zone_3 | 2393 | Finland - 25.5°E to 28.5°E onshore | 60.18 | 25.5 | 70.09 | 28.51 |
| Finland_Zone_4 | 2394 | Finland - 28.5°E to 31.5°E | 60.94 | 28.5 | 69.81 | 31.5 |
| Fort_Desaix_UTM_20N | 2973 | Martinique - onshore | 14.35 | -61.29 | 14.93 | -60.76 |
| Fort_Marigot_UTM_20N | 2969 | Guadeloupe - St Martin and St Barthelemy - onshore | 17.82 | -63.21 | 18.17 | -62.73 |
| Garoua_UTM_Zone_33N | 2312 | Cameroon - Garoua area | 8.92 | 12.9 | 9.87 | 14.19 |
| GD_1949_New_Zealand_Map_Grid | 27200 | New Zealand - onshore | -47.33 | 166.37 | -34.1 | 178.63 |
| GDA_1994_Australia_Albers | 3577 | Australia - onshore | -43.7 | 112.85 | -9.86 | 153.69 |
| GDA_1994_BCSG02 | 3113 | Australia - Brisbane | -29.88 | 151.19 | -24.64 | 153.69 |
| GDA_1994_CIG94 | 6721 | Christmas Island - onshore | -10.63 | 105.48 | -10.36 | 105.77 |
| GDA_1994_CKIG94 | 6723 | Cocos (Keeling) Islands - onshore | -12.27 | 96.76 | -11.76 | 96.99 |
| GDA_1994_Geoscience_Australia_ Lambert | 3112 | Australia - onshore | -43.7 | 112.85 | -9.86 | 153.69 |
| GDA_1994_MGA_zone_41 | 6732 | Heard Island and McDonald Islands - west of 66°E | -57.5 | 62.92 | -53.43 | 66 |
| GDA_1994_MGA_zone_42 | 6733 | Heard Island and McDonald Islands - 66°E to 72°E | -58.96 | 66 | -51.18 | 72.01 |
| GDA_1994_MGA_zone_43 | 6734 | Heard Island and McDonald Islands - 72°E to 78°E | -59.02 | 72 | -49.5 | 78.01 |
| GDA_1994_MGA_zone_44 | 6735 | Heard Island and McDonald Islands - east of 78°E | -58.47 | 78 | -50.65 | 83.57 |
| GDA_1994_MGA_Zone_46 | 6736 | Cocos (Keeling) Islands - west of 96°E | -15.46 | 93.41 | -8.57 | 96.01 |
| GDA_1994_MGA_Zone_47 | 6737 | Cocos (Keeling) Islands - east of 96°E | -15.56 | 96 | -8.47 | 100.34 |
| GDA_1994_MGA_Zone_48 | 28348 | Australasia - Australia and Christmas Island - west of 108°E | -34.82 | 102.14 | -8.72 | 108 |
| GDA_1994_MGA_Zone_49 | 28349 | Australasia - Australia and Christmas Island - 108°E to 114°E | -37.84 | 108 | -10.72 | 114.01 |
| GDA_1994_MGA_Zone_50 | 28350 | Australia - 114°E to 120°E | -38.53 | 114 | -12.06 | 120.01 |
| GDA_1994_MGA_Zone_51 | 28351 | Australia - 120°E to 126°E | -38.07 | 120 | -10.46 | 126.01 |
| GDA_1994_MGA_Zone_52 | 28352 | Australia - 126°E to 132°E | -37.38 | 125.99 | -9.1 | 132 |
| GDA_1994_MGA_Zone_53 | 28353 | Australia - 132°E to 138°E | -40.71 | 132 | -8.88 | 138.01 |
| GDA_1994_MGA_Zone_54 | 28354 | Australia - 138°E to 144°E | -48.19 | 138 | -9.08 | 144.01 |
| GDA_1994_MGA_Zone_55 | 28355 | Australia - 144°E to 150°E | -50.89 | 144 | -9.23 | 150.01 |
| GDA_1994_MGA_Zone_56 | 28356 | Australia - 150°E to 156°E | -58.96 | 150 | -13.87 | 156 |
| GDA_1994_MGA_Zone_57 | 28357 | Australia - 156°E to 162°E including Macquarie | -60.55 | 156 | -14.08 | 162.01 |
| GDA_1994_MGA_Zone_58 | 28358 | Australasia - Australia and Norfolk Island - 162°E to 168°E | -59.39 | 162 | -25.94 | 168 |
| GDA_1994_MGA_Zone_59 | 6738 | Norfolk Island - east of 168°E | -32.48 | 168 | -25.61 | 173.35 |
| GDA_1994_NSW_Lambert | 3308 | Australia - New South Wales | -37.53 | 140.99 | -28.15 | 153.69 |
| GDA2020_ALB2020 | 8013 | Australia - Western Australia - Albany | -35.21 | 117.55 | -34.75 | 118.22 |
| GDA2020_BCG2020 | 8016 | Australia - Western Australia - Busselton | -33.75 | 115.18 | -33.4 | 115.87 |
| GDA2020_BIO2020 | 8014 | Australia - Western Australia - Barrow | -22.2 | 114.9 | -20.21 | 115.59 |
| GDA2020_BRO2020 | 8015 | Australia - Western Australia - Broome | -18.09 | 122.08 | -16.75 | 122.62 |
| GDA2020_CARN2020 | 8017 | Australia - Western Australia - Carnarvon | -25.5 | 113.33 | -23 | 114 |
| GDA2020_CIG2020 | 8018 | Christmas Island - onshore | -10.63 | 105.48 | -10.36 | 105.77 |
| GDA2020_CKIG2020 | 8019 | Cocos (Keeling) Islands - onshore | -12.27 | 96.76 | -11.76 | 96.99 |
| GDA2020_COL2020 | 8020 | Australia - Western Australia - Collie | -34.67 | 115.73 | -33.25 | 116.4 |
| GDA2020_ESP2020 | 8021 | Australia - Western Australia - Esperance | -34.5 | 121.56 | -33.33 | 122.2 |
| GDA2020_EXM2020 | 8022 | Australia - Western Australia - Exmouth | -22.42 | 113.75 | -21.75 | 114.25 |
| GDA2020_GA_LCC | 7845 | Australia - onshore | -43.7 | 112.85 | -9.86 | 153.69 |
| GDA2020_GCG2020 | 8023 | Australia - Western Australia - Geraldton | -29.1 | 114.51 | -28.48 | 115 |
| GDA2020_GOLD2020 | 8024 | Australia - Western Australia - Kalgoorlie | -32.25 | 121 | -28.75 | 121.84 |
| GDA2020_JCG2020 | 8025 | Australia - Western Australia - Jurien Bay | -30.74 | 114.83 | -29.08 | 115.34 |
| GDA2020_KALB2020 | 8026 | Australia - Western Australia - Kalbarri | -28.5 | 113.9 | -27.16 | 114.75 |
| GDA2020_KAR2020 | 8027 | Australia - Western Australia - Karratha | -20.92 | 116.58 | -20.25 | 117.25 |
| GDA2020_KUN2020 | 8028 | Australia - Western Australia - Kununurra | -16.75 | 128.5 | -14.75 | 129 |
| GDA2020_LCG2020 | 8029 | Australia - Western Australia - Lancelin | -31.49 | 115.15 | -30.71 | 115.62 |
| GDA2020_MGA_Zone_46 | 7846 | Cocos (Keeling) Islands - west of 96°E | -15.46 | 93.41 | -8.57 | 96.01 |
| GDA2020_MGA_Zone_47 | 7847 | Cocos (Keeling) Islands - east of 96°E | -15.56 | 96 | -8.47 | 100.34 |
| GDA2020_MGA_Zone_48 | 7848 | Australasia - Australia and Christmas Island - west of 108°E | -34.68 | 102.14 | -8.87 | 108.01 |
| GDA2020_MGA_Zone_49 | 7849 | Australasia - Australia and Christmas Island - 108°E to 114°E | -37.84 | 108 | -10.72 | 114.01 |
| GDA2020_MGA_Zone_50 | 7850 | Australia - 114°E to 120°E | -38.53 | 114 | -12.06 | 120.01 |
| GDA2020_MGA_Zone_51 | 7851 | Australia - 120°E to 126°E | -38.07 | 120 | -10.46 | 126.01 |
| GDA2020_MGA_Zone_52 | 7852 | Australia - 126°E to 132°E | -37.38 | 125.99 | -9.1 | 132 |
| GDA2020_MGA_Zone_53 | 7853 | Australia - 132°E to 138°E | -40.71 | 132 | -8.88 | 138.01 |
| GDA2020_MGA_Zone_54 | 7854 | Australia - 138°E to 144°E | -48.19 | 138 | -9.08 | 144.01 |
| GDA2020_MGA_Zone_55 | 7855 | Australia - 144°E to 150°E | -50.89 | 144 | -9.23 | 150 |
| GDA2020_MGA_Zone_56 | 7856 | Australia - 150°E to 156°E | -58.96 | 150 | -13.87 | 156 |
| GDA2020_MGA_Zone_57 | 7857 | Australia - 156°E to 162°E including Macquarie | -60.56 | 156 | -14.08 | 162.01 |
| GDA2020_MGA_Zone_58 | 7858 | Australasia - Australia and Norfolk Island - 162°E to 168°E | -59.39 | 162 | -25.94 | 168 |
| GDA2020_MGA_Zone_59 | 7859 | Norfolk Island - east of 168°E | -32.48 | 168 | -25.61 | 173.35 |
| GDA2020_MRCG2020 | 8030 | Australia - Western Australia - Margaret River | -34.42 | 114.96 | -33.51 | 115.24 |
| GDA2020_NSW_Lambert | 8058 | Australia - New South Wales | -37.53 | 140.99 | -28.15 | 153.69 |
| GDA2020_PCG2020 | 8031 | Australia - Western Australia - Perth | -33.42 | 115.44 | -31.33 | 116.09 |
| GDA_1994_Perth_Coastal_Grid_1994 | 102216 | Australia - Perth Coast | -33.417 | 115.442 | -31.333 | 116.083 |
| GDA_1994_WEIPA | 8391 | Australia - Queensland - Weipa | -13.5 | 141.5 | -11.49 | 142.51 |
| GDA2020_PHG2020 | 8032 | Australia - Western Australia - Port Hedland | -20.79 | 118.25 | -20.1 | 118.97 |
| GDA_1994_South_Australia_Lambert | 3107 | Australia - SA | -38.13 | 128.99 | -25.99 | 141.01 |
| GDA2020_Vicgrid | 7899 | Australia - Victoria | -39.2 | 140.96 | -33.98 | 150.04 |
| GDA_1994_VICGRID94 | 3111 | Australia - Victoria | -39.2 | 140.96 | -33.98 | 150.04 |
| GDBD2009_GEORSO | 5247 | Brunei | 4.01 | 112.37 | 6.31 | 115.37 |
| GDM_2000_BRSO_East_Malaysia | 3376 | Malaysia - East Malaysia | 0.85 | 109.31 | 7.67 | 119.61 |
| GDM_2000_MRSO_Peninsular_Malaysia | 3375 | Malaysia - West Malaysia | 1.13 | 98.02 | 7.81 | 105.82 |
| GDM_2000_State_Cassini_Johor | 3377 | Malaysia - West Malaysia - Johor | 1.21 | 102.44 | 2.95 | 104.6 |
| GDM_2000_State_Cassini_Kelantan | 3385 | Malaysia - West Malaysia - Kelantan | 4.54 | 101.33 | 6.29 | 102.67 |
| GDM_2000_State_Cassini_Negeri_ Sembilan_and_Melaka | 3378 | Malaysia - West Malaysia - Sembilan and Melaka | 2.03 | 101.7 | 3.28 | 102.71 |
| GDM_2000_State_Cassini_Pahang | 3379 | Malaysia - West Malaysia - Pahang | 2.45 | 101.33 | 4.78 | 103.67 |
| GDM_2000_State_Cassini_Perak | 3384 | Malaysia - West Malaysia - Perak | 3.66 | 100.07 | 5.92 | 102 |
| GDM_2000_State_Cassini_Perlis | 3383 | Malaysia - West Malaysia - Kedah and Perlis | 5.08 | 99.59 | 6.72 | 101.12 |
| GDM_2000_State_Cassini_Pulau_Pinang_ and_Seberang_Perai | 3382 | Malaysia - West Malaysia - Pulau Pinang | 5.12 | 100.12 | 5.59 | 100.56 |
| GDM_2000_State_Cassini_Selangor | 3380 | Malaysia - West Malaysia - Selangor | 2.54 | 100.76 | 3.87 | 101.97 |
| GDM_2000_State_Cassini_Terengganu | 3381 | Malaysia - West Malaysia - Terengganu | 3.89 | 102.38 | 5.9 | 103.72 |
| GDM2008_LGM2012 | 103872 | Mauritius | -23.81 | 53.8 | -8.43 | 67.05 |
| Germany_Zone_1 | 31491 | Germany - offshore North Sea west of 4.5°E | 55.24 | 3.34 | 55.92 | 4.5 |
| Germany_Zone_2 | 31492 | Germany - West Germany - west of 7.5°E | 49.11 | 5.86 | 53.81 | 7.5 |
| Germany_Zone_3 | 31493 | Germany - West- Germany - 7.5°E to 10.5°E | 47.27 | 7.5 | 55.09 | 10.51 |
| Germany_Zone_4 | 31494 | Germany - West Germany - 10.5°E to 13.5°E | 47.39 | 10.5 | 54.59 | 13.51 |
| Germany_Zone_5 | 31495 | Germany - West Germany - east of 13.5°E | 48.51 | 13.5 | 48.98 | 13.84 |
| Ghana_Metre_Grid | 25000 | Ghana | 1.4 | -3.79 | 11.16 | 2.1 |
| GOES-16_East_ABI_Fixed_Grid_ITRF2008 | 102498 | GOES-16 East Full disk | -81.3282 | -156.2995 | 81.3282 | 6.2995 |
| GR96_EPSG_Arctic_zone_1-25 | 6050 | Arctic - 87°50'N to 82°50'N, 60°W to 0°E | 82.83 | -60 | 87.84 | 0 |
| GR96_EPSG_Arctic_zone_2-18 | 6051 | Arctic - 84°30'N to 79°30'N, 72°W to 32°W | 79.5 | -72 | 84.51 | -32 |
| GR96_EPSG_Arctic_zone_2-20 | 6052 | Arctic - 84°30'N to 79°30'N, 32°W to 8°E | 79.5 | -32 | 84.51 | 8.01 |
| GR96_EPSG_Arctic_zone_3-29 | 6053 | Arctic - 81°10'N to 76°10'N, Greenland west of 54°W | 76.16 | -75 | 81.17 | -54 |
| GR96_EPSG_Arctic_zone_3-31 | 6054 | Arctic - 81°10'N to 76°10'N, 54°W to 24°W | 76.16 | -54 | 81.17 | -24 |
| GR96_EPSG_Arctic_zone_3-33 | 6055 | Arctic - 81°10'N to 76°10'N, 24°W to 3°E | 76.16 | -24 | 81.17 | 1.89 |
| GR96_EPSG_Arctic_zone_4-20 | 6056 | Arctic - 77°50'N to 72°50'N, 76°W to 51°W | 72.83 | -76 | 77.84 | -51 |
| GR96_EPSG_Arctic_zone_4-22 | 6057 | Arctic - 77°50'N to 72°50'N, 51°W to 26°W | 72.83 | -51 | 77.84 | -26 |
| GR96_EPSG_Arctic_zone_4-24 | 6058 | Arctic - 77°50'N to 72°50'N, 26°W to 2°W | 72.83 | -26 | 77.84 | -2 |
| GR96_EPSG_Arctic_zone_5-41 | 6059 | Arctic - 74°30'N to 69°30'N, 72°W to 52°W | 69.48 | -71.89 | 74.51 | -51.99 |
| GR96_EPSG_Arctic_zone_5-43 | 6060 | Arctic - 74°30'N to 69°30'N, 52°W to 32°W | 69.5 | -52 | 74.51 | -32 |
| GR96_EPSG_Arctic_zone_5-45 | 6061 | Arctic - 74°30'N to 69°30'N, 32°W to 12°W | 69.5 | -32 | 74.51 | -12 |
| GR96_EPSG_Arctic_zone_6-26 | 6062 | Arctic - 71°10'N to 66°10'N, 65°W to 47°W | 66.16 | -65 | 71.17 | -47 |
| GR96_EPSG_Arctic_zone_6-28 | 6063 | Arctic - 71°10'N to 66°10'N, 47°W to 29°W | 66.16 | -47 | 71.17 | -29 |
| GR96_EPSG_Arctic_zone_6-30 | 6064 | Arctic - 71°10'N to 66°10'N, 29°W to 11°W | 66.16 | -29 | 71.17 | -11 |
| GR96_EPSG_Arctic_zone_7-11 | 6065 | Arctic - 67°50'N to 62°50'N, 59°W to 42°W | 62.83 | -59 | 67.84 | -42 |
| GR96_EPSG_Arctic_zone_7-13 | 6066 | Arctic - 67°50'N to 62°50'N, 42°W to 25°W | 62.83 | -42 | 67.84 | -25 |
| GR96_EPSG_Arctic_zone_8-20 | 6067 | Arctic - 64°30'N to 59°30'N, 59°W to 44°W | 59.5 | -59 | 64.51 | -44 |
| GR96_EPSG_Arctic_zone_8-22 | 6068 | Arctic - 64°30'N to 59°30'N, 44°W to 29°W | 59.5 | -44 | 64.51 | -29 |
| Graciosa_Base_SW_1948_UTM_Zone_ 26N | 102162 | Portugal - Azores C - onshore | 38.32 | -28.9 | 39.14 | -26.97 |
| Grand_Cayman_1959_UTM_Zone_17N | 3356 | Cayman Islands - Grand Cayman | 19.21 | -81.46 | 19.41 | -81.04 |
| Grand_Cayman_National_Grid_1959 | 6128 | Cayman Islands - Grand Cayman | 19.21 | -81.46 | 19.41 | -81.04 |
| Grand_Comoros_UTM_38S | 2999 | Comoros - Njazidja (Grande Comore) | -11.99 | 43.16 | -11.31 | 43.55 |
| Greek_Grid | 2100 | Greece - onshore | 34.88 | 19.57 | 41.75 | 28.3 |
| Greenland_1996_UTM_Zone_18N | 3178 | Greenland - west of 72°W | 74.52 | -75 | 79.04 | -72 |
| Greenland_1996_UTM_Zone_19N | 3179 | Greenland - 72°W to 66°W | 73.24 | -72 | 80.9 | -66 |
| Greenland_1996_UTM_Zone_20N | 3180 | Greenland - 66°W to 60°W | 68.92 | -66 | 82.22 | -60 |
| Greenland_1996_UTM_Zone_21N | 3181 | Greenland - 60°W to 54°W | 58.91 | -60 | 84 | -54 |
| Greenland_1996_UTM_Zone_22N | 3182 | Greenland - 54°W to 48°W | 56.9 | -54 | 84 | -48 |
| Greenland_1996_UTM_Zone_23N | 3183 | Greenland - 48°W to 42°W | 56.38 | -48 | 84 | -42 |
| Greenland_1996_UTM_Zone_24N | 3184 | Greenland - 42°W to 36°W | 56.56 | -42 | 84 | -36 |
| Greenland_1996_UTM_Zone_25N | 3185 | Greenland - 36°W to 30°W | 60.16 | -36 | 84 | -30 |
| Greenland_1996_UTM_Zone_26N | 3186 | Greenland - 30°W to 24°W | 64.96 | -30 | 84 | -24 |
| Greenland_1996_UTM_Zone_27N | 3187 | Greenland - 24°W to 18°W | 67.7 | -24 | 84 | -18 |
| Greenland_1996_UTM_Zone_28N | 3188 | Greenland - 18°W to 12°W | 68.67 | -18 | 84 | -12 |
| Greenland_1996_UTM_Zone_29N | 3189 | Greenland - 12°W to 6°W | 72.43 | -12 | 84 | -6 |
| Grenada_1953_British_West_Indies_Grid | 2003 | Grenada and southern Grenadines - onshore | 11.94 | -61.84 | 12.57 | -61.35 |
| GSK-2011_Gauss-Kruger_CM_105E | 21018 | Russia - 102°E to 108°E onshore | 49.64 | 102 | 79.48 | 108 |
| GSK-2011_Gauss-Kruger_CM_111E | 21019 | Russia - 108°E to 114°E onshore | 49.14 | 108 | 76.81 | 114 |
| GSK-2011_Gauss-Kruger_CM_117E | 21020 | Russia - 114°E to 120°E onshore | 49.51 | 114 | 75.96 | 120 |
| GSK-2011_Gauss-Kruger_CM_123E | 21021 | Russia - 120°E to 126°E onshore | 51.51 | 120 | 74 | 126 |
| GSK-2011_Gauss-Kruger_CM_129E | 21022 | Russia - 126°E to 132°E onshore | 42.25 | 126 | 73.61 | 132 |
| GSK-2011_Gauss-Kruger_CM_135E | 21023 | Russia - 132°E to 138°E onshore | 42.63 | 132 | 76.15 | 138 |
| GSK-2011_Gauss-Kruger_CM_141E | 21024 | Russia - 138°E to 144°E onshore | 45.84 | 138 | 76.27 | 144 |
| GSK-2011_Gauss-Kruger_CM_147E | 21025 | Russia - 144°E to 150°E onshore | 43.6 | 144 | 76.82 | 150 |
| GSK-2011_Gauss-Kruger_CM_153E | 21026 | Russia - 150°E to 156°E onshore | 45.77 | 150 | 76.26 | 156 |
| GSK-2011_Gauss-Kruger_CM_159E | 21027 | Russia - 156°E to 162°E onshore | 50.27 | 156 | 77.2 | 162 |
| GSK-2011_Gauss-Kruger_CM_165E | 21028 | Russia - 162°E to 168°E onshore | 54.47 | 162 | 70.03 | 168 |
| GSK-2011_Gauss-Kruger_CM_171E | 21029 | Russia - 168°E to 174°E onshore | 54.45 | 168 | 70.19 | 174 |
| GSK-2011_Gauss-Kruger_CM_171W | 21032 | Russia - east of 174°W onshore | 64.2 | -174 | 67.18 | -168.97 |
| GSK-2011_Gauss-Kruger_CM_177E | 21030 | Russia - 174°E to 180°E onshore | 61.65 | 174 | 71.59 | 180 |
| GSK-2011_Gauss-Kruger_CM_177W | 21031 | Russia - 180° to 174°W onshore | 64.35 | -180 | 71.65 | -174 |
| GSK-2011_Gauss-Kruger_CM_21E | 21004 | Russia - west of 24°E onshore | 54.32 | 19.57 | 55.32 | 22.87 |
| GSK-2011_Gauss-Kruger_CM_27E | 21005 | Russia - 24°E to 30°E onshore | 55.69 | 26.61 | 69.47 | 30 |
| GSK-2011_Gauss-Kruger_CM_33E | 21006 | Russia - 30°E to 36°E onshore | 50.34 | 30 | 70.02 | 36 |
| GSK-2011_Gauss-Kruger_CM_39E | 21007 | Russia - 36°E to 42°E onshore | 43.18 | 36 | 69.23 | 42.01 |
| GSK-2011_Gauss-Kruger_CM_45E | 21008 | Russia - 42°E to 48°E onshore | 41.19 | 42 | 80.91 | 48 |
| GSK-2011_Gauss-Kruger_CM_51E | 21009 | Russia - 48°E to 54°E onshore | 41.39 | 48 | 81.4 | 54 |
| GSK-2011_Gauss-Kruger_CM_57E | 21010 | Russia - 54°E to 60°E onshore | 50.47 | 54 | 81.91 | 60 |
| GSK-2011_Gauss-Kruger_CM_63E | 21011 | Russia - 60°E to 66°E onshore | 50.66 | 60 | 81.77 | 66 |
| GSK-2011_Gauss-Kruger_CM_69E | 21012 | Russia - 66°E to 72°E onshore | 54.1 | 66 | 77.07 | 72 |
| GSK-2011_Gauss-Kruger_CM_75E | 21013 | Russia - 72°E to 78°E onshore | 53.17 | 72 | 79.71 | 78 |
| GSK-2011_Gauss-Kruger_CM_81E | 21014 | Russia - 78°E to 84°E onshore | 50.69 | 78 | 81.03 | 84 |
| GSK-2011_Gauss-Kruger_CM_87E | 21015 | Russia - 84°E to 90°E onshore | 49.07 | 84 | 81.27 | 90 |
| GSK-2011_Gauss-Kruger_CM_93E | 21016 | Russia - 90°E to 96°E onshore | 49.89 | 90 | 81.35 | 96 |
| GSK-2011_Gauss-Kruger_CM_99E | 21017 | Russia - 96°E to 102°E onshore | 49.73 | 96 | 81.32 | 102 |
| GSK-2011_Gauss-Kruger_zone_10 | 20910 | Russia - 54°E to 60°E onshore | 50.47 | 54 | 81.91 | 60 |
| GSK-2011_Gauss-Kruger_zone_11 | 20911 | Russia - 60°E to 66°E onshore | 50.66 | 60 | 81.77 | 66 |
| GSK-2011_Gauss-Kruger_zone_12 | 20912 | Russia - 66°E to 72°E onshore | 54.1 | 66 | 77.07 | 72 |
| GSK-2011_Gauss-Kruger_zone_13 | 20913 | Russia - 72°E to 78°E onshore | 53.17 | 72 | 79.71 | 78 |
| GSK-2011_Gauss-Kruger_zone_14 | 20914 | Russia - 78°E to 84°E onshore | 50.69 | 78 | 81.03 | 84 |
| GSK-2011_Gauss-Kruger_zone_15 | 20915 | Russia - 84°E to 90°E onshore | 49.07 | 84 | 81.27 | 90 |
| GSK-2011_Gauss-Kruger_zone_16 | 20916 | Russia - 90°E to 96°E onshore | 49.89 | 90 | 81.35 | 96 |
| GSK-2011_Gauss-Kruger_zone_17 | 20917 | Russia - 96°E to 102°E onshore | 49.73 | 96 | 81.32 | 102 |
| GSK-2011_Gauss-Kruger_zone_18 | 20918 | Russia - 102°E to 108°E onshore | 49.64 | 102 | 79.48 | 108 |
| GSK-2011_Gauss-Kruger_zone_19 | 20919 | Russia - 108°E to 114°E onshore | 49.14 | 108 | 76.81 | 114 |
| GSK-2011_Gauss-Kruger_zone_20 | 20920 | Russia - 114°E to 120°E onshore | 49.51 | 114 | 75.96 | 120 |
| GSK-2011_Gauss-Kruger_zone_21 | 20921 | Russia - 120°E to 126°E onshore | 51.51 | 120 | 74 | 126 |
| GSK-2011_Gauss-Kruger_zone_22 | 20922 | Russia - 126°E to 132°E onshore | 42.25 | 126 | 73.61 | 132 |
| GSK-2011_Gauss-Kruger_zone_23 | 20923 | Russia - 132°E to 138°E onshore | 42.63 | 132 | 76.15 | 138 |
| GSK-2011_Gauss-Kruger_zone_24 | 20924 | Russia - 138°E to 144°E onshore | 45.84 | 138 | 76.27 | 144 |
| GSK-2011_Gauss-Kruger_zone_25 | 20925 | Russia - 144°E to 150°E onshore | 43.6 | 144 | 76.82 | 150 |
| GSK-2011_Gauss-Kruger_zone_26 | 20926 | Russia - 150°E to 156°E onshore | 45.77 | 150 | 76.26 | 156 |
| GSK-2011_Gauss-Kruger_zone_27 | 20927 | Russia - 156°E to 162°E onshore | 50.27 | 156 | 77.2 | 162 |
| GSK-2011_Gauss-Kruger_zone_28 | 20928 | Russia - 162°E to 168°E onshore | 54.47 | 162 | 70.03 | 168 |
| GSK-2011_Gauss-Kruger_zone_29 | 20929 | Russia - 168°E to 174°E onshore | 54.45 | 168 | 70.19 | 174 |
| GSK-2011_Gauss-Kruger_zone_30 | 20930 | Russia - 174°E to 180°E onshore | 61.65 | 174 | 71.59 | 180 |
| GSK-2011_Gauss-Kruger_zone_31 | 20931 | Russia - 180° to 174°W onshore | 64.35 | -180 | 71.65 | -174 |
| GSK-2011_Gauss-Kruger_zone_32 | 20932 | Russia - east of 174°W onshore | 64.2 | -174 | 67.18 | -168.97 |
| GSK-2011_Gauss-Kruger_zone_4 | 20904 | Russia - west of 24°E onshore | 54.32 | 19.57 | 55.32 | 22.87 |
| GSK-2011_Gauss-Kruger_zone_5 | 20905 | Russia - 24°E to 30°E onshore | 55.69 | 26.61 | 69.47 | 30 |
| GSK-2011_Gauss-Kruger_zone_6 | 20906 | Russia - 30°E to 36°E onshore | 50.34 | 30 | 70.02 | 36 |
| GSK-2011_Gauss-Kruger_zone_7 | 20907 | Russia - 36°E to 42°E onshore | 43.18 | 36 | 69.23 | 42.01 |
| GSK-2011_Gauss-Kruger_zone_8 | 20908 | Russia - 42°E to 48°E onshore | 41.19 | 42 | 80.91 | 48 |
| GSK-2011_Gauss-Kruger_zone_9 | 20909 | Russia - 48°E to 54°E onshore | 41.39 | 48 | 81.4 | 54 |
| GSK-2011_GSK_3GK_CM_102E | 21334 | Russia - 100.5°E to 103.5°E onshore | 50.17 | 100.5 | 79.71 | 103.5 |
| GSK-2011_GSK_3GK_CM_105E | 21335 | Russia - 103.5°E to 106.5°E onshore | 50.13 | 103.5 | 79.21 | 106.5 |
| GSK-2011_GSK_3GK_CM_108E | 21336 | Russia - 106.5°E to 109.5°E onshore | 49.25 | 106.5 | 78.4 | 109.5 |
| GSK-2011_GSK_3GK_CM_111E | 21337 | Russia - 109.5°E to 112.5°E onshore | 49.14 | 109.5 | 76.81 | 112.5 |
| GSK-2011_GSK_3GK_CM_114E | 21338 | Russia - 112.5°E to 115.5°E onshore | 49.49 | 112.5 | 76.7 | 115.5 |
| GSK-2011_GSK_3GK_CM_117E | 21339 | Russia - 115.5°E to 118.5°E onshore | 49.51 | 115.5 | 74.43 | 118.5 |
| GSK-2011_GSK_3GK_CM_120E | 21340 | Russia - 118.5°E to 121.5°E onshore | 49.87 | 118.5 | 73.63 | 121.5 |
| GSK-2011_GSK_3GK_CM_123E | 21341 | Russia - 121.5°E to 124.5°E onshore | 53.18 | 121.5 | 74 | 124.5 |
| GSK-2011_GSK_3GK_CM_126E | 21342 | Russia - 124.5°E to 127.5°E onshore | 49.88 | 124.5 | 74 | 127.5 |
| GSK-2011_GSK_3GK_CM_129E | 21343 | Russia - 127.5°E to 130.5°E onshore | 42.67 | 127.5 | 73.59 | 130.5 |
| GSK-2011_GSK_3GK_CM_132E | 21344 | Russia - 130.5°E to 133.5°E onshore | 42.25 | 130.5 | 71.99 | 133.5 |
| GSK-2011_GSK_3GK_CM_135E | 21345 | Russia - 133.5°E to 136.5°E onshore | 42.74 | 133.5 | 75.9 | 136.5 |
| GSK-2011_GSK_3GK_CM_138E | 21346 | Russia - 136.5°E to 139.5°E onshore | 44.76 | 136.5 | 76.27 | 139.5 |
| GSK-2011_GSK_3GK_CM_141E | 21347 | Russia - 139.5°E to 142.5°E onshore | 45.84 | 139.5 | 76.23 | 142.5 |
| GSK-2011_GSK_3GK_CM_144E | 21348 | Russia - 142.5°E to 145.5°E onshore | 43.61 | 142.5 | 75.98 | 145.5 |
| GSK-2011_GSK_3GK_CM_147E | 21349 | Russia - 145.5°E to 148.5°E onshore | 43.6 | 145.5 | 76.76 | 148.5 |
| GSK-2011_GSK_3GK_CM_150E | 21350 | Russia - 148.5°E to 151.5°E onshore | 45.21 | 148.5 | 76.82 | 151.5 |
| GSK-2011_GSK_3GK_CM_153E | 21351 | Russia - 151.5°E to 154.5°E onshore | 46.72 | 151.5 | 76.26 | 154.5 |
| GSK-2011_GSK_3GK_CM_156E | 21352 | Russia - 154.5°E to 157.5°E onshore | 49.02 | 154.5 | 77.2 | 157.5 |
| GSK-2011_GSK_3GK_CM_159E | 21353 | Russia - 157.5°E to 160.5°E onshore | 51.36 | 157.5 | 71.12 | 160.5 |
| GSK-2011_GSK_3GK_CM_162E | 21354 | Russia - 160.5°E to 163.5°E onshore | 54.34 | 160.5 | 70.98 | 163.5 |
| GSK-2011_GSK_3GK_CM_165E | 21355 | Russia - 163.5°E to 166.5°E onshore | 54.69 | 163.5 | 69.82 | 166.5 |
| GSK-2011_GSK_3GK_CM_168E | 21356 | Russia - 166.5°E to 169.5°E onshore | 54.45 | 166.5 | 70.07 | 169.5 |
| GSK-2011_GSK_3GK_CM_168W | 21364 | Russia - east of 169.5°W onshore | 65.7 | -169.22 | 65.86 | -168.97 |
| GSK-2011_GSK_3GK_CM_171E | 21357 | Russia - 169.5°E to 172.5°E onshore | 59.86 | 169.5 | 70.19 | 172.5 |
| GSK-2011_GSK_3GK_CM_171W | 21363 | Russia - 172.5°W to 169.5°W onshore | 64.35 | -172.5 | 67.06 | -169.57 |
| GSK-2011_GSK_3GK_CM_174E | 21358 | Russia - 172.5°E to 175.5°E onshore | 60.99 | 172.5 | 70.02 | 175.5 |
| GSK-2011_GSK_3GK_CM_174W | 21362 | Russia - 175.5°W to 172.5°W onshore | 64.2 | -175.5 | 67.78 | -172.5 |
| GSK-2011_GSK_3GK_CM_177E | 21359 | Russia - 175.5°E to 178.5°E onshore | 62.09 | 175.5 | 71.1 | 178.5 |
| GSK-2011_GSK_3GK_CM_177W | 21361 | Russia - 178.5°W to 175.5°W onshore | 64.74 | -178.5 | 71.61 | -175.5 |
| GSK-2011_GSK_3GK_CM_180E | 21360 | Russia - 178.5°E to 178.5°W onshore | 62.24 | 178.5 | 71.65 | -178.5 |
| GSK-2011_GSK_3GK_CM_21E | 21307 | Russia - 19.5°E to 22.5°E onshore | 54.32 | 19.57 | 55.32 | 22.5 |
| GSK-2011_GSK_3GK_CM_24E | 21308 | Russia - 22.5°E to 25.5°E onshore | 54.34 | 22.5 | 55.07 | 22.87 |
| GSK-2011_GSK_3GK_CM_27E | 21309 | Russia - 25.5°E to 28.5°E onshore | 56.05 | 26.61 | 68.93 | 28.51 |
| GSK-2011_GSK_3GK_CM_30E | 21310 | Russia - 28.5°E to 31.5°E onshore | 52.85 | 28.5 | 69.85 | 31.5 |
| GSK-2011_GSK_3GK_CM_33E | 21311 | Russia - 31.5°E to 34.5°E onshore | 51.24 | 31.5 | 70.02 | 34.5 |
| GSK-2011_GSK_3GK_CM_36E | 21312 | Russia - 34.5°E to 37.5°E onshore | 44.61 | 34.5 | 69.39 | 37.51 |
| GSK-2011_GSK_3GK_CM_39E | 21313 | Russia - 37.5°E to 40.5°E onshore | 43.33 | 37.5 | 68.8 | 40.5 |
| GSK-2011_GSK_3GK_CM_42E | 21314 | Russia - 40.5°E to 43.5°E onshore | 42.87 | 40.5 | 68.74 | 43.5 |
| GSK-2011_GSK_3GK_CM_45E | 21315 | Russia - 43.5°E to 46.5°E onshore | 41.89 | 43.5 | 80.8 | 46.5 |
| GSK-2011_GSK_3GK_CM_48E | 21316 | Russia - 46.5°E to 49.5°E onshore | 41.19 | 46.5 | 80.91 | 49.5 |
| GSK-2011_GSK_3GK_CM_51E | 21317 | Russia - 49.5°E to 52.5°E onshore | 42.36 | 49.5 | 81.22 | 52.5 |
| GSK-2011_GSK_3GK_CM_54E | 21318 | Russia - 52.5°E to 55.5°E onshore | 50.52 | 52.5 | 81.41 | 55.5 |
| GSK-2011_GSK_3GK_CM_57E | 21319 | Russia - 55.5°E to 58.5°E onshore | 50.53 | 55.5 | 81.89 | 58.5 |
| GSK-2011_GSK_3GK_CM_60E | 21320 | Russia - 58.5°E to 61.5°E onshore | 50.47 | 58.5 | 81.91 | 61.5 |
| GSK-2011_GSK_3GK_CM_63E | 21321 | Russia - 61.5°E to 64.5°E onshore | 51.03 | 61.5 | 81.77 | 64.5 |
| GSK-2011_GSK_3GK_CM_66E | 21322 | Russia - 64.5°E to 67.5°E onshore | 54.31 | 64.5 | 81.25 | 67.5 |
| GSK-2011_GSK_3GK_CM_69E | 21323 | Russia - 67.5°E to 70.5°E onshore | 54.85 | 67.5 | 77.07 | 70.5 |
| GSK-2011_GSK_3GK_CM_72E | 21324 | Russia - 70.5°E to 73.5°E onshore | 53.43 | 70.5 | 73.57 | 73.5 |
| GSK-2011_GSK_3GK_CM_75E | 21325 | Russia - 73.5°E to 76.5°E onshore | 53.47 | 73.5 | 79.71 | 76.5 |
| GSK-2011_GSK_3GK_CM_78E | 21326 | Russia - 76.5°E to 79.5°E onshore | 51.49 | 76.5 | 81.03 | 79.5 |
| GSK-2011_GSK_3GK_CM_81E | 21327 | Russia - 79.5°E to 82.5°E onshore | 50.7 | 79.5 | 81.03 | 82.5 |
| GSK-2011_GSK_3GK_CM_84E | 21328 | Russia - 82.5°E to 85.5°E onshore | 49.58 | 82.5 | 77.56 | 85.5 |
| GSK-2011_GSK_3GK_CM_87E | 21329 | Russia - 85.5°E to 88.5°E onshore | 49.07 | 85.5 | 77.16 | 88.5 |
| GSK-2011_GSK_3GK_CM_90E | 21330 | Russia - 88.5°E to 91.5°E onshore | 49.44 | 88.5 | 81.28 | 91.5 |
| GSK-2011_GSK_3GK_CM_93E | 21331 | Russia - 91.5°E to 94.5°E onshore | 50.16 | 91.5 | 81.26 | 94.5 |
| GSK-2011_GSK_3GK_CM_96E | 21332 | Russia - 94.5°E to 97.5°E onshore | 49.73 | 94.5 | 81.35 | 97.5 |
| GSK-2011_GSK_3GK_CM_99E | 21333 | Russia - 97.5°E to 100.5°E onshore | 49.79 | 97.5 | 80.9 | 100.5 |
| GSK-2011_GSK_3GK_zone_10 | 21210 | Russia - 28.5°E to 31.5°E onshore | 52.85 | 28.5 | 69.85 | 31.5 |
| GSK-2011_GSK_3GK_zone_11 | 21211 | Russia - 31.5°E to 34.5°E onshore | 51.24 | 31.5 | 70.02 | 34.5 |
| GSK-2011_GSK_3GK_zone_12 | 21212 | Russia - 34.5°E to 37.5°E onshore | 44.61 | 34.5 | 69.39 | 37.51 |
| GSK-2011_GSK_3GK_zone_13 | 21213 | Russia - 37.5°E to 40.5°E onshore | 43.33 | 37.5 | 68.8 | 40.5 |
| GSK-2011_GSK_3GK_zone_14 | 21214 | Russia - 40.5°E to 43.5°E onshore | 42.87 | 40.5 | 68.74 | 43.5 |
| GSK-2011_GSK_3GK_zone_15 | 21215 | Russia - 43.5°E to 46.5°E onshore | 41.89 | 43.5 | 80.8 | 46.5 |
| GSK-2011_GSK_3GK_zone_16 | 21216 | Russia - 46.5°E to 49.5°E onshore | 41.19 | 46.5 | 80.91 | 49.5 |
| GSK-2011_GSK_3GK_zone_17 | 21217 | Russia - 49.5°E to 52.5°E onshore | 42.36 | 49.5 | 81.22 | 52.5 |
| GSK-2011_GSK_3GK_zone_18 | 21218 | Russia - 52.5°E to 55.5°E onshore | 50.52 | 52.5 | 81.41 | 55.5 |
| GSK-2011_GSK_3GK_zone_19 | 21219 | Russia - 55.5°E to 58.5°E onshore | 50.53 | 55.5 | 81.89 | 58.5 |
| GSK-2011_GSK_3GK_zone_20 | 21220 | Russia - 58.5°E to 61.5°E onshore | 50.47 | 58.5 | 81.91 | 61.5 |
| GSK-2011_GSK_3GK_zone_21 | 21221 | Russia - 61.5°E to 64.5°E onshore | 51.03 | 61.5 | 81.77 | 64.5 |
| GSK-2011_GSK_3GK_zone_22 | 21222 | Russia - 64.5°E to 67.5°E onshore | 54.31 | 64.5 | 81.25 | 67.5 |
| GSK-2011_GSK_3GK_zone_23 | 21223 | Russia - 67.5°E to 70.5°E onshore | 54.85 | 67.5 | 77.07 | 70.5 |
| GSK-2011_GSK_3GK_zone_24 | 21224 | Russia - 70.5°E to 73.5°E onshore | 53.43 | 70.5 | 73.57 | 73.5 |
| GSK-2011_GSK_3GK_zone_25 | 21225 | Russia - 73.5°E to 76.5°E onshore | 53.47 | 73.5 | 79.71 | 76.5 |
| GSK-2011_GSK_3GK_zone_26 | 21226 | Russia - 76.5°E to 79.5°E onshore | 51.49 | 76.5 | 81.03 | 79.5 |
| GSK-2011_GSK_3GK_zone_27 | 21227 | Russia - 79.5°E to 82.5°E onshore | 50.7 | 79.5 | 81.03 | 82.5 |
| GSK-2011_GSK_3GK_zone_28 | 21228 | Russia - 82.5°E to 85.5°E onshore | 49.58 | 82.5 | 77.56 | 85.5 |
| GSK-2011_GSK_3GK_zone_29 | 21229 | Russia - 85.5°E to 88.5°E onshore | 49.07 | 85.5 | 77.16 | 88.5 |
| GSK-2011_GSK_3GK_zone_30 | 21230 | Russia - 88.5°E to 91.5°E onshore | 49.44 | 88.5 | 81.28 | 91.5 |
| GSK-2011_GSK_3GK_zone_31 | 21231 | Russia - 91.5°E to 94.5°E onshore | 50.16 | 91.5 | 81.26 | 94.5 |
| GSK-2011_GSK_3GK_zone_32 | 21232 | Russia - 94.5°E to 97.5°E onshore | 49.73 | 94.5 | 81.35 | 97.5 |
| GSK-2011_GSK_3GK_zone_33 | 21233 | Russia - 97.5°E to 100.5°E onshore | 49.79 | 97.5 | 80.9 | 100.5 |
| GSK-2011_GSK_3GK_zone_34 | 21234 | Russia - 100.5°E to 103.5°E onshore | 50.17 | 100.5 | 79.71 | 103.5 |
| GSK-2011_GSK_3GK_zone_35 | 21235 | Russia - 103.5°E to 106.5°E onshore | 50.13 | 103.5 | 79.21 | 106.5 |
| GSK-2011_GSK_3GK_zone_36 | 21236 | Russia - 106.5°E to 109.5°E onshore | 49.25 | 106.5 | 78.4 | 109.5 |
| GSK-2011_GSK_3GK_zone_37 | 21237 | Russia - 109.5°E to 112.5°E onshore | 49.14 | 109.5 | 76.81 | 112.5 |
| GSK-2011_GSK_3GK_zone_38 | 21238 | Russia - 112.5°E to 115.5°E onshore | 49.49 | 112.5 | 76.7 | 115.5 |
| GSK-2011_GSK_3GK_zone_39 | 21239 | Russia - 115.5°E to 118.5°E onshore | 49.51 | 115.5 | 74.43 | 118.5 |
| GSK-2011_GSK_3GK_zone_40 | 21240 | Russia - 118.5°E to 121.5°E onshore | 49.87 | 118.5 | 73.63 | 121.5 |
| GSK-2011_GSK_3GK_zone_41 | 21241 | Russia - 121.5°E to 124.5°E onshore | 53.18 | 121.5 | 74 | 124.5 |
| GSK-2011_GSK_3GK_zone_42 | 21242 | Russia - 124.5°E to 127.5°E onshore | 49.88 | 124.5 | 74 | 127.5 |
| GSK-2011_GSK_3GK_zone_43 | 21243 | Russia - 127.5°E to 130.5°E onshore | 42.67 | 127.5 | 73.59 | 130.5 |
| GSK-2011_GSK_3GK_zone_44 | 21244 | Russia - 130.5°E to 133.5°E onshore | 42.25 | 130.5 | 71.99 | 133.5 |
| GSK-2011_GSK_3GK_zone_45 | 21245 | Russia - 133.5°E to 136.5°E onshore | 42.74 | 133.5 | 75.9 | 136.5 |
| GSK-2011_GSK_3GK_zone_46 | 21246 | Russia - 136.5°E to 139.5°E onshore | 44.76 | 136.5 | 76.27 | 139.5 |
| GSK-2011_GSK_3GK_zone_47 | 21247 | Russia - 139.5°E to 142.5°E onshore | 45.84 | 139.5 | 76.23 | 142.5 |
| GSK-2011_GSK_3GK_zone_48 | 21248 | Russia - 142.5°E to 145.5°E onshore | 43.61 | 142.5 | 75.98 | 145.5 |
| GSK-2011_GSK_3GK_zone_49 | 21249 | Russia - 145.5°E to 148.5°E onshore | 43.6 | 145.5 | 76.76 | 148.5 |
| GSK-2011_GSK_3GK_zone_50 | 21250 | Russia - 148.5°E to 151.5°E onshore | 45.21 | 148.5 | 76.82 | 151.5 |
| GSK-2011_GSK_3GK_zone_51 | 21251 | Russia - 151.5°E to 154.5°E onshore | 46.72 | 151.5 | 76.26 | 154.5 |
| GSK-2011_GSK_3GK_zone_52 | 21252 | Russia - 154.5°E to 157.5°E onshore | 49.02 | 154.5 | 77.2 | 157.5 |
| GSK-2011_GSK_3GK_zone_53 | 21253 | Russia - 157.5°E to 160.5°E onshore | 51.36 | 157.5 | 71.12 | 160.5 |
| GSK-2011_GSK_3GK_zone_54 | 21254 | Russia - 160.5°E to 163.5°E onshore | 54.34 | 160.5 | 70.98 | 163.5 |
| GSK-2011_GSK_3GK_zone_55 | 21255 | Russia - 163.5°E to 166.5°E onshore | 54.69 | 163.5 | 69.82 | 166.5 |
| GSK-2011_GSK_3GK_zone_56 | 21256 | Russia - 166.5°E to 169.5°E onshore | 54.45 | 166.5 | 70.07 | 169.5 |
| GSK-2011_GSK_3GK_zone_57 | 21257 | Russia - 169.5°E to 172.5°E onshore | 59.86 | 169.5 | 70.19 | 172.5 |
| GSK-2011_GSK_3GK_zone_58 | 21258 | Russia - 172.5°E to 175.5°E onshore | 60.99 | 172.5 | 70.02 | 175.5 |
| GSK-2011_GSK_3GK_zone_59 | 21259 | Russia - 175.5°E to 178.5°E onshore | 62.09 | 175.5 | 71.1 | 178.5 |
| GSK-2011_GSK_3GK_zone_60 | 21260 | Russia - 178.5°E to 178.5°W onshore | 62.24 | 178.5 | 71.65 | -178.5 |
| GSK-2011_GSK_3GK_zone_61 | 21261 | Russia - 178.5°W to 175.5°W onshore | 64.74 | -178.5 | 71.61 | -175.5 |
| GSK-2011_GSK_3GK_zone_62 | 21262 | Russia - 175.5°W to 172.5°W onshore | 64.2 | -175.5 | 67.78 | -172.5 |
| GSK-2011_GSK_3GK_zone_63 | 21263 | Russia - 172.5°W to 169.5°W onshore | 64.35 | -172.5 | 67.06 | -169.57 |
| GSK-2011_GSK_3GK_zone_64 | 21264 | Russia - east of 169.5°W onshore | 65.7 | -169.22 | 65.86 | -168.97 |
| GSK-2011_GSK_3GK_zone_7 | 21207 | Russia - 19.5°E to 22.5°E onshore | 54.32 | 19.57 | 55.32 | 22.5 |
| GSK-2011_GSK_3GK_zone_8 | 21208 | Russia - 22.5°E to 25.5°E onshore | 54.34 | 22.5 | 55.07 | 22.87 |
| GSK-2011_GSK_3GK_zone_9 | 21209 | Russia - 25.5°E to 28.5°E onshore | 56.05 | 26.61 | 68.93 | 28.51 |
| GTM | 103598 | Guatemala | 10.6 | -94.57 | 17.83 | -88.16 |
| Guam_1963_Yap_Islands | 3295 | Micronesia - Yap Islands | 9.39 | 137.99 | 9.69 | 138.27 |
| Guam_Geodetic_Network_1993 | 102240 | Guam | 10.95 | 141.19 | 15.91 | 148.18 |
| Guam_Geodetic_Triangulation_Network_ 1963 | 102239 | Guam | 10.95 | 141.19 | 15.91 | 148.18 |
| Guernsey_Grid | 102070 | Channel Islands - Guernsey, Alderney, Sark | 49.11 | -3.73 | 50.16 | -2.02 |
| Gulshan_303_Bangladesh_TM | 3106 | Bangladesh | 18.56 | 88.01 | 26.64 | 92.67 |
| Gunung_Segara_Jakarta_NEIEZ | 5329 | Indonesia - Kalimantan E | -4.24 | 114.55 | 4.29 | 119.06 |
| Gunung_Segara_NEIEZ | 3000 | Indonesia - Kalimantan E | -4.24 | 114.55 | 4.29 | 119.06 |
| Gunung_Segara_UTM_Zone_50S | 2933 | Indonesia - Kalimantan - Mahakam delta | -1.24 | 116.72 | 0 | 117.99 |
| Hanoi_1972_GK_106_NE | 2093 | Vietnam - onshore Vung Tau area | 9.03 | 105.49 | 11.04 | 107.58 |
| Hanoi_1972_GK_Zone_18 | 2044 | Vietnam - west of 108°E onshore | 8.33 | 102.14 | 23.4 | 108 |
| Hanoi_1972_GK_Zone_19 | 2045 | Vietnam - east of 108°E onshore | 10.43 | 108 | 21.56 | 109.53 |
| Hartebeesthoek94_Lo15 | 102480 | Namibia - Walvis Bay | -23.15 | 14.35 | -22.68 | 14.6 |
| Hartebeesthoek94_Lo17 | 102481 | South Africa - west of 18°E | -33.1 | 16.45 | -28.03 | 18 |
| Hartebeesthoek94_Lo19 | 102482 | South Africa - 18°E to 20°E | -34.88 | 17.99 | -28.38 | 20 |
| Hartebeesthoek94_Lo21 | 102483 | South Africa - 20°E to 22°E | -34.88 | 19.99 | -24.76 | 22.01 |
| Hartebeesthoek94_Lo23 | 102484 | South Africa - 22°E to 24°E | -34.26 | 22 | -25.26 | 24.01 |
| Hartebeesthoek94_Lo25 | 102485 | South Africa - 24°E to 26°E | -34.26 | 24 | -24.71 | 26.01 |
| Hartebeesthoek94_Lo27 | 102486 | South Africa - 26°E to 28°E | -33.83 | 26 | -22.92 | 28 |
| Hartebeesthoek94_Lo29 | 102487 | South Africa - 28°E to 30°E | -33.03 | 27.99 | -22.13 | 30 |
| Hartebeesthoek94_Lo31 | 102488 | South Africa - 30°E to 32°E | -31.38 | 29.99 | -22.22 | 32.02 |
| Hartebeesthoek94_Lo33 | 102489 | South Africa - east of 32°E | -28.94 | 31.95 | -26.8 | 32.95 |
| Hartebeesthoek94_Lo19_(E-N) | 102562 | South Africa - 18°E to 20°E | -34.88 | 17.99 | -28.38 | 20 |
| Hartebeesthoek94_Lo21_(E-N) | 102563 | South Africa - 20°E to 22°E | -34.88 | 19.99 | -24.76 | 22.01 |
| Hartebeesthoek94_Lo23_(E-N) | 102564 | South Africa - 22°E to 24°E | -34.26 | 22 | -25.26 | 24.01 |
| Hartebeesthoek94_Lo25_(E-N) | 102565 | South Africa - 24°E to 26°E | -34.26 | 24 | -24.71 | 26.01 |
| Hartebeesthoek94_Lo27_(E-N) | 102566 | South Africa - 26°E to 28°E | -33.83 | 26 | -22.92 | 28 |
| Hartebeesthoek94_Lo29_(E-N) | 102567 | South Africa - 28°E to 30°E | -33.03 | 27.99 | -22.13 | 30 |
| Hartebeesthoek94_Lo31_(E-N) | 102568 | South Africa - 30°E to 32°E | -31.38 | 29.99 | -22.22 | 32.02 |
| Hartebeesthoek94_ZAF_BSU_Albers_25E | 9221 | South Africa - mainland - onshore and offshore | -38.17 | 13.33 | -22.13 | 36.54 |
| Hartebeesthoek94_ZAF_BSU_Albers_44E | 9222 | South Africa - Prince Edward islands - onshore and offshore | -50.32 | 32.71 | -43.26 | 42.85 |
| Hawaii_Albers_Equal_Area_Conic | 102007 | USA - Hawaii - onshore | 18.87 | -160.3 | 22.29 | -154.74 |
| Helle_1954_Jan_Mayen_Grid | 3058 | Jan Mayen - onshore | 70.75 | -9.17 | 71.24 | -7.87 |
| Hito_XVIII_1963_Argentina_2 | 2083 | Argentina - Tierra del Fuego onshore west of 67.5°W | -54.9 | -68.64 | -52.59 | -67.5 |
| Hito_XVIII_1963_UTM_19S | 2084 | Argentina - Tierra del Fuego offshore west of 66°W | -54.61 | -68.62 | -51.65 | -66 |
| HJAIA_AirportGrid_2Mar10 | 102460 | HJAIA - Hartsfield- Jackson Atlanta Intl Airport | 33.591 | -84.502 | 33.684 | -84.351 |
| Hjorsey_1955_UTM_Zone_26N | 3054 | Iceland - onshore west of 24°W | 64.71 | -24.66 | 65.86 | -24 |
| Hjorsey_1955_UTM_Zone_27N | 3055 | Iceland - onshore 24°W to 18°W | 63.34 | -24 | 66.52 | -18 |
| Hjorsey_1955_UTM_Zone_28N | 3056 | Iceland - onshore east of 18°W | 63.45 | -18 | 66.59 | -13.38 |
| Hong_Kong_1963_Grid_System | 3407 | China - Hong Kong | 22.13 | 113.76 | 22.58 | 114.51 |
| Hong_Kong_1980_Grid | 2326 | China - Hong Kong | 22.13 | 113.76 | 22.58 | 114.51 |
| Hong_Kong_1980_UTM_Zone_49N | 102141 | China - Hong Kong | 22.13 | 113.76 | 22.58 | 114.51 |
| Hong_Kong_1980_UTM_Zone_50N | 102142 | China - Hong Kong | 22.13 | 113.76 | 22.58 | 114.51 |
| HTRS96_Croatia_LCC | 3766 | Croatia | 41.62 | 13 | 46.54 | 19.43 |
| HTRS96_Croatia_TM | 3765 | Croatia - onshore | 42.34 | 13.43 | 46.54 | 19.43 |
| HTRS96_UTM_Zone_33N | 3767 | Croatia - west of 18°E | 41.63 | 13 | 46.54 | 18 |
| HTRS96_UTM_Zone_34N | 3768 | Croatia - east of 18°E | 41.62 | 18 | 45.92 | 19.43 |
| Hungarian_1972_Egyseges_Orszagos_ Vetuleti | 23700 | Hungary | 45.74 | 16.11 | 48.58 | 22.9 |
| Hu_Tzu_Shan_UTM_Zone_51N | 3829 | Taiwan - onshore - mainland and Penghu | 21.87 | 119.25 | 25.34 | 122.06 |
| IGC_1962_Congo_TM_Zone_12 | 3318 | Congo DR (Zaire) - 11°E to 13°E onshore | -6.04 | 12.17 | -4.67 | 13.01 |
| IGC_1962_Congo_TM_Zone_14 | 3319 | Congo DR (Zaire) - 13°E to 15°E | -5.91 | 13 | -4.28 | 15.01 |
| IGC_1962_Congo_TM_Zone_16 | 3320 | Congo DR (Zaire) - 6th parallel south 15°E to 17°E | -5.87 | 15 | -3.29 | 17 |
| IGC_1962_Congo_TM_Zone_18 | 3321 | Congo DR (Zaire) - 6th parallel south 17°E to 19°E | -5.38 | 17 | -3.4 | 19 |
| IGC_1962_Congo_TM_Zone_20 | 3322 | Congo DR (Zaire) - 6th parallel south 19°E to 21°E | -7.29 | 19 | -4.01 | 21 |
| IGC_1962_Congo_TM_Zone_22 | 3323 | Congo DR (Zaire) - 6th parallel south 21°E to 23°E | -7.31 | 21 | -5.31 | 23 |
| IGC_1962_Congo_TM_Zone_24 | 3324 | Congo DR (Zaire) - 6th parallel south 23°E to 25°E | -6.99 | 23 | -5.01 | 25 |
| IGC_1962_Congo_TM_Zone_26 | 3325 | Congo DR (Zaire) - 6th parallel south 25°E to 27°E | -7.26 | 25 | -4.23 | 27 |
| IGC_1962_Congo_TM_Zone_28 | 3326 | Congo DR (Zaire) - 6th parallel south 27°E to 29°E | -7.36 | 27 | -4.24 | 29 |
| IGC_1962_Congo_TM_Zone_30 | 3327 | Congo DR (Zaire) - 6th parallel south 29°E to 31°E | -6.04 | 29 | -4.34 | 29.64 |
| IGCB_1955_Congo_TM_Zone_12 | 3339 | Congo DR (Zaire) - 11°E to 13°E onshore | -6.04 | 12.17 | -4.67 | 13.01 |
| IGCB_1955_Congo_TM_Zone_14 | 3340 | Congo DR (Zaire) - 13°E to 15°E | -5.91 | 13 | -4.28 | 15.01 |
| IGCB_1955_Congo_TM_Zone_16 | 3341 | Congo DR (Zaire) - Bas Congo east of 15°E | -5.87 | 14.99 | -4.42 | 16.28 |
| IGCB_1955_UTM_Zone_33S | 3342 | Congo DR (Zaire) - Bas Congo | -6.04 | 12.17 | -4.28 | 16.28 |
| IGM_1995_UTM_Zone_32N | 3064 | Italy - west of 12°E | 36.53 | 5.94 | 47.04 | 12 |
| IGM_1995_UTM_Zone_33N | 3065 | Italy - 12~E to 18~E | 34.79 | 12 | 47.1 | 18 |
| IGM95_UTM_Zone_34N | 9716 | Italy - east of 18°E | 34.76 | 17.99 | 41.64 | 18.99 |
| IGN53_Mare_UTM_58S | 2995 | New Caledonia - Mare - west of 168°E | -21.71 | 167.75 | -21.32 | 168 |
| IGN53_Mare_UTM_Zone_59S | 3172 | New Caledonia - Mare - east of 168°E | -21.71 | 168 | -21.35 | 168.19 |
| IGN56_Lifou_UTM_58S | 2981 | New Caledonia - Lifou | -21.24 | 166.98 | -20.62 | 167.52 |
| IGN63_Hiva_Oa_UTM_Zone_7S | 3302 | French Polynesia - Marquesas Islands - Hiva Oa and Tahuata | -10.08 | -139.23 | -9.64 | -138.75 |
| IGN72_Grande_Terre_UTM_58S | 3060 | New Caledonia - Grande Terre | -22.45 | 163.92 | -20.03 | 167.09 |
| IGN72_Nuku_Hiva_UTM_7S | 2978 | French Polynesia - Marquesas Islands - Nuku Hiva, Ua Huka and Ua Pou | -9.57 | -140.31 | -8.72 | -139.44 |
| IGN_Astro_1960_UTM_Zone_28N | 3367 | Mauritania - west of 12°W onshore | 14.72 | -17.08 | 23.46 | -12 |
| IGN_Astro_1960_UTM_Zone_29N | 3368 | Mauritania - 12°W to 6°W | 14.75 | -12 | 27.3 | -6 |
| IGN_Astro_1960_UTM_Zone_30N | 3369 | Mauritania - east of 6°W | 15.49 | -6 | 25.74 | -4.8 |
| IGRS_UTM_Zone_37N | 3890 | Iraq - west of 42°E | 31.14 | 38.79 | 36.75 | 42 |
| IGRS_UTM_Zone_38N | 3891 | Iraq - 42°E to 48°E | 29.06 | 42 | 37.39 | 48 |
| IGRS_UTM_Zone_39N | 3892 | Iraq - east of 48°E | 29.6 | 48 | 31 | 48.75 |
| Indian_1954_UTM_Zone_46N | 23946 | Myanmar (Burma) - onshore west of 96°E | 15.66 | 92.2 | 27.14 | 96.01 |
| Indian_1954_UTM_Zone_47N | 23947 | Asia - Myanmar and Thailand - 96°E to 102°E | 5.63 | 95.99 | 28.55 | 102.01 |
| Indian_1954_UTM_Zone_48N | 23948 | Thailand - onshore east of 102°E | 6.02 | 102 | 18.44 | 105.64 |
| Indian_1960_TM_106NE | 3176 | Vietnam - offshore Cuu Long basin | 7.99 | 106.54 | 11.15 | 110 |
| Indian_1960_UTM_Zone_48N | 3148 | Asia - Cambodia and Vietnam - west of 108°E | 8.33 | 102.14 | 23.4 | 108 |
| Indian_1960_UTM_Zone_49N | 3149 | Vietnam - east of 108°E onshore | 10.43 | 108 | 21.56 | 109.53 |
| Indian_1975_UTM_Zone_47N | 24047 | Thailand - onshore and GoT 96°E to102°E | 5.63 | 97.34 | 20.46 | 102.01 |
| Indian_1975_UTM_Zone_48N | 24048 | Thailand - east of 102°E | 6.02 | 102 | 18.44 | 105.64 |
| Indonesian_1974_UTM_Zone_46N | 23846 | Indonesia - west of 96°E onshore | 2.55 | 95.16 | 5.97 | 96 |
| Indonesian_1974_UTM_Zone_46S | 23886 | Indonesia - west of 96°E, S hemisphere | -5 | 88 | 0 | 96 |
| Indonesian_1974_UTM_Zone_47N | 23847 | Indonesia - 96°E to 102°E, N hemisphere onshore | 0 | 96 | 5.42 | 102 |
| Indonesian_1974_UTM_Zone_47S | 23887 | Indonesia - 96°E to 102°E, S hemisphere onshore | -3.57 | 98.24 | 0 | 102 |
| Indonesian_1974_UTM_Zone_48N | 23848 | Indonesia - 102°E to 108°E, N hemisphere onshore | 0 | 102 | 4.11 | 108 |
| Indonesian_1974_UTM_Zone_48S | 23888 | Indonesia - 102°E to 108°E, S hemisphere onshore | -7.79 | 102 | 0 | 108 |
| Indonesian_1974_UTM_Zone_49N | 23849 | Indonesia - 108°E to 114°E, N hemisphere onshore | 0 | 108 | 4.25 | 114 |
| Indonesian_1974_UTM_Zone_49S | 23889 | Indonesia - 108°E to 114°E, S hemisphere onshore | -8.67 | 108 | 0 | 114 |
| Indonesian_1974_UTM_Zone_50N | 23850 | Indonesia - 114°E to 120°E, N hemisphere onshore | 0 | 114 | 4.37 | 120 |
| Indonesian_1974_UTM_Zone_50S | 23890 | Indonesia - 114°E to 120°E, S hemisphere onshore | -10.15 | 114 | 0 | 120 |
| Indonesian_1974_UTM_Zone_51N | 23851 | Indonesia - 120°E to 126°E, N hemisphere onshore | 0 | 120 | 3.84 | 125.71 |
| Indonesian_1974_UTM_Zone_51S | 23891 | Indonesia - 120°E to 126°E, S hemisphere onshore | -10.98 | 120 | 0 | 126 |
| Indonesian_1974_UTM_Zone_52N | 23852 | Indonesia - 126°E to 132°E, N hemisphere onshore | 0 | 126.55 | 4.59 | 131 |
| Indonesian_1974_UTM_Zone_52S | 23892 | Indonesia - 126°E to 132°E, S hemisphere onshore | -8.41 | 126 | 0 | 132 |
| Indonesian_1974_UTM_Zone_53N | 23853 | Indonesia - 132°E to 138°E, N hemisphere | 0 | 132 | 2 | 138 |
| Indonesian_1974_UTM_Zone_53S | 23893 | Indonesia - 132°E to 138°E, S hemisphere onshore | -8.49 | 132 | -0.29 | 138 |
| Indonesian_1974_UTM_Zone_54S | 23894 | Indonesia - east of 138°E onshore | -9.19 | 138 | -1.49 | 141.01 |
| IRENET95_Irish_Transverse_Mercator | 2157 | Europe - Ireland (Republic and Ulster) - onshore | 51.39 | -10.56 | 55.43 | -5.34 |
| IRENET95_UTM_Zone_29N | 2158 | Europe - Ireland (Republic and Ulster) - onshore | 51.39 | -10.56 | 55.43 | -5.34 |
| ISN_1993_Lambert_1993 | 3057 | Iceland | 59.96 | -30.87 | 69.59 | -5.55 |
| ISN_2004_LAEA_Europe | 5638 | Iceland | 59.96 | -30.87 | 69.59 | -5.55 |
| ISN_2004_Lambert_2004 | 5325 | Iceland | 59.96 | -30.87 | 69.59 | -5.55 |
| ISN_2004_LCC_Europe | 5639 | Iceland | 59.96 | -30.87 | 69.59 | -5.55 |
| ISN2016_LAEA_Europe | 9039 | Iceland | 59.96 | -30.87 | 69.59 | -5.55 |
| ISN2016_Lambert_2016 | 8088 | Iceland | 59.96 | -30.87 | 69.59 | -5.55 |
| ISN2016_LCC_Europe | 9040 | Iceland | 59.96 | -30.87 | 69.59 | -5.55 |
| Israeli_Grid_05 | 6984 | Asia - Middle East - Israel and Palestine Territory onshore | 29.45 | 34.17 | 33.28 | 35.69 |
| Israeli_Grid_05-12 | 6991 | Asia - Middle East - Israel and Palestine Territory onshore | 29.45 | 34.17 | 33.28 | 35.69 |
| Israel_TM_Grid | 2039 | Asia - Middle East - Israel and Palestine Territory onshore | 29.45 | 34.17 | 33.28 | 35.69 |
| JAD_2001_Jamaica_Grid | 3448 | Jamaica - onshore | 17.64 | -78.43 | 18.58 | -76.17 |
| JAD_2001_UTM_Zone_17N | 3449 | Jamaica - west of 78°W | 14.16 | -80.6 | 19.36 | -77.99 |
| JAD_2001_UTM_Zone_18N | 3450 | Jamaica - east of 78°W | 14.08 | -78 | 19.2 | -74.51 |
| Jamaica_1875_Old_Grid | 24100 | Jamaica - onshore | 17.64 | -78.43 | 18.58 | -76.17 |
| Jamaica_Grid | 24200 | Jamaica - onshore | 17.64 | -78.43 | 18.58 | -76.17 |
| Japan_Zone_1 | 30161 | Japan - zone I | 26.96 | 128.17 | 34.74 | 130.46 |
| Japan_Zone_10 | 30170 | Japan - zone X | 37.73 | 139.49 | 41.58 | 142.14 |
| Japan_Zone_11 | 30171 | Japan - zone XI | 41.34 | 139.34 | 43.42 | 141.46 |
| Japan_Zone_12 | 30172 | Japan - zone XII | 42.15 | 140.89 | 45.54 | 143.61 |
| Japan_Zone_13 | 30173 | Japan - zone XIII | 41.87 | 142.61 | 44.4 | 145.87 |
| Japan_Zone_14 | 30174 | Japan - zone XIV | 24.67 | 141.2 | 27.8 | 142.33 |
| Japan_Zone_15 | 30175 | Japan - zone XV | 26.02 | 126.63 | 26.91 | 128.4 |
| Japan_Zone_16 | 30176 | Japan - zone XVI | 23.98 | 122.83 | 24.94 | 125.51 |
| Japan_Zone_17 | 30177 | Japan - zone XVII | 24.4 | 131.12 | 26.01 | 131.38 |
| Japan_Zone_18 | 30178 | Japan - zone XVIII | 20.37 | 136.02 | 20.48 | 136.16 |
| Japan_Zone_19 | 30179 | Japan - Minamitori- shima (Marcus Island) - onshore | 24.22 | 153.91 | 24.35 | 154.05 |
| Japan_Zone_2 | 30162 | Japan - zone II | 30.18 | 129.76 | 33.99 | 132.05 |
| Japan_Zone_3 | 30163 | Japan - zone III | 33.72 | 130.81 | 36.38 | 133.49 |
| Japan_Zone_4 | 30164 | Japan - zone IV | 32.69 | 131.95 | 34.45 | 134.81 |
| Japan_Zone_5 | 30165 | Japan - zone V | 34.13 | 133.13 | 35.71 | 135.47 |
| Japan_Zone_6 | 30166 | Japan - zone VI | 33.4 | 134.86 | 36.33 | 136.99 |
| Japan_Zone_7 | 30167 | Japan - zone VII | 34.51 | 136.22 | 37.58 | 137.84 |
| Japan_Zone_8 | 30168 | Japan - zone VIII | 34.54 | 137.32 | 38.58 | 139.91 |
| Japan_Zone_9 | 30169 | Japan - zone IX | 29.31 | 138.4 | 37.98 | 141.11 |
| JAXA_Snow_Depth_Polar_Stereographic_ North | 5890 | World - N hemisphere - north of 60°N | 60 | -180 | 90 | 180 |
| JGD_2000_Japan_Zone_1 | 2443 | Japan - zone I | 26.96 | 128.17 | 34.74 | 130.46 |
| JGD_2000_Japan_Zone_10 | 2452 | Japan - zone X | 37.73 | 139.49 | 41.58 | 142.14 |
| JGD_2000_Japan_Zone_11 | 2453 | Japan - zone XI | 41.34 | 139.34 | 43.42 | 141.46 |
| JGD_2000_Japan_Zone_12 | 2454 | Japan - zone XII | 42.15 | 140.89 | 45.54 | 143.61 |
| JGD_2000_Japan_Zone_13 | 2455 | Japan - zone XIII | 41.87 | 142.61 | 44.4 | 145.87 |
| JGD_2000_Japan_Zone_14 | 2456 | Japan - zone XIV | 24.67 | 141.2 | 27.8 | 142.33 |
| JGD_2000_Japan_Zone_15 | 2457 | Japan - zone XV | 26.02 | 126.63 | 26.91 | 128.4 |
| JGD_2000_Japan_Zone_16 | 2458 | Japan - zone XVI | 23.98 | 122.83 | 24.94 | 125.51 |
| JGD_2000_Japan_Zone_17 | 2459 | Japan - zone XVII | 24.4 | 131.12 | 26.01 | 131.38 |
| JGD_2000_Japan_Zone_18 | 2460 | Japan - zone XVIII | 20.37 | 136.02 | 20.48 | 136.16 |
| JGD_2000_Japan_Zone_19 | 2461 | Japan - Minamitori- shima (Marcus Island) - onshore | 24.22 | 153.91 | 24.35 | 154.05 |
| JGD_2000_Japan_Zone_2 | 2444 | Japan - zone II | 30.18 | 129.76 | 33.99 | 132.05 |
| JGD_2000_Japan_Zone_3 | 2445 | Japan - zone III | 33.72 | 130.81 | 36.38 | 133.49 |
| JGD_2000_Japan_Zone_4 | 2446 | Japan - zone IV | 32.69 | 131.95 | 34.45 | 134.81 |
| JGD_2000_Japan_Zone_5 | 2447 | Japan - zone V | 34.13 | 133.13 | 35.71 | 135.47 |
| JGD_2000_Japan_Zone_6 | 2448 | Japan - zone VI | 33.4 | 134.86 | 36.33 | 136.99 |
| JGD_2000_Japan_Zone_7 | 2449 | Japan - zone VII | 34.51 | 136.22 | 37.58 | 137.84 |
| JGD_2000_Japan_Zone_8 | 2450 | Japan - zone VIII | 34.54 | 137.32 | 38.58 | 139.91 |
| JGD_2000_Japan_Zone_9 | 2451 | Japan - zone IX | 29.31 | 138.4 | 37.98 | 141.11 |
| JGD_2000_UTM_Zone_51N | 3097 | Japan - 120°E to 126°E | 21.1 | 122.38 | 29.71 | 126 |
| JGD_2000_UTM_Zone_52N | 3098 | Japan - 126°E to 132°E | 21.12 | 126 | 38.63 | 132 |
| JGD_2000_UTM_Zone_53N | 3099 | Japan - 132°E to 138°E | 17.09 | 132 | 43.55 | 138 |
| JGD_2000_UTM_Zone_54N | 3100 | Japan - 138°E to 144°E | 17.63 | 138 | 46.05 | 144 |
| JGD_2000_UTM_Zone_55N | 3101 | Japan - 144°E to 150°E | 23.03 | 144 | 45.65 | 147.86 |
| JGD_2000_UTM_Zone_56N | 102150 | World - N hemisphere - 150°E to 156°E | 0 | 150 | 84 | 156 |
| JGD_2011_Japan_Zone_1 | 6669 | Japan - zone I | 26.96 | 128.17 | 34.74 | 130.46 |
| JGD_2011_Japan_Zone_10 | 6678 | Japan - zone X | 37.73 | 139.49 | 41.58 | 142.14 |
| JGD_2011_Japan_Zone_11 | 6679 | Japan - zone XI | 41.34 | 139.34 | 43.42 | 141.46 |
| JGD_2011_Japan_Zone_12 | 6680 | Japan - zone XII | 42.15 | 140.89 | 45.54 | 143.61 |
| JGD_2011_Japan_Zone_13 | 6681 | Japan - zone XIII | 41.87 | 142.61 | 44.4 | 145.87 |
| JGD_2011_Japan_Zone_14 | 6682 | Japan - zone XIV | 24.67 | 141.2 | 27.8 | 142.33 |
| JGD_2011_Japan_Zone_15 | 6683 | Japan - zone XV | 26.02 | 126.63 | 26.91 | 128.4 |
| JGD_2011_Japan_Zone_16 | 6684 | Japan - zone XVI | 23.98 | 122.83 | 24.94 | 125.51 |
| JGD_2011_Japan_Zone_17 | 6685 | Japan - zone XVII | 24.4 | 131.12 | 26.01 | 131.38 |
| JGD_2011_Japan_Zone_18 | 6686 | Japan - zone XVIII | 20.37 | 136.02 | 20.48 | 136.16 |
| JGD_2011_Japan_Zone_19 | 6687 | Japan - Minamitori- shima (Marcus Island) - onshore | 24.22 | 153.91 | 24.35 | 154.05 |
| JGD_2011_Japan_Zone_2 | 6670 | Japan - zone II | 30.18 | 129.76 | 33.99 | 132.05 |
| JGD_2011_Japan_Zone_3 | 6671 | Japan - zone III | 33.72 | 130.81 | 36.38 | 133.49 |
| JGD_2011_Japan_Zone_4 | 6672 | Japan - zone IV | 32.69 | 131.95 | 34.45 | 134.81 |
| JGD_2011_Japan_Zone_5 | 6673 | Japan - zone V | 34.13 | 133.13 | 35.71 | 135.47 |
| JGD_2011_Japan_Zone_6 | 6674 | Japan - zone VI | 33.4 | 134.86 | 36.33 | 136.99 |
| JGD_2011_Japan_Zone_7 | 6675 | Japan - zone VII | 34.51 | 136.22 | 37.58 | 137.84 |
| JGD_2011_Japan_Zone_8 | 6676 | Japan - zone VIII | 34.54 | 137.32 | 38.58 | 139.91 |
| JGD_2011_Japan_Zone_9 | 6677 | Japan - zone IX | 29.31 | 138.4 | 37.98 | 141.11 |
| JGD_2011_UTM_Zone_51N | 6688 | Japan - 120°E to 126°E | 21.1 | 122.38 | 29.71 | 126 |
| JGD_2011_UTM_Zone_52N | 6689 | Japan - 126°E to 132°E | 21.12 | 126 | 38.63 | 132 |
| JGD_2011_UTM_Zone_53N | 6690 | Japan - 132°E to 138°E | 17.09 | 132 | 43.55 | 138 |
| JGD_2011_UTM_Zone_54N | 6691 | Japan - 138°E to 144°E | 17.63 | 138 | 46.05 | 144 |
| JGD_2011_UTM_Zone_55N | 6692 | Japan - 144°E to 150°E | 23.03 | 144 | 45.65 | 147.86 |
| JGD_2011_UTM_Zone_56N | 102598 | World - N hemisphere - 150°E to 156°E | 0 | 150 | 84 | 156 |
| Jordan_JTM | 102158 | Jordan | 29.18 | 34.88 | 33.38 | 39.31 |
| Kalianpur_1880_India_Zone_0 | 24370 | Pakistan - north of 35°35'N | 35.58 | 71.18 | 37.07 | 77.01 |
| Kalianpur_1880_India_Zone_I | 24371 | Asia - India; Pakistan - 28°N to 35°35'N | 28 | 60.86 | 35.59 | 81.64 |
| Kalianpur_1880_India_Zone_IIa | 24372 | Asia - India; Pakistan - onshore 21°N to 28°N and west of 82°E | 21 | 61.59 | 28.01 | 82.01 |
| Kalianpur_1880_India_Zone_IIb | 24382 | Asia - Bangladesh; India; Myanmar; Pakistan - zone Ilb | 21 | 82 | 29.47 | 101.17 |
| Kalianpur_1880_India_Zone_III | 24373 | India - onshore 15°N to 21°N | 15 | 70.14 | 21.01 | 87.15 |
| Kalianpur_1880_India_Zone_IV | 24374 | India - mainland south of 15°N | 8.02 | 73.94 | 15.01 | 80.4 |
| Kalianpur_1937_India_Zone_IIb | 24375 | Bangladesh - onshore | 20.52 | 88.01 | 26.64 | 92.67 |
| Kalianpur_1937_UTM_Zone_45N | 24305 | Bangladesh - onshore west of 90°E | 21.59 | 88.01 | 26.64 | 90 |
| Kalianpur_1937_UTM_Zone_46N | 24306 | Bangladesh - onshore east of 90°E | 20.52 | 90 | 25.29 | 92.67 |
| Kalianpur_1962_India_Zone_I | 24376 | Pakistan - 28°N to 35°35'N | 28 | 60.86 | 35.59 | 77.83 |
| Kalianpur_1962_India_Zone_IIa | 24377 | Pakistan - onshore south of 28°N | 23.64 | 61.59 | 28.01 | 71.91 |
| Kalianpur_1962_UTM_Zone_41N | 24311 | Pakistan - onshore west of 66°E | 24.98 | 60.86 | 29.87 | 66.01 |
| Kalianpur_1962_UTM_Zone_42N | 24312 | Pakistan - onshore 66°E to 72°E | 23.64 | 66 | 36.56 | 72.01 |
| Kalianpur_1962_UTM_Zone_43N | 24313 | Pakistan - east of 72°E | 28.21 | 72 | 37.07 | 77.83 |
| Kalianpur_1975_India_Zone_I | 24378 | India - north of 28°N | 28 | 70.35 | 35.51 | 81.64 |
| Kalianpur_1975_India_Zone_IIa | 24379 | India - onshore 21°N to 28°N and west of 82°E | 21 | 68.13 | 28.01 | 82.01 |
| Kalianpur_1975_India_Zone_IIb | 24380 | India - onshore north of 21°N and east of 82°E | 21 | 82 | 29.47 | 97.42 |
| Kalianpur_1975_India_Zone_III | 24381 | India - onshore 15°N to 21°N | 15 | 70.14 | 21.01 | 87.15 |
| Kalianpur_1975_India_Zone_IV | 24383 | India - mainland south of 15°N | 8.02 | 73.94 | 15.01 | 80.4 |
| Kalianpur_1975_UTM_Zone_42N | 24342 | India - onshore west of 72°E | 20.64 | 68.13 | 28.22 | 72.01 |
| Kalianpur_1975_UTM_Zone_43N | 24343 | India - mainland 72°E to 78°E | 8.02 | 72 | 35.51 | 78.01 |
| Kalianpur_1975_UTM_Zone_44N | 24344 | India - onshore 78°E to 84°E | 8.29 | 78 | 35.5 | 84.01 |
| Kalianpur_1975_UTM_Zone_45N | 24345 | India - onshore 84°E to 90°E | 18.18 | 84 | 28.14 | 90.01 |
| Kalianpur_1975_UTM_Zone_46N | 24346 | India - mainland 90°E to 96°E | 21.94 | 90 | 29.42 | 96.01 |
| Kalianpur_1975_UTM_Zone_47N | 24347 | India - east of 96°E | 27.1 | 96 | 29.47 | 97.42 |
| Kandawala_Ceylon_Belt_Indian_Yards_ 1937 | 102064 | Sri Lanka | 2.58 | 77.02 | 11.45 | 85.24 |
| Kandawala_Ceylon_Belt_Meters | 102063 | Sri Lanka | 2.58 | 77.02 | 11.45 | 85.24 |
| Kandawala_Sri_Lanka_Grid | 5234 | Sri Lanka - onshore | 5.86 | 79.64 | 9.88 | 81.95 |
| Karbala_1979_Iraq_National_Grid | 6646 | Iraq - onshore | 29.06 | 38.79 | 37.39 | 48.61 |
| Karbala_1979_Polservice_UTM_Zone_ 37N | 3391 | Iraq - west of 42°E | 31.14 | 38.79 | 36.75 | 42 |
| Karbala_1979_Polservice_UTM_Zone_ 38N | 3392 | Iraq - 42°E to 48°E | 29.06 | 42 | 37.39 | 48 |
| Karbala_1979_Polservice_UTM_Zone_ 39N | 3393 | Iraq - east of 48°E onshore | 29.87 | 48 | 31 | 48.61 |
| Kasai_1953_Congo_TM_Zone_22 | 3316 | Congo DR (Zaire) - 6th parallel south 21°E to 23°E | -7.31 | 21 | -5.31 | 23 |
| Kasai_1953_Congo_TM_Zone_24 | 3317 | Congo DR (Zaire) - 6th parallel south 23°E to 25°E | -6.99 | 23 | -5.01 | 25 |
| Katanga_1955_Katanga_Gauss_Zone_A | 3986 | Congo DR (Zaire) - Katanga east of 28.5°E | -13.46 | 28.5 | -4.99 | 30.78 |
| Katanga_1955_Katanga_Gauss_Zone_B | 3987 | Congo DR (Zaire) - Katanga 26.5°E to 29.5°E | -13.44 | 26.5 | -4.99 | 29.5 |
| Katanga_1955_Katanga_Gauss_Zone_C | 3988 | Congo DR (Zaire) - Katanga 24.5°E to 27.5°E | -12.08 | 24.5 | -4.99 | 27.5 |
| Katanga_1955_Katanga_Gauss_Zone_D | 3989 | Congo DR (Zaire) - Katanga west of 25.5°E | -11.72 | 21.74 | -6.32 | 25.51 |
| Katanga_1955_Katanga_Lambert | 4415 | Congo DR (Zaire) - Katanga | -13.46 | 21.74 | -4.99 | 30.78 |
| Katanga_1955_Katanga_TM | 3315 | Congo DR (Zaire) - Katanga | -13.46 | 21.74 | -4.99 | 30.78 |
| Kerguelen_Island_1949_UTM_42S | 3336 | French Southern Territories - Kerguelen onshore | -49.78 | 68.69 | -48.6 | 70.62 |
| Kertau_1968_Johor_Grid | 4390 | Malaysia - West Malaysia - Johor | 1.21 | 102.44 | 2.95 | 104.6 |
| Kertau_1968_Kedah_and_Perlis_Grid | 4396 | Malaysia - West Malaysia - Kedah and Perlis | 5.08 | 99.59 | 6.72 | 101.12 |
| Kertau_1968_Kelantan_Grid | 4398 | Malaysia - West Malaysia - Kelantan | 4.54 | 101.33 | 6.29 | 102.67 |
| Kertau_1968_Pahang_Grid | 4392 | Malaysia - West Malaysia - Pahang | 2.45 | 101.33 | 4.78 | 103.67 |
| Kertau_1968_Perak_Revised_Grid | 4397 | Malaysia - West Malaysia - Perak | 3.66 | 100.07 | 5.92 | 102 |
| Kertau_1968_Pinang_Grid | 4395 | Malaysia - West Malaysia - Pulau Pinang | 5.12 | 100.12 | 5.59 | 100.56 |
| Kertau_1968_Selangor_Grid | 4393 | Malaysia - West Malaysia - Selangor | 2.54 | 100.76 | 3.87 | 101.97 |
| Kertau_1968_Sembilan_and_Melaka_ Grid | 4391 | Malaysia - West Malaysia - Sembilan and Melaka | 2.03 | 101.7 | 3.28 | 102.71 |
| Kertau_1968_Terengganu_Grid | 4394 | Malaysia - West Malaysia - Terengganu | 3.89 | 102.38 | 5.9 | 103.72 |
| Kertau_RSO_Malaya_Chains | 24571 | Malaysia - West Malaysia - onshore | 1.21 | 99.59 | 6.72 | 104.6 |
| Kertau_RSO_Malaya_Meters | 102062 | Malaysia - West Malaysia - onshore | 1.21 | 99.59 | 6.72 | 104.6 |
| Kertau_RSO_RSO_Malaya | 3168 | Malaysia - West Malaysia - onshore | 1.21 | 99.59 | 6.72 | 104.6 |
| Kertau_RSO_RSO_Malaya_ ChSears1922trunc | 3167 | Malaysia - West Malaysia - onshore | 1.21 | 99.59 | 6.72 | 104.6 |
| Kertau_Singapore_Grid | 24500 | Singapore | 1.13 | 103.59 | 1.47 | 104.07 |
| Kertau_UTM_Zone_47N | 24547 | Malaysia - West Malaysia - onshore west of 102°E | 2.29 | 99.59 | 6.72 | 102.01 |
| Kertau_UTM_Zone_48N | 24548 | Malaysia - West Malaysia - east of 102°E | 1.21 | 102 | 7.81 | 105.82 |
| KKJ_Finland_Zone_0 | 3386 | Finland - west of 19.5°E onshore | 60.08 | 19.24 | 60.34 | 19.5 |
| KKJ_Finland_Zone_5 | 3387 | Finland - east of 31.5°E | 62.83 | 31.5 | 63 | 31.59 |
| KOC_Lambert | 24600 | Kuwait - onshore | 28.53 | 46.54 | 30.09 | 48.48 |
| Korea_2000_Korea_Central_Belt | 5181 | Korea, Republic of (South Korea) - 126°E to 128°E mainland | 33.96 | 126 | 38.33 | 128 |
| Korea_2000_Korea_Central_Belt_2010 | 5186 | Korea, Republic of (South Korea) - 126°E to 128°E onshore | 33.14 | 126 | 38.33 | 128 |
| Korea_2000_Korea_Central_Belt_Jeju | 5182 | Korea, Republic of (South Korea) - 126°E to 128°E Jeju | 33.14 | 126.09 | 33.61 | 127.01 |
| Korea_2000_Korea_East_Belt | 5183 | Korea, Republic of (South Korea) - east of 128°E onshore | 34.49 | 128 | 38.64 | 129.65 |
| Korea_2000_Korea_East_Belt_2010 | 5187 | Korea, Republic of (South Korea) - east of 128°E onshore | 34.49 | 128 | 38.64 | 129.65 |
| Korea_2000_Korea_East_Sea_Belt | 5184 | Korea, Republic of (South Korea) - 130°E to 132°E onshore | 37.39 | 130.71 | 37.62 | 131.01 |
| Korea_2000_Korea_East_Sea_Belt_2010 | 5188 | Korea, Republic of (South Korea) - 130°E to 132°E onshore | 37.39 | 130.71 | 37.62 | 131.01 |
| Korea_2000_Korea_Unified_Coordinate_ System | 5179 | Korea, Republic of (South Korea) | 28.6 | 122.71 | 40.27 | 134.28 |
| Korea_2000_Korea_West_Belt | 5180 | Korea, Republic of (South Korea) - 124°E to 126°E onshore | 33.99 | 124.53 | 38.04 | 126 |
| Korea_2000_Korea_West_Belt_2010 | 5185 | Korea, Republic of (South Korea) - 124°E to 126°E onshore | 33.99 | 124.53 | 38.04 | 126 |
| Korean_1985_Korea_Central_Belt | 2097 | Korea, Republic of (South Korea) - 126°E to 128°E mainland | 33.96 | 126 | 38.33 | 128 |
| Korean_1985_Korea_Central_Belt_Jeju | 5168 | Korea, Republic of (South Korea) - 126°E to 128°E Jeju | 33.14 | 126.09 | 33.61 | 127.01 |
| Korean_1985_Korea_East_Belt | 2096 | Korea, Republic of (South Korea) - east of 128°E onshore | 34.49 | 128 | 38.64 | 129.65 |
| Korean_1985_Korea_East_Sea_Belt | 5167 | Korea, Republic of (South Korea) - 130°E to 132°E onshore | 37.39 | 130.71 | 37.62 | 131.01 |
| Korean_1985_Korea_Unified_Coordinate _System | 5178 | Korea, Republic of (South Korea) - onshore | 33.14 | 124.53 | 38.64 | 131.01 |
| Korean_1985_Korea_West_Belt | 2098 | Korea, Republic of (South Korea) - 124°E to 126°E onshore | 33.99 | 124.53 | 38.04 | 126 |
| Korean_1985_Modified_Korea_Central_ Belt | 5174 | Korea, Republic of (South Korea) - 126°E to 128°E mainland | 33.96 | 126 | 38.33 | 128 |
| Korean_1985_Modified_Korea_Central_ Belt_Jeju | 5175 | Korea, Republic of (South Korea) - 126°E to 128°E Jeju | 33.14 | 126.09 | 33.61 | 127.01 |
| Korean_1985_Modified_Korea_East_Belt | 5176 | Korea, Republic of (South Korea) - east of 128°E onshore | 34.49 | 128 | 38.64 | 129.65 |
| Korean_1985_Modified_Korea_East_Sea_ Belt | 5177 | Korea, Republic of (South Korea) - 130°E to 132°E onshore | 37.39 | 130.71 | 37.62 | 131.01 |
| Korean_1985_Modified_Korea_West_ Belt | 5173 | Korea, Republic of (South Korea) - 124°E to 126°E onshore | 33.99 | 124.53 | 38.04 | 126 |
| KOSOVAREF01_Balkans_Zone_7 | 9141 | Kosovo | 41.85 | 19.97 | 43.25 | 21.8 |
| Kousseri_UTM_Zone_33N | 2313 | Cameroon - N'Djamena area | 11.7 | 14.17 | 12.77 | 15.09 |
| KUDAMS_KTM | 31901 | Kuwait - Kuwait City | 29.17 | 47.78 | 29.45 | 48.16 |
| Kyrg-06_TM_Zone_1 | 7692 | Kyrgyz Republic - 67°01'E to 70°01'E | 39.4 | 67.017 | 40.3 | 70.017 |
| Kyrg-06_TM_Zone_2 | 7693 | Kyrgyz Republic - 70°01'E to 73°01'E | 39.133 | 70.017 | 42.9 | 73.017 |
| Kyrg-06_TM_Zone_3 | 7694 | Kyrgyz Republic - 73°01'E to 76°01'E | 39.25 | 73.017 | 43.333 | 76.017 |
| Kyrg-06_TM_Zone_4 | 7695 | Kyrgyz Republic - 76°01'E to 79°01'E | 40.167 | 76.017 | 43 | 79.017 |
| Kyrg-06_TM_Zone_5 | 7696 | Kyrgyz Republic - 79°01'E to 82°01'E | 41.5 | 79.017 | 43 | 82.017 |
| La_Canoa_UTM_Zone_18N | 24718 | Venezuela - west of 72°W | 7.02 | -73.38 | 11.62 | -71.99 |
| La_Canoa_UTM_Zone_19N | 24719 | Venezuela - 72°W and 66°W onshore | 0.73 | -72 | 12.25 | -66 |
| La_Canoa_UTM_Zone_20N | 24720 | Venezuela - east of 66°W onshore | 0.64 | -66 | 11.23 | -59.8 |
| La_Canoa_UTM_Zone_21N | 24721 | Venezuela - east of 60°W, N hemisphere | 7.6 | -61 | 10 | -58 |
| Lake_Maracaibo_Grid | 2102 | Venezuela - Maracaibo area | 10 | -72.25 | 11 | -71.5 |
| Lake_Maracaibo_Grid_M1 | 2101 | Venezuela - Maracaibo area | 10 | -72.25 | 11 | -71.5 |
| Lake_Maracaibo_Grid_M3 | 2103 | Venezuela - Maracaibo area | 10 | -72.25 | 11 | -71.5 |
| Lake_Maracaibo_La_Rosa_Grid | 2104 | Venezuela - Maracaibo - blocks I II and III | 10 | -71.5 | 10.51 | -71.17 |
| Le_Pouce_1934_Mauritius_Grid | 3337 | Mauritius - mainland | -20.57 | 57.25 | -19.94 | 57.85 |
| LCC_Bangladesh | 102951 | Bangladesh | 18.56 | 88.01 | 26.64 | 92.67 |
| LCC_Gulshan | 102952 | Bangladesh | 18.56 | 88.01 | 26.64 | 92.67 |
| LGD2006_Libya_TM | 3177 | Libya | 19.5 | 9.31 | 35.23 | 26.21 |
| LGD2006_Libya_TM_Zone_10 | 3195 | Libya - 18°E to 20°E onshore | 21.54 | 18 | 32.17 | 20 |
| LGD2006_Libya_TM_Zone_11 | 3196 | Libya - 20°E to 22°E onshore | 20.54 | 20 | 33 | 22 |
| LGD2006_Libya_TM_Zone_12 | 3197 | Libya - 22°E to 24°E onshore | 19.5 | 22 | 32.97 | 24 |
| LGD2006_Libya_TM_Zone_13 | 3198 | Libya - east of 24°E onshore | 19.99 | 24 | 32.15 | 25.21 |
| LGD2006_Libya_TM_Zone_5 | 3190 | Libya - west of 10°E | 25.37 | 9.31 | 30.49 | 10.01 |
| LGD2006_Libya_TM_Zone_6 | 3191 | Libya - 10°E to 12°E onshore | 23.51 | 10 | 33.23 | 12 |
| LGD2006_Libya_TM_Zone_7 | 3192 | Libya - 12°E to 14°E onshore | 22.8 | 12 | 33.06 | 14 |
| LGD2006_Libya_TM_Zone_8 | 3193 | Libya - 14°E to 16°E onshore | 22.61 | 14 | 32.79 | 16 |
| LGD2006_Libya_TM_Zone_9 | 3194 | Libya - 16°E to 18°E onshore | 22.51 | 16 | 31.34 | 18.01 |
| LGD2006_UTM_Zone_32N | 3199 | Libya - west of 12°E | 23.51 | 9.31 | 33.92 | 12 |
| LGD2006_UTM_Zone_33N | 3201 | Libya - 12°E to 18°E | 22.51 | 12 | 35.23 | 18 |
| LGD2006_UTM_Zone_34N | 3202 | Libya - 18°E to 24°E | 19.5 | 17.99 | 35.03 | 24.01 |
| LGD2006_UTM_Zone_35N | 3203 | Libya - east of 24°E | 19.99 | 24 | 33.6 | 26.21 |
| Lisboa_Bessel_Bonne | 102163 | Portugal | 29.24 | -35.58 | 43.07 | -6.19 |
| Lisboa_Hayford_Gauss_IGeoE | 102164 | Portugal | 29.24 | -35.58 | 43.07 | -6.19 |
| Lisboa_Hayford_Gauss_IPCC | 102165 | Portugal | 29.24 | -35.58 | 43.07 | -6.19 |
| Lisbon_Lisbon_Portuguese_Grid | 20791 | Portugal - mainland - onshore | 36.95 | -9.56 | 42.16 | -6.19 |
| Lisbon_Portuguese_Grid_New | 5018 | Portugal - mainland - onshore | 36.95 | -9.56 | 42.16 | -6.19 |
| Little_Cayman_1961_UTM_Zone_17N | 3357 | Cayman Islands - Little Cayman and Cayman Brac | 19.63 | -80.14 | 19.78 | -79.69 |
| LKS_1992_Latvia_TM | 3059 | Latvia | 55.67 | 19.06 | 58.09 | 28.24 |
| LKS_1992_Latvia_TM_0 | 102440 | Latvia | 55.67 | 19.06 | 58.09 | 28.24 |
| LKS_1994_Lithuania_TM | 3346 | Lithuania | 53.89 | 19.02 | 56.45 | 26.82 |
| Locodjo_1965_TM_5_NW | 2164 | Cote d'Ivoire (Ivory Coast) - offshore | 1.02 | -7.55 | 5.19 | -3.11 |
| Locodjo_1965_UTM_Zone_29N | 2042 | Cote d'Ivoire (Ivory Coast) - west of 6°W | 4.29 | -8.61 | 10.74 | -6 |
| Locodjo_1965_UTM_Zone_30N | 2040 | Cote d'Ivoire (Ivory Coast) - east of 6°W | 4.92 | -6 | 10.46 | -2.48 |
| Lome_UTM_Zone_31N | 25231 | Togo | 2.91 | -0.15 | 11.14 | 2.42 |
| London_Survey_Grid | 102400 | UK - London | 51.2 | -0.7 | 51.8 | 0.6 |
| LUREF_Luxembourg_TM | 2169 | Luxembourg | 49.44 | 5.73 | 50.19 | 6.53 |
| Luzon_1911_UTM_Zone_50N | 102453 | Philippines - West of 120°E, N hemisphere | 3 | 114 | 22 | 120 |
| Luzon_1911_UTM_Zone_51N | 102454 | Philippines - 120°E to 126°E, N hemisphere | 3 | 120 | 24 | 126 |
| Luzon_1911_UTM_Zone_52N | 102455 | Philippines - East of 126°E, N hemisphere | 4 | 126 | 20 | 132 |
| Macao_1920_Macao_Grid | 8433 | China - Macao | 22.06 | 113.52 | 22.23 | 113.68 |
| Macao_2008_Macao_Grid | 102448 | Macao | 22.1 | 113.52 | 22.22 | 113.6 |
| Macedonian_State_Coordinate_System | 6204 | North Macedonia | 40.85 | 20.45 | 42.36 | 23.04 |
| Madeira_1936_UTM_Zone_28N | 2191 | Portugal - Madeira archipelago onshore | 32.35 | -17.31 | 33.15 | -16.23 |
| Madrid_1870_Madrid_Spain | 2062 | Spain - mainland onshore | 35.95 | -9.37 | 43.82 | 3.39 |
| MAGNA-SIRGAS_CMT12 | 103599 | Colombia | -4.23 | -84.77 | 15.51 | -66.87 |
| MAGNA_Arauca_2007 | 6244 | Colombia - Arauca - Arauca | 6.583 | -71.267 | 7.6 | -70.25 |
| MAGNA_Armenia_Quindio_2006 | 6245 | Colombia - Armenia - Quindio | 4.017 | -76.183 | 5.033 | -75.167 |
| MAGNA_Barranquilla_Atlantico_1997 | 6246 | Colombia - Barranquilla - Atlantico | 10.417 | -75.35 | 11.433 | -74.333 |
| MAGNA_Bogota_DC_2005 | 6247 | Colombia - Bogota D.C. - Bogota D.C. | 4.167 | -74.65 | 5.183 | -73.633 |
| MAGNA_Bucaramanga_Santander_2008 | 6248 | Colombia - Bucaramanga - Santander | 6.567 | -73.7 | 7.583 | -72.683 |
| MAGNA_Cali_Valle_del_Cauca_2009 | 6249 | Colombia - Cali - Valle del Cauca | 2.933 | -77.033 | 3.95 | -76.017 |
| MAGNA_Cartagena_Bolivar_2005 | 6250 | Colombia - Cartagena_Bolivar | 9.883 | -76.017 | 10.9 | -75 |
| MAGNA_Ciudad_Bogota | 102233 | Colombia region 8 | -4.23 | -74.4 | 7.1 | -66.87 |
| MAGNA_Colombia_Bogota | 3116 | Colombia - 75°35'W to 72°35'W | -2.51 | -75.59 | 11.82 | -72.58 |
| MAGNA_Colombia_Este | 3117 | Colombia - 72°35'W to 69°35'W | -4.23 | -72.59 | 12.52 | -69.58 |
| MAGNA_Colombia_Este_Este | 3118 | Colombia - east of 69°35'W | -2.25 | -69.59 | 6.31 | -66.87 |
| MAGNA_Colombia_Oeste | 3115 | Colombia - 78°35'W to 75°35'W | 0.03 | -78.59 | 10.21 | -75.58 |
| MAGNA_Colombia_Oeste_Oeste | 3114 | Colombia - west of 78°35'W | 1.23 | -79.1 | 2.48 | -78.58 |
| MAGNA_Cucuta_Norte_de_Santander_ 2011 | 6251 | Colombia - Cucuta - Norte de Santander | 7.383 | -73.017 | 8.4 | -72 |
| MAGNA_Florencia_Caqueta_2007 | 6252 | Colombia - Florencia - Caqueta | 1.117 | -76.133 | 2.133 | -75.117 |
| MAGNA_Ibague_Tolima_2007 | 6253 | Colombia - Ibague - Tolima | 3.917 | -75.683 | 4.933 | -74.667 |
| MAGNA_Inirida_Guainia_2008 | 6254 | Colombia - Inirida - Guainia | 3.333 | -68.417 | 4.35 | -67.4 |
| MAGNA_Leticia_Amazonas_1994 | 6255 | Colombia - Leticia - Amazonas | -4.7 | -70.45 | -3.683 | -69.433 |
| MAGNA_Manizales_Caldas_2011 | 6256 | Colombia - Manizales - Caldas | 4.567 | -76.017 | 5.583 | -75 |
| MAGNA_Medellin_Antioquia_2010 | 6257 | Colombia - Medellin - Antioquia | 5.717 | -76.067 | 6.733 | -75.05 |
| MAGNA_Mitu_Vaupes_2011 | 6258 | Colombia - Mitu - Vaupes | 0.733 | -70.75 | 1.75 | -69.733 |
| MAGNA_Mocoa_Putumayo_2011 | 6259 | Colombia - Mocoa - Putumayo | 0.633 | -77.167 | 1.65 | -76.15 |
| MAGNA_Monteria_Cordoba_2006 | 6260 | Colombia - Monteria - Cordoba | 8.267 | -76.383 | 9.283 | -75.367 |
| MAGNA_Neiva_Huila_2006 | 6261 | Colombia - Neiva - Huila | 2.433 | -75.8 | 3.45 | -74.783 |
| MAGNA_Pasto_Narino_2008 | 6262 | Colombia - Pasto - Narino | 0.7 | -77.767 | 1.717 | -76.75 |
| MAGNA_Pereira_Risaralda_2007 | 6263 | Colombia - Pereira - Risaralda | 4.3 | -76.2 | 5.317 | -75.183 |
| MAGNA_Popayan_Cauca_2006 | 6264 | Colombia - Popayan - Cauca | 2.95 | -77.117 | 2.967 | -76.1 |
| MAGNA_Puerto_Carreno_Vichada_2011 | 6265 | Colombia - Puerto - Carreno - Vichada | 5.667 | -68.017 | 6.683 | -67 |
| MAGNA_Quibdo_Choco_2011 | 6266 | Colombia - Quibdo - Choco | 5.183 | -77.167 | 6.2 | -76.15 |
| MAGNA_Riohacha_La_Guajira_2006 | 6267 | Colombia - Riohacha - La Guajira | 11.033 | -73.417 | 12.05 | -72.4 |
| MAGNA_San_Andres_2007 | 6268 | Colombia - San_Andres - San_Andres | 12.017 | -82.233 | 13.033 | -81.217 |
| MAGNA_San_Jose_del_Guaviare_2011 | 6269 | Colombia - San Jose del Guaviare - Guaviare | 2.05 | -73.15 | 3.067 | -72.133 |
| MAGNA_Santa_Marta_Magdalena_2007 | 6270 | Colombia - Santa Marta - Magdalena | 10.717 | -74.733 | 11.733 | -73.717 |
| MAGNA_Sucre_2006 | 6271 | Colombia - Sucre - Sucre | 8.3 | -75.233 | 9.317 | -74.217 |
| MAGNA_Tunja_Boyaca_1997 | 6272 | Colombia - Tunja - Boyaca | 5.033 | -73.867 | 6.05 | -72.85 |
| MAGNA_Valledupar_Cesar_2011 | 6273 | Colombia - Valledupar - Cesar | 9.933 | -73.583 | 10.95 | -73.567 |
| MAGNA_Villavicencio_Meta_2011 | 6274 | Colombia - Villavicencio - Meta | 3.65 | -74.133 | 4.667 | -73.117 |
| MAGNA_Yopal_Casanare_2006 | 6275 | Colombia - Yopal - Casanare | 4.85 | -72.933 | 5.867 | -71.917 |
| Makassar_Jakarta_NEIEZ | 5331 | Indonesia - Sulawesi SW | -6.54 | 118.71 | -1.88 | 120.78 |
| Makassar_NEIEZ | 3002 | Indonesia - Sulawesi SW | -6.54 | 118.71 | -1.88 | 120.78 |
| Malongo_1987_UTM_Zone_32S | 25932 | Africa - Angola (Cabinda) and DR Congo (Zaire) - offshore | -6.04 | 10.53 | -5.05 | 12.37 |
| Malongo_1987_UTM_zone_33S | 7992 | DR Congo (Zaire) - offshore | -6.04 | 11.79 | -5.79 | 12.37 |
| Manoca_1962_UTM_Zone_32N | 2215 | Cameroon - coastal area | 2.16 | 8.45 | 4.99 | 10.4 |
| MARGEN_UTM_Zone_19S | 5356 | Bolivia - west of 66°W | -22.91 | -69.66 | -9.77 | -66 |
| MARGEN_UTM_Zone_20S | 5355 | Bolivia - 66°W to 60°W | -22.87 | -66 | -9.67 | -60 |
| MARGEN_UTM_Zone_21S | 5357 | Bolivia - east of 60°W | -20.17 | -60 | -16.27 | -57.52 |
| Mars_2000_Equidistant_Cylindrical_sphe re | 103885 | World | -90 | -180 | 90 | 180 |
| Mars_2000_North_Pole_Stereographic_ sphere | 103883 | World - N hemisphere - north of 60~N | 60 | -180 | 90 | 180 |
| Mars_2000_Sinusoidal_sphere | 103886 | World | -90 | -180 | 90 | 180 |
| Mars_2000_South_Pole_Stereographic_ sphere | 103884 | World - S hemisphere - south of 60~S | -90 | -180 | -60 | 180 |
| Mars_2000_Winkel_Tripel_sphere | 103887 | World | -90 | -180 | 90 | 180 |
| Massawa_UTM_Zone_37N | 26237 | Eritrea | 12.36 | 36.44 | 18.1 | 43.31 |
| Maupiti_1983_UTM_Zone_5S | 3306 | French Polynesia - Society Islands - Maupiti | -16.57 | -152.39 | -16.34 | -152.14 |
| Mauritania_1999_UTM_Zone_28N | 3343 | Mauritania - 18°W to 12°W | 14.72 | -18 | 23.46 | -12 |
| Mauritania_1999_UTM_Zone_29N | 3344 | Mauritania - 12°W to 6°W | 14.75 | -12 | 27.3 | -6 |
| Mauritania_1999_UTM_Zone_30N | 3345 | Mauritania - east of 6°W | 15.49 | -6 | 25.74 | -4.8 |
| Merchich_Degree_UTM_Zone_28N | 102144 | Western Sahara | 18.98 | -20.68 | 27.67 | -8.66 |
| Merchich_Sahara_Nord | 26194 | Western Sahara - north of 24.3°N | 24.29 | -15.42 | 27.67 | -8.66 |
| Merchich_Sahara_Sud | 26195 | Western Sahara - south of 24.3°N | 20.71 | -17.16 | 24.31 | -12 |
| Mexican_Datum_1993_UTM_Zone_11N | 4484 | Mexico - west of 114°W | 15.01 | -122.19 | 32.72 | -114 |
| Mexican_Datum_1993_UTM_Zone_12N | 4485 | Mexico - 114°W to 108°W | 15.09 | -114 | 32.27 | -108 |
| Mexican_Datum_1993_UTM_Zone_13N | 4486 | Mexico - 108°W to 102°W | 14.05 | -108 | 31.79 | -102 |
| Mexican_Datum_1993_UTM_Zone_14N | 4487 | Mexico - 102°W to 96°W | 12.3 | -102 | 29.81 | -96 |
| Mexican_Datum_1993_UTM_Zone_15N | 4488 | Mexico - 96°W to 90°W | 12.1 | -96 | 26 | -90 |
| Mexican_Datum_1993_UTM_Zone_16N | 4489 | Mexico - east of 90°W | 17.81 | -90 | 25.77 | -84.64 |
| Mexico_ITRF2008_LCC | 6372 | Mexico | 12.1 | -122.19 | 32.72 | -84.64 |
| Mexico_ITRF2008_UTM_Zone_11N | 6366 | Mexico - west of 114°W | 15.01 | -122.19 | 32.72 | -114 |
| Mexico_ITRF2008_UTM_Zone_12N | 6367 | Mexico - 114°W to 108°W | 15.09 | -114 | 32.27 | -108 |
| Mexico_ITRF2008_UTM_Zone_13N | 6368 | Mexico - 108°W to 102°W | 14.05 | -108 | 31.79 | -102 |
| Mexico_ITRF2008_UTM_Zone_14N | 6369 | Mexico - 102°W to 96°W | 12.3 | -102 | 29.81 | -96 |
| Mexico_ITRF2008_UTM_Zone_15N | 6370 | Mexico - 96°W to 90°W | 12.1 | -96 | 26 | -90 |
| Mexico_ITRF2008_UTM_Zone_16N | 6371 | Mexico - east of 90°W | 17.81 | -90 | 25.77 | -84.64 |
| Mexico_ITRF92_LCC | 6362 | Mexico | 12.1 | -122.19 | 32.72 | -84.64 |
| MGI_1901_Balkans_zone_5 | 8677 | Europe - former Yugoslavia onshore west of 16.5°E | 42.95 | 13.38 | 46.88 | 16.5 |
| MGI_1901_Balkans_zone_6 | 8678 | Europe - former Yugoslavia onshore 16.5°E to 19.5°E | 41.79 | 16.5 | 46.55 | 19.51 |
| MGI_1901_Balkans_zone_7 | 6316 | Europe - former Yugoslavia onshore 19.5°E to 22.5°E | 40.85 | 19.5 | 46.19 | 22.51 |
| MGI_1901_Balkans_zone_8 | 8679 | Europe - former Yugoslavia onshore east of 22.5°E | 41.11 | 22.5 | 44.7 | 23.04 |
| MGI_1901_Slovene_National_Grid | 3912 | Slovenia | 45.42 | 13.38 | 46.88 | 16.61 |
| MGI_1901_Slovenia_Grid | 8686 | Slovenia | 45.42 | 13.38 | 46.88 | 16.61 |
| MGI_3_Degree_Gauss_Zone_5 | 31265 | Europe - former Yugoslavia onshore west of 16.5°E | 42.95 | 13.38 | 46.88 | 16.5 |
| MGI_3_Degree_Gauss_Zone_6 | 31266 | Europe - former Yugoslavia onshore 16.5°E to 19.5°E | 41.79 | 16.5 | 46.55 | 19.51 |
| MGI_3_Degree_Gauss_Zone_7 | 31267 | Europe - former Yugoslavia onshore 19.5°E to 22.5°E | 40.85 | 19.5 | 46.19 | 22.51 |
| MGI_3_Degree_Gauss_Zone_8 | 31268 | Europe - former Yugoslavia onshore east of 22.5°E | 41.11 | 22.5 | 44.7 | 23.04 |
| MGI_Austria_Central | 9272 | Austria - 11°50'E to 14°50'E | 46.4 | 11.83 | 48.79 | 14.84 |
| MGI_Austria_East | 9273 | Austria - east of 14°50'E | 46.56 | 14.83 | 49.02 | 17.17 |
| MGI_Austria_GK_Central | 31255 | Austria - 11°50'E to 14°50'E | 46.4 | 11.83 | 48.79 | 14.84 |
| MGI_Austria_GK_East | 31256 | Austria - east of 14°50'E | 46.56 | 14.83 | 49.02 | 17.17 |
| MGI_Austria_GK_M28 | 31257 | Austria - west of 11°50'E | 46.77 | 9.53 | 47.61 | 11.84 |
| MGI_Austria_GK_M31 | 31258 | Austria - 11°50'E to 14°50'E | 46.4 | 11.83 | 48.79 | 14.84 |
| MGI_Austria_GK_M34 | 31259 | Austria - east of 14°50'E | 46.56 | 14.83 | 49.02 | 17.17 |
| MGI_Austria_GK_West | 31254 | Austria - west of 11°50'E | 46.77 | 9.53 | 47.61 | 11.84 |
| MGI_Austria_Lambert | 31287 | Austria | 46.4 | 9.53 | 49.02 | 17.17 |
| MGI_Austria_West | 9271 | Austria - west of 11°50'E | 46.77 | 9.53 | 47.61 | 11.84 |
| MGI_Balkans_5 | 31275 | Europe - former Yugoslavia onshore west of 16.5°E | 42.95 | 13.38 | 46.88 | 16.5 |
| MGI_Balkans_6 | 31276 | Europe - former Yugoslavia onshore 16.5°E to 19.5°E | 41.79 | 16.5 | 46.55 | 19.51 |
| MGI_Balkans_7 | 31277 | Europe - former Yugoslavia onshore 19.5°E to 22.5°E | 40.85 | 19.5 | 46.19 | 22.51 |
| MGI_Balkans_8 | 31279 | Europe - former Yugoslavia onshore east of 22.5°E | 41.11 | 22.5 | 44.7 | 23.04 |
| MGI_Ferro_Austria_GK_Central | 31252 | Austria - 11°50'E to 14°50'E | 46.4 | 11.83 | 48.79 | 14.84 |
| MGI_Ferro_Austria_GK_East | 31253 | Austria - east of 14°50'E | 46.56 | 14.83 | 49.02 | 17.17 |
| MGI_Ferro_Austria_GK_West | 31251 | Austria - west of 11°50'E | 46.77 | 9.53 | 47.61 | 11.84 |
| MGI_Ferro_M28 | 31288 | Austria - west of 11°50'E | 46.77 | 9.53 | 47.61 | 11.84 |
| MGI_Ferro_M31 | 31289 | Austria - 11°50'E to 14°50'E | 46.4 | 11.83 | 48.79 | 14.84 |
| MGI_Ferro_M34 | 31290 | Austria - east of 14°50'E | 46.56 | 14.83 | 49.02 | 17.17 |
| MGI_M28 | 31284 | Austria - west of 11°50'E | 46.77 | 9.53 | 47.61 | 11.84 |
| MGI_M31 | 31285 | Austria - 11°50'E to 14°50'E | 46.4 | 11.83 | 48.79 | 14.84 |
| MGI_M34 | 31286 | Austria - east of 14°50'E | 46.56 | 14.83 | 49.02 | 17.17 |
| MGI_Slovenia_Grid | 2170 | Slovenia | 45.42 | 13.38 | 46.88 | 16.61 |
| Mhast_Offshore_UTM_Zone_32S | 3354 | Africa - Angola (Cabinda) and DR Congo (Zaire) - offshore | -6.04 | 10.53 | -5.05 | 12.37 |
| Mhast_Onshore_UTM_Zone_32S | 3353 | Africa - Angola (Cabinda) and DR Congo (Zaire) - coastal | -6.04 | 10.53 | -4.38 | 13.1 |
| Minna_UTM_Zone_31N | 26331 | Nigeria - offshore deep water - west of 6°E | 1.92 | 2.66 | 6.14 | 6 |
| Minna_UTM_Zone_32N | 26332 | Nigeria - offshore deep water - east of 6°E | 2.61 | 6 | 3.68 | 7.82 |
| MML07_Grid | 9373 | UK - London to Sheffield | 51.46 | -1.89 | 53.41 | 0.15 |
| MMN_Argentina_2 | 9252 | Argentina - Tierra del Fuego onshore | -55.11 | -68.64 | -52.59 | -63.73 |
| MMS_Argentina_2 | 9254 | Argentina - Tierra del Fuego onshore | -55.11 | -68.64 | -52.59 | -63.73 |
| MOLDREF99_Moldova_TM | 4026 | Moldova | 45.44 | 26.63 | 48.47 | 30.13 |
| MONREF_1997_UTM_Zone_46N | 102224 | Mongolia - west of 96°E | 43.01 | 87.76 | 50.89 | 96 |
| MONREF_1997_UTM_Zone_47N | 102225 | Mongolia - between 96°E and 102°E | 42.14 | 96 | 52.15 | 102 |
| MONREF_1997_UTM_Zone_48N | 102226 | Mongolia - between 102°E and 108°E | 41.58 | 102 | 51.42 | 108 |
| MONREF_1997_UTM_Zone_49N | 102227 | Mongolia - between 108°E and 114°E | 42.35 | 108 | 50.23 | 114 |
| MONREF_1997_UTM_Zone_50N | 102228 | Mongolia - east of 114°E | 44.9 | 114 | 50.32 | 119.94 |
| Monte_Mario_Italy_1 | 3003 | Italy - west of 12°E | 36.53 | 5.94 | 47.04 | 12 |
| Monte_Mario_Italy_2 | 3004 | Italy - east of 12°E | 34.76 | 12 | 47.1 | 18.99 |
| Monte_Mario_Rome_Italy_1 | 26591 | Italy - west of 12°E | 36.53 | 5.94 | 47.04 | 12 |
| Monte_Mario_Rome_Italy_2 | 26592 | Italy - east of 12°E | 34.76 | 12 | 47.1 | 18.99 |
| Monte_Mario_TM_Emilia-Romagna | 5659 | Italy - Emilia-Romagna | 43.73 | 9.19 | 45.14 | 12.76 |
| Montserrat_1958_British_West_Indies_ Grid | 2004 | Montserrat - onshore | 16.62 | -62.29 | 16.87 | -62.08 |
| Moon_2000_Equidistant_Cylindrical | 103881 | World | -90 | -180 | 90 | 180 |
| Moon_2000_Far_Side_Lambert_Azimuth al_Equal_Area | 103879 | Moon - Far Side | -90 | 90 | 90 | -90 |
| Moon_2000_Near_Side_Lambert_ Azimuthal_Equal_Area | 103880 | Moon - Near Side | -90 | -90 | 90 | 90 |
| Moon_2000_North_Pole_Stereographic | 103877 | World - N hemisphere - north of 60~N | 60 | -180 | 90 | 180 |
| Moon_2000_Sinusoidal | 103882 | World | -90 | -180 | 90 | 180 |
| Moon_2000_South_Pole_Stereographic | 103878 | World - S hemisphere - south of 60~S | -90 | -180 | -60 | 180 |
| Moorea_1987_UTM_Zone_6S | 3305 | French Polynesia - Society Islands - Moorea | -17.63 | -150 | -17.41 | -149.73 |
| MOP78_UTM_1S | 2988 | Wallis and Futuna - Wallis | -13.41 | -176.25 | -13.16 | -176.07 |
| Mount_Dillon_Tobago_Grid | 2066 | Trinidad and Tobago - Tobago - onshore | 11.08 | -60.9 | 11.41 | -60.44 |
| Moznet_UTM_Zone_36S | 3036 | Mozambique - west of 36°E | -27.58 | 30.21 | -11.41 | 36 |
| Moznet_UTM_Zone_37S | 3037 | Mozambique - 36°E to 42°E | -27.71 | 36 | -10.09 | 42 |
| Moznet_UTM_Zone_38S | 5629 | Mozambique - onshore east of 36°E | -18.98 | 35.99 | -10.42 | 40.9 |
| Mporaloko_UTM_Zone_32N | 26632 | Gabon - north of equator and west of 12°E onshore | 0 | 9.25 | 2.32 | 12 |
| Mporaloko_UTM_Zone_32S | 26692 | Gabon - west of 12°E | -6.37 | 7.03 | 2.32 | 12.01 |
| MTRF-2000_UTM_zone_36N | 8836 | Saudi Arabia - west of 36°E | 24.92 | 34.44 | 29.38 | 36.01 |
| MTRF-2000_UTM_zone_37N | 8837 | Saudi Arabia - 36°E to 42°E | 16.29 | 36 | 32.16 | 42 |
| MTRF-2000_UTM_zone_38N | 8838 | Saudi Arabia - 42°E to 48°E | 16.35 | 41.99 | 31.15 | 48 |
| MTRF-2000_UTM_zone_39N | 8839 | Saudi Arabia - 48°E to 54°E | 17.94 | 47.99 | 28.94 | 54.01 |
| MTRF-2000_UTM_zone_40N | 8840 | Saudi Arabia - east of 54°E | 19.66 | 54 | 22.77 | 55.67 |
| NAD_1927_10TM_AEP_Forest | 102178 | Canada - Alberta | 48.99 | -120 | 60 | -109.98 |
| NAD_1927_10TM_AEP_Resource | 102179 | Canada - Alberta | 48.99 | -120 | 60 | -109.98 |
| NAD_1927_3TM_111 | 3771 | Canada - Alberta - east of 112.5°W | 48.99 | -112.5 | 60 | -109.98 |
| NAD_1927_3TM_114 | 3772 | Canada - Alberta - 115.5°W to 112.5°W | 48.99 | -115.5 | 60 | -112.5 |
| NAD_1927_3TM_117 | 3773 | Canada - Alberta - 118.5°W to 115.5°W | 50.77 | -118.5 | 60 | -115.5 |
| NAD_1927_3TM_120 | 3800 | Canada - Alberta - west of 118.5°W | 52.88 | -120 | 60 | -118.5 |
| NAD_1927_Alaska_Albers_Feet | 2964 | USA - Alaska | 51.3 | 172.42 | 71.4 | -129.99 |
| NAD_1927_Alaska_Albers_Meters | 102117 | USA - Alaska | 51.3 | 172.42 | 71.4 | -129.99 |
| NAD_1927_BLM_Zone_10N | 4410 | USA - 126°W to 120°W | 30.54 | -126 | 49.09 | -119.99 |
| NAD_1927_BLM_Zone_11N | 4411 | USA - 120°W to 114°W | 30.88 | -120 | 49.01 | -114 |
| NAD_1927_BLM_Zone_12N | 4412 | USA - 114°W to 108°W | 31.33 | -114 | 49.01 | -108 |
| NAD_1927_BLM_Zone_13N | 4413 | USA - 108°W to 102°W | 28.98 | -108 | 49.01 | -102 |
| NAD_1927_BLM_Zone_14N | 32064 | USA - 102°W to 96°W and GoM OCS | 25.83 | -102 | 49.01 | -95.87 |
| NAD_1927_BLM_Zone_15N | 32065 | USA - 96°W to 90°W and GoM OCS | 25.61 | -96.01 | 49.38 | -89.86 |
| NAD_1927_BLM_Zone_16N | 32066 | USA - 90°W to 84°W and GoM OCS | 23.95 | -90.01 | 48.32 | -83.91 |
| NAD_1927_BLM_Zone_17N | 32067 | USA - 84°W to 78°W and GoM OCS | 23.81 | -84.09 | 46.13 | -77.99 |
| NAD_1927_BLM_Zone_18N | 4418 | USA - 78°W to 72°W | 28.28 | -78 | 45.03 | -72 |
| NAD_1927_BLM_Zone_19N | 4419 | USA - 72°W to 66°W | 33.61 | -72 | 47.47 | -65.99 |
| NAD_1927_BLM_Zone_1N | 4401 | USA - 180°W to 174°W - AK, OCS | 47.88 | -180 | 63.21 | -173.99 |
| NAD_1927_BLM_Zone_2N | 4402 | USA - 174°W to 168°W - AK, OCS | 48.66 | -174 | 73.05 | -167.99 |
| NAD_1927_BLM_Zone_3N | 4403 | USA - 168°W to 162°W - AK, OCS | 49.52 | -168 | 74.29 | -161.99 |
| NAD_1927_BLM_Zone_4N | 4404 | USA - 162°W to 156°W - AK, OCS | 50.98 | -162 | 74.71 | -155.99 |
| NAD_1927_BLM_Zone_59N | 4399 | USA - west of 174°E - AK, OCS | 49.01 | 167.65 | 56.28 | 174.01 |
| NAD_1927_BLM_Zone_5N | 4405 | USA - 156°W to 150°W - AK, OCS | 52.15 | -156 | 74.71 | -149.99 |
| NAD_1927_BLM_Zone_60N | 4400 | USA - 174°E to 180°E - AK, OCS | 47.92 | 174 | 56.67 | 180 |
| NAD_1927_BLM_Zone_6N | 4406 | USA - 150°W to 144°W - AK, OCS | 54.05 | -150 | 74.13 | -143.99 |
| NAD_1927_BLM_Zone_7N | 4407 | USA - 144°W to 138°W | 53.47 | -144 | 73.59 | -137.99 |
| NAD_1927_BLM_Zone_8N | 4408 | USA - 138°W to 132°W | 53.6 | -138 | 73.04 | -131.99 |
| NAD_1927_BLM_Zone_9N | 4409 | USA - 132°W to 126°W | 35.38 | -132 | 56.84 | -126 |
| NAD_1927_California_Teale_Albers | 3309 | USA - California | 32.53 | -124.45 | 42.01 | -114.12 |
| NAD_1927_CGQ77_MTM_10_SCoPQ | 2016 | Canada - Quebec - west of 78°W | 46.23 | -79.85 | 62.45 | -78 |
| NAD_1927_CGQ77_MTM_2_SCoPQ | 2008 | Canada - Quebec - east of 57°W | 46.6 | -57 | 53.76 | -54 |
| NAD_1927_CGQ77_MTM_3_SCoPQ | 2009 | Canada - Quebec - east of 60°W | 50.2 | -60 | 52.01 | -57.1 |
| NAD_1927_CGQ77_MTM_4_SCoPQ | 2010 | Canada - Quebec - 63°W to 60°W | 47.16 | -63 | 52.01 | -60 |
| NAD_1927_CGQ77_MTM_5_SCoPQ | 2011 | Canada - Quebec - 66°W to 63°W | 47.95 | -66 | 60.42 | -63 |
| NAD_1927_CGQ77_MTM_6_SCoPQ | 2012 | Canada - Quebec - 69°W to 66°W | 47.31 | -69 | 59 | -66 |
| NAD_1927_CGQ77_MTM_7_SCoPQ | 2013 | Canada - Quebec - 72°W to 69°W | 45.01 | -72 | 61.8 | -69 |
| NAD_1927_CGQ77_MTM_8_SCoPQ | 2014 | Canada - Quebec - 75°W to 72°W | 44.99 | -75 | 62.53 | -72 |
| NAD_1927_CGQ77_MTM_9_SCoPQ | 2015 | Canada - Quebec - 78°W to 75°W | 45.37 | -78 | 62.62 | -75 |
| NAD_1927_CGQ77_Quebec_Lambert | 2138 | Canada - Quebec | 44.99 | -79.85 | 62.62 | -57.1 |
| NAD_1927_CGQ77_UTM_Zone_17N | 2031 | Canada - Quebec - west of 78°W | 46.23 | -79.85 | 62.45 | -78 |
| NAD_1927_CGQ77_UTM_Zone_18N | 2032 | Canada - Quebec - 78°W to 72°W | 44.99 | -78 | 62.62 | -72 |
| NAD_1927_CGQ77_UTM_Zone_19N | 2033 | Canada - Quebec - 72°W to 66°W | 45.01 | -72 | 61.8 | -66 |
| NAD_1927_CGQ77_UTM_Zone_20N | 2034 | Canada - Quebec - 66°W to 60°W | 47.16 | -66 | 60.42 | -60 |
| NAD_1927_CGQ77_UTM_Zone_21N | 2035 | Canada - Quebec - east of 60°W | 50.2 | -60 | 52.01 | -57.1 |
| NAD_1927_Contiguous_USA_Albers | 5069 | USA - CONUS - onshore | 24.41 | -124.79 | 49.38 | -66.91 |
| NAD_1927_Cuba_Norte | 2085 | Cuba - onshore north of 21°30'N | 21.38 | -85.01 | 23.25 | -76.91 |
| NAD_1927_Cuba_Sur | 2086 | Cuba - onshore south of 21°30'N | 19.77 | -78.69 | 21.5 | -74.07 |
| NAD_1927_DEF_1976_MTM_10 | 2019 | Canada - Ontario - MTM zone 10 | 42.26 | -81 | 47.33 | -77.99 |
| NAD_1927_DEF_1976_MTM_11 | 2020 | Canada - Ontario - MTM zone 11 | 41.67 | -83.6 | 46 | -81 |
| NAD_1927_DEF_1976_MTM_12 | 2021 | Canada - Ontario - MTM zone 12 | 46 | -82.5 | 55.21 | -79.5 |
| NAD_1927_DEF_1976_MTM_13 | 2022 | Canada - Ontario - MTM zone 13 | 46 | -85.5 | 55.59 | -82.5 |
| NAD_1927_DEF_1976_MTM_14 | 2023 | Canada - Ontario - 88.5°W to 85.5°W | 47.17 | -88.5 | 56.7 | -85.5 |
| NAD_1927_DEF_1976_MTM_15 | 2024 | Canada - Ontario - 91.5°W to 88.5°W | 47.97 | -91.5 | 56.9 | -88.5 |
| NAD_1927_DEF_1976_MTM_16 | 2025 | Canada - Ontario - 94.5°W to 91.5°W | 48.06 | -94.5 | 55.2 | -91.5 |
| NAD_1927_DEF_1976_MTM_17 | 2026 | Canada - Ontario - west of 94.5°W | 48.69 | -95.16 | 53.24 | -94.5 |
| NAD_1927_DEF_1976_MTM_8 | 2017 | Canada - Ontario - east of 75°W | 44.98 | -75 | 45.65 | -74.35 |
| NAD_1927_DEF_1976_MTM_9 | 2018 | Canada - Ontario - 78°W to 75°W | 43.63 | -78 | 46.25 | -75 |
| NAD_1927_DEF_1976_UTM_Zone_15N | 2027 | Canada - Ontario - west of 90°W | 48.03 | -95.16 | 56.2 | -90 |
| NAD_1927_DEF_1976_UTM_Zone_16N | 2028 | Canada - Ontario - 90°W to 84°W | 46.11 | -90 | 56.9 | -84 |
| NAD_1927_DEF_1976_UTM_Zone_17N | 2029 | Canada - Ontario - 84°W to 78°W | 41.67 | -84 | 55.37 | -78 |
| NAD_1927_DEF_1976_UTM_Zone_18N | 2030 | Canada - Ontario - east of 78°W | 43.63 | -78 | 46.25 | -74.35 |
| NAD_1927_Georgia_Statewide_Albers | 102118 | USA - Georgia | 30.36 | -85.61 | 35.01 | -80.77 |
| NAD_1927_Guatemala_Norte | 32061 | Guatemala - north of 15°51'30''N | 15.85 | -91.86 | 17.83 | -88.34 |
| NAD_1927_Guatemala_Sur | 32062 | Guatemala - south of 15°51'30''N | 13.69 | -92.29 | 15.86 | -88.19 |
| NAD_1927_Michigan_GeoRef_Feet_US | 102120 | USA - Michigan | 41.69 | -90.42 | 48.32 | -82.13 |
| NAD_1927_Michigan_GeoRef_Meters | 102122 | USA - Michigan | 41.69 | -90.42 | 48.32 | -82.13 |
| NAD_1927_MTM_1 | 32081 | Canada - Newfoundland - east of 54.5°W | 46.56 | -54.5 | 49.89 | -52.54 |
| NAD27_MTM_zone_10 | 7991 | Canada - Ontario - MTM zone 10 | 42.26 | -81 | 47.33 | -77.99 |
| NAD_1927_MTM_2 | 32082 | Canada - Newfoundland and Labrador - 57.5°W to 54.5°W | 46.81 | -57.5 | 54.71 | -54.5 |
| NAD_1927_MTM_3 | 32083 | Canada - Newfoundland and Labrador - 60°W to 57.5°W | 47.5 | -59.48 | 50.54 | -57.5 |
| NAD_1927_MTM_4 | 32084 | Canada - Labrador - 63°W to 60°W | 52 | -63 | 58.92 | -60 |
| NAD_1927_MTM_5 | 32085 | Canada - Labrador - 66°W to 63°W | 51.58 | -66 | 60.52 | -63 |
| NAD_1927_MTM_6 | 32086 | Canada - Labrador - west of 66°W | 52.05 | -67.81 | 55.34 | -66 |
| NAD_1927_MTQ_Lambert | 3797 | Canada - Quebec | 44.99 | -79.85 | 62.62 | -57.1 |
| NAD_1927_New_Brunswick_ Stereographic | 5588 | Canada - New Brunswick | 44.56 | -69.05 | 48.07 | -63.7 |
| NAD_1927_Quebec_Lambert | 32098 | Canada - Quebec | 44.99 | -79.85 | 62.62 | -57.1 |
| NAD_1927_StatePlane_Alabama_East_ FIPS_0101 | 26729 | USA - Alabama - SPCS - E | 30.99 | -86.79 | 35 | -84.89 |
| NAD_1927_StatePlane_Alabama_West_ FIPS_0102 | 26730 | USA - Alabama - SPCS - W | 30.14 | -88.48 | 35.02 | -86.3 |
| NAD_1927_StatePlane_Alaska_10_FIPS_ 5010 | 26740 | USA - Alaska - Aleutian Islands | 51.3 | 172.42 | 54.34 | -164.84 |
| NAD_1927_StatePlane_Alaska_1_FIPS_ 5001 | 26731 | USA - Alaska - Panhandle | 54.61 | -141 | 60.35 | -129.99 |
| NAD_1927_StatePlane_Alaska_2_FIPS_ 5002 | 26732 | USA - Alaska - 144°W to 141°W | 59.72 | -144.01 | 70.16 | -140.98 |
| NAD_1927_StatePlane_Alaska_3_FIPS_ 5003 | 26733 | USA - Alaska - 148°W to 144°W | 59.72 | -148 | 70.38 | -144 |
| NAD_1927_StatePlane_Alaska_4_FIPS_ 5004 | 26734 | USA - Alaska - 152°W to 148°W | 59.11 | -152.01 | 70.63 | -147.99 |
| NAD_1927_StatePlane_Alaska_5_FIPS_ 5005 | 26735 | USA - Alaska - 156°W to 152°W | 55.72 | -156 | 71.28 | -151.86 |
| NAD_1927_StatePlane_Alaska_6_FIPS_ 5006 | 26736 | USA - Alaska - 160°W to 156°W | 54.89 | -160 | 71.4 | -155.99 |
| NAD_1927_StatePlane_Alaska_7_FIPS_ 5007 | 26737 | USA - Alaska - 164°W to 160°W | 54.32 | -164.01 | 70.74 | -160 |
| NAD_1927_StatePlane_Alaska_8_FIPS_ 5008 | 26738 | USA - Alaska - north of 54.5°N; 168°W to 164°W | 54.34 | -168.26 | 69.05 | -164 |
| NAD_1927_StatePlane_Alaska_9_FIPS_ 5009 | 26739 | USA - Alaska - north of 54.5°N; west of 168°W | 56.49 | -173.16 | 65.82 | -168 |
| NAD_1927_StatePlane_Arizona_Central_ FIPS_0202 | 26749 | USA - Arizona - SPCS - C | 31.33 | -113.35 | 37.01 | -110.44 |
| NAD_1927_StatePlane_Arizona_East_ FIPS_0201 | 26748 | USA - Arizona - SPCS - E | 31.33 | -111.71 | 37.01 | -109.04 |
| NAD_1927_StatePlane_Arizona_West_ FIPS_0203 | 26750 | USA - Arizona - SPCS - W | 32.05 | -114.81 | 37 | -112.52 |
| NAD_1927_StatePlane_Arkansas_North_ FIPS_0301 | 26751 | USA - Arkansas - SPCS - N | 34.67 | -94.62 | 36.5 | -89.64 |
| NAD_1927_StatePlane_Arkansas_South_ FIPS_0302 | 26752 | USA - Arkansas - SPCS - S | 33.01 | -94.48 | 35.1 | -90.4 |
| NAD_1927_StatePlane_California_I_FIPS_ 0401 | 26741 | USA - California - SPCS - 1 | 39.59 | -124.45 | 42.01 | -119.99 |
| NAD_1927_StatePlane_California_II_FIPS _0402 | 26742 | USA - California - SPCS - 2 | 38.02 | -124.06 | 40.16 | -119.54 |
| NAD_1927_StatePlane_California_III_FIPS _0403 | 26743 | USA - California - SPCS - 3 | 36.73 | -123.02 | 38.71 | -117.83 |
| NAD_1927_StatePlane_California_IV_FIPS _0404 | 26744 | USA - California - SPCS - 4 | 35.78 | -122.01 | 37.58 | -115.62 |
| NAD_1927_StatePlane_California_V_FIPS _0405 | 26745 | USA - California - SPCS27 - 5 | 32.76 | -121.43 | 35.81 | -114.12 |
| NAD_1927_StatePlane_California_VI_FIPS _0406 | 26746 | USA - California - SPCS - 6 | 32.53 | -118.15 | 34.08 | -114.42 |
| NAD_1927_StatePlane_California_VII_ FIPS_0407 | 26799 | USA - California - SPCS27 - 7 | 33.66 | -118.96 | 34.83 | -117.63 |
| NAD_1927_StatePlane_California_V_ Ventura | 102699 | USA - California - SPCS27 - 5 | 32.76 | -121.43 | 35.81 | -114.12 |
| NAD_1927_StatePlane_Colorado_Central _FIPS_0502 | 26754 | USA - Colorado - SPCS - C | 38.14 | -109.06 | 40.09 | -102.04 |
| NAD_1927_StatePlane_Colorado_North_ FIPS_0501 | 26753 | USA - Colorado - SPCS - N | 39.56 | -109.06 | 41.01 | -102.04 |
| NAD_1927_StatePlane_Colorado_South_ FIPS_0503 | 26755 | USA - Colorado - SPCS - S | 36.98 | -109.06 | 38.68 | -102.04 |
| NAD_1927_StatePlane_Connecticut_FIPS _0600 | 26756 | USA - Connecticut | 40.98 | -73.73 | 42.05 | -71.78 |
| NAD_1927_StatePlane_Delaware_FIPS_ 0700 | 26757 | USA - Delaware | 38.44 | -75.8 | 39.85 | -74.97 |
| NAD_1927_StatePlane_Florida_East_FIPS _0901 | 26758 | USA - Florida - SPCS - E | 24.41 | -82.33 | 30.83 | -79.97 |
| NAD_1927_StatePlane_Florida_North_ FIPS_0903 | 26760 | USA - Florida - SPCS - N | 29.21 | -87.63 | 31.01 | -82.04 |
| NAD_1927_StatePlane_Florida_West_ FIPS_0902 | 26759 | USA - Florida - SPCS - W | 26.27 | -83.34 | 29.6 | -81.13 |
| NAD_1927_StatePlane_Georgia_East_ FIPS_1001 | 26766 | USA - Georgia - SPCS - E | 30.36 | -83.47 | 34.68 | -80.77 |
| NAD_1927_StatePlane_Georgia_West_ FIPS_1002 | 26767 | USA - Georgia - SPCS - W | 30.62 | -85.61 | 35.01 | -82.99 |
| NAD_1927_StatePlane_Guam_FIPS_5400 | 65061 | Guam | 10.95 | 141.19 | 15.91 | 148.18 |
| NAD_1927_StatePlane_Idaho_Central_ FIPS_1102 | 26769 | USA - Idaho - SPCS - C | 41.99 | -115.3 | 45.7 | -112.68 |
| NAD_1927_StatePlane_Idaho_East_FIPS_ 1101 | 26768 | USA - Idaho - SPCS - E | 41.99 | -113.24 | 44.75 | -111.04 |
| NAD_1927_StatePlane_Idaho_West_FIPS _1103 | 26770 | USA - Idaho - SPCS - W | 41.99 | -117.24 | 49.01 | -114.32 |
| NAD_1927_StatePlane_Illinois_East_FIPS _1201 | 26771 | USA - Illinois - SPCS - E | 37.06 | -89.28 | 42.5 | -87.02 |
| NAD_1927_StatePlane_Illinois_West_FIPS _1202 | 26772 | USA - Illinois - SPCS - W | 36.98 | -91.52 | 42.51 | -88.93 |
| NAD_1927_StatePlane_Indiana_East_FIPS _1301 | 26773 | USA - Indiana - SPCS - E | 37.95 | -86.59 | 41.77 | -84.78 |
| NAD_1927_StatePlane_Indiana_West_ FIPS_1302 | 26774 | USA - Indiana - SPCS - W | 37.77 | -88.06 | 41.77 | -86.24 |
| NAD_1927_StatePlane_Iowa_North_FIPS _1401 | 26775 | USA - Iowa - SPCS - N | 41.85 | -96.65 | 43.51 | -90.15 |
| NAD_1927_StatePlane_Iowa_South_FIPS _1402 | 26776 | USA - Iowa - SPCS - S | 40.37 | -96.14 | 42.04 | -90.14 |
| NAD_1927_StatePlane_Kansas_North_ FIPS_1501 | 26777 | USA - Kansas - SPCS - N | 38.52 | -102.06 | 40.01 | -94.58 |
| NAD_1927_StatePlane_Kansas_South_ FIPS_1502 | 26778 | USA - Kansas - SPCS - S | 36.99 | -102.05 | 38.88 | -94.6 |
| NAD_1927_StatePlane_Kentucky_North_ FIPS_1601 | 26779 | USA - Kentucky - SPCS - N | 37.71 | -85.96 | 39.15 | -82.47 |
| NAD_1927_StatePlane_Kentucky_South_ FIPS_1602 | 26780 | USA - Kentucky - SPCS - S | 36.49 | -89.57 | 38.17 | -81.95 |
| NAD_1927_StatePlane_Louisiana_North_ FIPS_1701 | 26781 | USA - Louisiana - SPCS - N | 30.85 | -94.05 | 33.03 | -90.86 |
| NAD_1927_StatePlane_Louisiana_ Offshore_FIPS_1703 | 32099 | USA - Louisiana | 28.85 | -94.05 | 33.03 | -88.75 |
| NAD_1927_StatePlane_Louisiana_South_ FIPS_1702 | 26782 | USA - Louisiana - SPCS27 - S | 27.82 | -93.94 | 31.07 | -87.76 |
| NAD_1927_StatePlane_Maine_East_FIPS _1801 | 26783 | USA - Maine - SPCS - E | 43.88 | -70.03 | 47.47 | -66.91 |
| NAD_1927_StatePlane_Maine_West_FIPS _1802 | 26784 | USA - Maine - SPCS - W | 43.04 | -71.09 | 46.58 | -69.26 |
| NAD_1927_StatePlane_Maryland_FIPS_ 1900 | 26785 | USA - Maryland | 37.97 | -79.49 | 39.73 | -74.97 |
| NAD_1927_StatePlane_Massachusetts_ Island_FIPS_2002 | 26787 | USA - Massachusetts - SPCS - islands | 41.19 | -70.91 | 41.51 | -69.89 |
| NAD_1927_StatePlane_Massachusetts_ Mainland_FIPS_2001 | 26786 | USA - Massachusetts - SPCS - mainland | 41.46 | -73.5 | 42.89 | -69.86 |
| NAD_1927_StatePlane_Michigan_Central _FIPS_2112 | 26789 | USA - Michigan - SPCS - C | 43.8 | -87.06 | 45.92 | -82.27 |
| NAD_1927_StatePlane_Michigan_Central _Old_FIPS_2102 | 5624 | USA - Michigan - SPCS - old central | 41.75 | -87.61 | 46.11 | -84.6 |
| NAD_1927_StatePlane_Michigan_East_ Old_FIPS_2101 | 5623 | USA - Michigan - SPCS - E | 41.69 | -84.87 | 46.04 | -82.13 |
| NAD_1927_StatePlane_Michigan_North_ FIPS_2111 | 26788 | USA - Michigan - SPCS - N | 45.08 | -90.42 | 48.32 | -83.44 |
| NAD_1927_StatePlane_Michigan_South_ FIPS_2113 | 26790 | USA - Michigan - SPCS - S | 41.69 | -87.2 | 44.22 | -82.13 |
| NAD_1927_StatePlane_Michigan_West_ Old_FIPS_2103 | 5625 | USA - Michigan - SPCS - W | 45.09 | -90.42 | 48.32 | -83.44 |
| NAD_1927_StatePlane_Minnesota_ Central_FIPS_2202 | 26792 | USA - Minnesota - SPCS - C | 45.28 | -96.86 | 47.48 | -92.29 |
| NAD_1927_StatePlane_Minnesota_North _FIPS_2201 | 26791 | USA - Minnesota - SPCS - N | 46.64 | -97.22 | 49.38 | -89.49 |
| NAD_1927_StatePlane_Minnesota_South _FIPS_2203 | 26793 | USA - Minnesota - SPCS - S | 43.49 | -96.85 | 45.59 | -91.21 |
| NAD_1927_StatePlane_Mississippi_East_ FIPS_2301 | 26794 | USA - Mississippi - SPCS - E | 30.01 | -89.97 | 35.01 | -88.09 |
| NAD_1927_StatePlane_Mississippi_West _FIPS_2302 | 26795 | USA - Mississippi - SPCS - W | 31 | -91.65 | 35.01 | -89.37 |
| NAD_1927_StatePlane_Missouri_Central _FIPS_2402 | 26797 | USA - Missouri - SPCS - C | 36.48 | -93.79 | 40.61 | -91.41 |
| NAD_1927_StatePlane_Missouri_East_ FIPS_2401 | 26796 | USA - Missouri - SPCS - E | 35.98 | -91.97 | 40.61 | -89.1 |
| NAD_1927_StatePlane_Missouri_West_ FIPS_2403 | 26798 | USA - Missouri - SPCS - W | 36.48 | -95.77 | 40.59 | -93.48 |
| NAD_1927_StatePlane_Montana_Central _FIPS_2502 | 32002 | USA - Montana - SPCS27 - C | 46.17 | -116.06 | 48.26 | -104.04 |
| NAD_1927_StatePlane_Montana_North_ FIPS_2501 | 32001 | USA - Montana - SPCS27 - N | 47.41 | -116.07 | 49.01 | -104.04 |
| NAD_1927_StatePlane_Montana_South_ FIPS_2503 | 32003 | USA - Montana - SPCS27 - S | 44.35 | -114.57 | 46.87 | -104.04 |
| NAD_1927_StatePlane_Nebraska_North_ FIPS_2601 | 32005 | USA - Nebraska - SPCS27 - N | 41.68 | -104.06 | 43.01 | -96.07 |
| NAD_1927_StatePlane_Nebraska_South_ FIPS_2602 | 32006 | USA - Nebraska - SPCS27 - S | 39.99 | -104.06 | 42.01 | -95.3 |
| NAD_1927_StatePlane_Nevada_Central_ FIPS_2702 | 32008 | USA - Nevada - SPCS - C | 36 | -118.19 | 41 | -114.99 |
| NAD_1927_StatePlane_Nevada_East_ FIPS_2701 | 32007 | USA - Nevada - SPCS - E | 34.99 | -117.01 | 42 | -114.03 |
| NAD_1927_StatePlane_Nevada_West_ FIPS_2703 | 32009 | USA - Nevada - SPCS - W | 36.95 | -120 | 42 | -116.99 |
| NAD_1927_StatePlane_New_Hampshire_ FIPS_2800 | 32010 | USA - New Hampshire | 42.69 | -72.56 | 45.31 | -70.63 |
| NAD_1927_StatePlane_New_Jersey_FIPS _2900 | 32011 | USA - New Jersey | 38.87 | -75.6 | 41.36 | -73.88 |
| NAD_1927_StatePlane_New_Mexico_ Central_FIPS_3002 | 32013 | USA - New Mexico - SPCS27 - C | 31.78 | -107.73 | 37 | -104.83 |
| NAD_1927_StatePlane_New_Mexico_ East_FIPS_3001 | 32012 | USA - New Mexico - SPCS - E | 32 | -105.72 | 37 | -102.99 |
| NAD_1927_StatePlane_New_Mexico_ West_FIPS_3003 | 32014 | USA - New Mexico - SPCS27 - W | 31.33 | -109.06 | 37 | -106.32 |
| NAD_1927_StatePlane_New_York_ Central_FIPS_3102 | 32016 | USA - New York - SPCS - C | 41.99 | -77.75 | 44.41 | -75.04 |
| NAD_1927_StatePlane_New_York_East_ FIPS_3101 | 32015 | USA - New York - SPCS - E | 40.88 | -75.87 | 45.02 | -73.23 |
| NAD_1927_StatePlane_New_York_Long_ Island_FIPS_3104 | 4456 | USA - New York - SPCS - Long Island | 40.47 | -74.26 | 41.3 | -71.8 |
| NAD_1927_StatePlane_New_York_West_ FIPS_3103 | 32017 | USA - New York - SPCS - W | 41.99 | -79.77 | 43.64 | -77.36 |
| NAD_1927_StatePlane_North_Carolina_ FIPS_3200 | 32019 | USA - North Carolina | 33.83 | -84.33 | 36.59 | -75.38 |
| NAD_1927_StatePlane_North_Dakota_ North_FIPS_3301 | 32020 | USA - North Dakota - SPCS - N | 47.15 | -104.07 | 49.01 | -96.83 |
| NAD_1927_StatePlane_North_Dakota_ South_FIPS_3302 | 32021 | USA - North Dakota - SPCS - S | 45.93 | -104.05 | 47.83 | -96.55 |
| NAD_1927_StatePlane_Ohio_North_FIPS _3401 | 32022 | USA - Ohio - SPCS - N | 40.1 | -84.81 | 42.33 | -80.51 |
| NAD_1927_StatePlane_Ohio_South_FIPS _3402 | 32023 | USA - Ohio - SPCS - S | 38.4 | -84.83 | 40.36 | -80.7 |
| NAD_1927_StatePlane_Oklahoma_North _FIPS_3501 | 32024 | USA - Oklahoma - SPCS - N | 35.27 | -103 | 37.01 | -94.42 |
| NAD_1927_StatePlane_Oklahoma_South _FIPS_3502 | 32025 | USA - Oklahoma - SPCS - S | 33.62 | -100 | 35.57 | -94.42 |
| NAD_1927_StatePlane_Oregon_North_ FIPS_3601 | 32026 | USA - Oregon - SPCS - N | 43.95 | -124.17 | 46.26 | -116.47 |
| NAD_1927_StatePlane_Oregon_South_ FIPS_3602 | 32027 | USA - Oregon - SPCS - S | 41.98 | -124.6 | 44.56 | -116.9 |
| NAD_1927_StatePlane_Pennsylvania_ North_FIPS_3701 | 32028 | USA - Pennsylvania - SPCS - N | 40.6 | -80.53 | 42.53 | -74.7 |
| NAD_1927_StatePlane_Pennsylvania_ South_FIPS_3702 | 4455 | USA - Pennsylvania - SPCS - S | 39.71 | -80.53 | 41.18 | -74.72 |
| NAD_1927_StatePlane_Puerto_Rico_FIPS _5201 | 32059 | Puerto Rico | 14.92 | -68.49 | 21.86 | -65.04 |
| NAD_1927_StatePlane_Rhode_Island_ FIPS_3800 | 32030 | USA - Rhode Island | 41.13 | -71.85 | 42.02 | -71.08 |
| NAD_1927_StatePlane_South_Carolina_ North_FIPS_3901 | 32031 | USA - South Carolina - SPCS27 - N | 33.46 | -83.36 | 35.21 | -78.52 |
| NAD_1927_StatePlane_South_Carolina_ South_FIPS_3902 | 32033 | USA - South Carolina - SPCS27 - S | 32.05 | -82.03 | 33.95 | -78.95 |
| NAD_1927_StatePlane_South_Dakota_ North_FIPS_4001 | 32034 | USA - South Dakota - SPCS - N | 44.14 | -104.07 | 45.95 | -96.45 |
| NAD_1927_StatePlane_South_Dakota_ South_FIPS_4002 | 32035 | USA - South Dakota - SPCS - S | 42.48 | -104.06 | 44.79 | -96.43 |
| NAD_1927_StatePlane_Tennessee_FIPS_ 4100 | 2204 | USA - Tennessee | 34.98 | -90.31 | 36.68 | -81.65 |
| NAD_1927_StatePlane_Texas_Central_ FIPS_4203 | 32039 | USA - Texas - SPCS - C | 29.78 | -106.66 | 32.27 | -93.5 |
| NAD_1927_StatePlane_Texas_North_ Central_FIPS_4202 | 32038 | USA - Texas - SPCS - NC | 31.72 | -103.07 | 34.58 | -94 |
| NAD_1927_StatePlane_Texas_North_FIPS _4201 | 32037 | USA - Texas - SPCS - N | 34.3 | -103.03 | 36.5 | -99.99 |
| NAD_1927_StatePlane_Texas_South_ Central_FIPS_4204 | 32040 | USA - Texas - SPCS27 - SC | 27.78 | -105 | 30.67 | -93.41 |
| NAD_1927_StatePlane_Texas_South_FIPS _4205 | 32041 | USA - Texas - SPCS27 - S | 25.83 | -100.2 | 28.21 | -95.37 |
| NAD_1927_StatePlane_Utah_Central_ FIPS_4302 | 32043 | USA - Utah - SPCS - C | 38.49 | -114.05 | 41.08 | -109.04 |
| NAD_1927_StatePlane_Utah_North_FIPS _4301 | 32042 | USA - Utah - SPCS - N | 40.55 | -114.04 | 42.01 | -109.04 |
| NAD_1927_StatePlane_Utah_South_FIPS _4303 | 32044 | USA - Utah - SPCS - S | 36.99 | -114.05 | 38.58 | -109.04 |
| NAD_1927_StatePlane_Vermont_FIPS_ 4400 | 32045 | USA - Vermont | 42.72 | -73.44 | 45.03 | -71.5 |
| NAD_1927_StatePlane_Virginia_North_ FIPS_4501 | 32046 | USA - Virginia - SPCS - N | 37.77 | -80.06 | 39.46 | -76.51 |
| NAD_1927_StatePlane_Virginia_South_ FIPS_4502 | 32047 | USA - Virginia - SPCS - S | 36.54 | -83.68 | 38.28 | -75.31 |
| NAD_1927_StatePlane_Virgin_Islands_ St_Croix_FIPS_5202 | 32060 | Virgin Islands, US | 16.22 | -66.05 | 21.83 | -63.88 |
| NAD_1927_StatePlane_Washington_ North_FIPS_4601 | 32048 | USA - Washington - SPCS27 - N | 47.08 | -124.79 | 49.05 | -117.02 |
| NAD_1927_StatePlane_Washington_ South_FIPS_4602 | 32049 | USA - Washington - SPCS27 - S | 45.54 | -124.4 | 47.96 | -116.91 |
| NAD_1927_StatePlane_West_Virginia_ North_FIPS_4701 | 32050 | USA - West Virginia - SPCS - N | 38.76 | -81.76 | 40.64 | -77.72 |
| NAD_1927_StatePlane_West_Virginia_ South_FIPS_4702 | 32051 | USA - West Virginia - SPCS - S | 37.2 | -82.65 | 39.17 | -79.05 |
| NAD_1927_StatePlane_Wisconsin_Centra l_FIPS_4802 | 32053 | USA - Wisconsin - SPCS - C | 43.98 | -92.89 | 45.8 | -86.25 |
| NAD_1927_StatePlane_Wisconsin_North _FIPS_4801 | 32052 | USA - Wisconsin - SPCS - N | 45.37 | -92.89 | 47.31 | -88.05 |
| NAD_1927_StatePlane_Wisconsin_South _FIPS_4803 | 32054 | USA - Wisconsin - SPCS - S | 42.48 | -91.43 | 44.33 | -86.95 |
| NAD_1927_StatePlane_Wyoming_East_ Central_FIPS_4902 | 32056 | USA - Wyoming - SPCS - EC | 40.99 | -108.63 | 45.01 | -106 |
| NAD_1927_StatePlane_Wyoming_East_ FIPS_4901 | 32055 | USA - Wyoming - SPCS - E | 40.99 | -106.33 | 45.01 | -104.05 |
| NAD_1927_StatePlane_Wyoming_West_ Central_FIPS_4903 | 32057 | USA - Wyoming - SPCS - WC | 40.99 | -111.06 | 45.01 | -107.5 |
| NAD_1927_StatePlane_Wyoming_West_ FIPS_4904 | 32058 | USA - Wyoming - SPCS - W | 40.99 | -111.06 | 44.67 | -109.04 |
| NAD_1927_Texas_Statewide_Mapping_ System | 3080 | USA - Texas | 25.83 | -106.66 | 36.5 | -93.5 |
| NAD_1927_UTM_Zone_10N | 26710 | North America - 126°W to 120°W and NAD27 by country - onshore | 34.4 | -126 | 77.13 | -120 |
| NAD_1927_UTM_Zone_11N | 26711 | North America - 120°W to 114°W and NAD27 by country - onshore | 26.93 | -120 | 78.13 | -114 |
| NAD_1927_UTM_Zone_12N | 26712 | North America - 114°W to 108°W and NAD27 by country | 18.66 | -114 | 78.81 | -108 |
| NAD_1927_UTM_Zone_13N | 26713 | North America - 108°W to 102°W and NAD27 by country | 17.86 | -108 | 79.42 | -102 |
| NAD_1927_UTM_Zone_14N | 26714 | North America - 102°W to 96°W and NAD27 by country | 15.59 | -102 | 80.74 | -96 |
| NAD_1927_UTM_Zone_15N | 26715 | North America - 96°W to 90°W and NAD27 by country | 13.63 | -96 | 81.96 | -90 |
| NAD_1927_UTM_Zone_16N | 26716 | North America - 90°W to 84°W and NAD27 by country | 9.27 | -90.01 | 82.54 | -84 |
| NAD_1927_UTM_Zone_17N | 26717 | North America - 84°W to 78°W and NAD27 by country | 7.98 | -84 | 83.03 | -78 |
| NAD_1927_UTM_Zone_18N | 26718 | North America - 78°W to 72°W and NAD27 by country | 18.83 | -78 | 83.16 | -72 |
| NAD_1927_UTM_Zone_19N | 26719 | North America - 72°W to 66°W and NAD27 by country | 33.61 | -72 | 83.17 | -66 |
| NAD_1927_UTM_Zone_1N | 26701 | USA - 180°W to 174°W - AK, OCS | 47.88 | -180 | 63.21 | -173.99 |
| NAD_1927_UTM_Zone_20N | 26720 | North America - 66°W to 60°W and NAD27 by country | 38.21 | -66 | 82.97 | -60 |
| NAD_1927_UTM_Zone_21N | 26721 | Canada - 60°W to 54°W and NAD27 | 40.57 | -60 | 68.93 | -54 |
| NAD_1927_UTM_Zone_22N | 26722 | Canada - 54°W to 48°W | 39.5 | -54 | 57.65 | -48 |
| NAD_1927_UTM_Zone_2N | 26702 | USA - 174°W to 168°W - AK, OCS | 48.66 | -174 | 73.05 | -167.99 |
| NAD_1927_UTM_Zone_3N | 26703 | USA - 168°W to 162°W - AK, OCS | 49.52 | -168 | 74.29 | -161.99 |
| NAD_1927_UTM_Zone_4N | 26704 | USA - 162°W to 156°W - AK, OCS | 50.98 | -162 | 74.71 | -155.99 |
| NAD_1927_UTM_Zone_59N | 3370 | USA - west of 174°E - AK, OCS | 49.01 | 167.65 | 56.28 | 174.01 |
| NAD_1927_UTM_Zone_5N | 26705 | USA - 156°W to 150°W - AK, OCS | 52.15 | -156 | 74.71 | -149.99 |
| NAD_1927_UTM_Zone_60N | 3371 | USA - 174°E to 180°E - AK, OCS | 47.92 | 174 | 56.67 | 180 |
| NAD_1927_UTM_Zone_6N | 26706 | USA - 150°W to 144°W - AK, OCS | 54.05 | -150 | 74.13 | -143.99 |
| NAD_1927_UTM_Zone_7N | 26707 | North America - 144°W to 138°W and NAD27 by country | 53.47 | -144 | 73.59 | -138 |
| NAD_1927_UTM_Zone_8N | 26708 | North America - 138°W to 132°W and NAD27 by country - onshore | 52.58 | -138 | 73.04 | -132 |
| NAD_1927_UTM_Zone_9N | 26709 | North America - 132°W to 126°W and NAD27 by country - onshore | 49.18 | -132 | 72.03 | -126 |
| NAD_1927_Wisconsin_TM | 3069 | USA - Wisconsin | 42.48 | -92.89 | 47.31 | -86.25 |
| NAD_1983_10TM_AEP_Forest | 3400 | Canada - Alberta | 48.99 | -120 | 60 | -109.98 |
| NAD_1983_10TM_AEP_Resource | 3401 | Canada - Alberta | 48.99 | -120 | 60 | -109.98 |
| NAD_1983_2011_Alaska_Albers | 6393 | USA - Alaska | 51.3 | 172.42 | 71.4 | -129.99 |
| NAD_1983_2011_California_Teale_Albers | 6414 | USA - California | 32.53 | -124.45 | 42.01 | -114.12 |
| NAD_1983_2011_Contiguous_USA_ Albers | 6350 | USA - CONUS - onshore | 24.41 | -124.79 | 49.38 | -66.91 |
| NAD_1983_2011_EPSG_Arctic_zone_5-29 | 6351 | Arctic - 74°30'N to 69°30'N, 173°W to 153°W | 69.5 | -173 | 74.51 | -153 |
| NAD_1983_2011_EPSG_Arctic_zone_5-31 | 6352 | Arctic - 74°30'N to 69°30'N, 157°W to 137°W | 69.5 | -157 | 74.51 | -137 |
| NAD_1983_2011_EPSG_Arctic_zone_6-14 | 6353 | Arctic - 71°10'N to 66°10'N, 174°W to 156°W | 66.16 | -174 | 71.17 | -156 |
| NAD_1983_2011_EPSG_Arctic_zone_6-16 | 6354 | Arctic - 71°10'N to 66°10'N, 156°W to 138°W | 66.16 | -156 | 71.17 | -138 |
| NAD_1983_2011_Fargo_Ground_ Coordinate_System | 102391 | USA - North Dakota - Fargo | 46.7 | -96.93 | 47 | -96.75 |
| NAD_1983_2011_Florida_GDL_Albers | 6439 | USA - Florida | 24.41 | -87.63 | 31.01 | -79.97 |
| NAD_1983_(2011)_IaRCS_zone_1 | 7057 | USA - Iowa - Spencer | 42.9 | -96.6 | 43.51 | -93.97 |
| NAD_1983_(2011)_IaRCS_zone_10 | 7066 | USA - Iowa - Cedar Rapids | 41.42 | -92.31 | 42.3 | -90.89 |
| NAD_1983_(2011)_IaRCS_zone_11 | 7067 | USA - Iowa - Dubuque- Davenport | 41.44 | -91.14 | 42.68 | -90.14 |
| NAD_1983_(2011)_IaRCS_zone_12 | 7068 | USA - Iowa - Red Oak- Ottumwa | 40.57 | -95.39 | 41.17 | -92.17 |
| NAD_1983_(2011)_IaRCS_zone_13 | 7069 | USA - Iowa - Fairfield | 40.59 | -92.42 | 41.52 | -91.48 |
| NAD_1983_(2011)_IaRCS_zone_14 | 7070 | USA - Iowa - Burlington | 40.37 | -91.72 | 41.6 | -90.78 |
| NAD_1983_(2011)_IaRCS_zone_2 | 7058 | USA - Iowa - Mason City | 42.9 | -93.98 | 43.51 | -91.6 |
| NAD_1983_(2011)_IaRCS_zone_3 | 7059 | USA - Iowa - Elkader | 42.29 | -91.62 | 43.51 | -90.89 |
| NAD_1983_(2011)_IaRCS_zone_4 | 7060 | USA - Iowa - Sioux City- Iowa Falls | 42.2 | -96.65 | 42.92 | -93 |
| NAD_1983_(2011)_IaRCS_zone_5 | 7061 | USA - Iowa - Waterloo | 42.2 | -93.03 | 43.09 | -91.59 |
| NAD_1983_(2011)_IaRCS_zone_6 | 7062 | USA - Iowa - Council Bluffs | 40.58 | -96.37 | 42.22 | -95.04 |
| NAD_1983_(2011)_IaRCS_zone_7 | 7063 | USA - Iowa - Carroll- Atlantic | 41.15 | -95.16 | 42.22 | -94.16 |
| NAD_1983_(2011)_IaRCS_zone_8 | 7064 | USA - Iowa - Ames-Des Moines | 41.15 | -94.29 | 42.22 | -93.23 |
| NAD_1983_(2011)_IaRCS_zone_9 | 7065 | USA - Iowa - Newton | 41.16 | -93.35 | 42.3 | -92.29 |
| NAD_1983_(2011)_ICS_Aurora_ (US_Feet) | 102901 | Illinois - Aurora | 41.45 | -88.95 | 42.5 | -88.19 |
| NAD_1983_(2011)_ICS_Belleville_ (US_Feet) | 102929 | Illinois - Belleville | 38.08 | -90.38 | 39.01 | -89.59 |
| NAD_1983_(2011)_ICS_Bloomington_ (US_Feet) | 102914 | Illinois - Bloomington | 40.28 | -89.27 | 40.76 | -88.45 |
| NAD_1983_(2011)_ICS_Carbondale_ (US_Feet) | 102932 | Illinois - Carbondale | 37.56 | -90.21 | 38.26 | -87.91 |
| NAD_1983_(2011)_ICS_Carlinville_ (US_Feet) | 102925 | Illinois - Carlinville | 38.99 | -90.63 | 39.53 | -89.69 |
| NAD_1983_(2011)_ICS_Champaign_ (US_Feet) | 102916 | Illinois - Champaign | 39.86 | -88.47 | 40.5 | -87.52 |
| NAD_1983_(2011)_ICS_Charleston_ (US_Feet) | 102924 | Illinois - Charleston | 39.37 | -88.48 | 39.89 | -87.53 |
| NAD_1983_(2011)_ICS_Chicago_ (US_Feet) | 102903 | Illinois - Chicago | 41.46 | -88.27 | 42.5 | -87.52 |
| NAD_1983_(2011)_ICS_Decatur_ (US_Feet) | 102917 | Illinois - Decatur | 39.21 | -89.22 | 40.29 | -88.46 |
| NAD_1983_(2011)_ICS_Effingham_ (US_Feet) | 102928 | Illinois - Effingham | 38.73 | -89.64 | 39.22 | -88.36 |
| NAD_1983_(2011)_ICS_Eureka_ (US_Feet) | 102909 | Illinois - Eureka | 40.59 | -89.64 | 41.15 | -88.92 |
| NAD_1983_(2011)_ICS_Freeport_ (US_Feet) | 102902 | Illinois - Freeport | 41.92 | -90.66 | 42.51 | -89.39 |
| NAD_1983_(2011)_ICS_Galesburg_ (US_Feet) | 102915 | Illinois - Galesburg | 40.18 | -90.46 | 41.24 | -89.63 |
| NAD_1983_(2011)_ICS_Jacksonville_ (US_Feet) | 102922 | Illinois - Jacksonville | 39.39 | -91.38 | 39.88 | -89.92 |
| NAD_1983_(2011)_ICS_Jerseyville_ (US_Feet) | 102927 | Illinois - Jerseyville | 38.86 | -90.94 | 39.41 | -90.14 |
| NAD_1983_(2011)_ICS_Joliet_ (US_Feet) | 102908 | Illinois - Joliet | 40.99 | -88.27 | 41.73 | -87.52 |
| NAD_1983_(2011)_ICS_Lincoln_ (US_Feet) | 102919 | Illinois - Lincoln | 39.87 | -90.59 | 40.44 | -89.14 |
| NAD_1983_(2011)_ICS_Macomb_ (US_Feet) | 102920 | Illinois - Macomb | 39.83 | -90.92 | 40.64 | -90.18 |
| NAD_1983_(2011)_ICS_Metropolis_ (US_Feet) | 102933 | Illinois - Metropolis | 36.97 | -89.53 | 37.61 | -88.05 |
| NAD_1983_(2011)_ICS_Moline_ (US_Feet) | 102905 | Illinois - Moline | 41.32 | -91.08 | 41.79 | -90.15 |
| NAD_1983_(2011)_ICS_Monmouth_ (US_Feet) | 102911 | Illinois - Monmouth | 40.62 | -91.19 | 41.34 | -90.43 |
| NAD_1983_(2011)_ICS_Mount_ Vernon_(US_Feet) | 102931 | Illinois - Mount Vernon | 38.12 | -89.71 | 38.83 | -88.69 |
| NAD_1983_(2011)_ICS_Olney_ (US_Feet) | 102930 | Illinois - Olney | 38.23 | -88.71 | 38.92 | -87.49 |
| NAD_1983_(2011)_ICS_Ottawa_ (US_Feet) | 102906 | Illinois - Ottawa | 40.92 | -89.87 | 41.64 | -88.24 |
| NAD_1983_(2011)_ICS_Peoria_ (US_Feet) | 102913 | Illinois - Peoria | 40.31 | -90.01 | 40.98 | -89.26 |
| NAD_1983_(2011)_ICS_Pontiac_ (US_Feet) | 102910 | Illinois - Pontiac | 40.61 | -88.94 | 41.12 | -88.23 |
| NAD_1983_(2011)_ICS_Quincy_ (US_Feet) | 102918 | Illinois - Quincy | 39.75 | -91.52 | 40.64 | -90.9 |
| NAD_1983_(2011)_ICS_Robinson_ (US_Feet) | 102926 | Illinois - Robinson | 38.84 | -88.48 | 39.49 | -87.51 |
| NAD_1983_(2011)_ICS_Rockford_ (US_Feet) | 102904 | Illinois - Rockford | 41.58 | -89.69 | 42.51 | -88.93 |
| NAD_1983_(2011)_ICS_Springfield_ (US_Feet) | 102921 | Illinois - Springfield | 39.52 | -90.01 | 39.98 | -89.21 |
| NAD_1983_(2011)_ICS_Sterling_ (US_Feet) | 102907 | Illinois - Sterling | 41.14 | -90.44 | 41.94 | -89.62 |
| NAD_1983_(2011)_ICS_Taylorville_ (US_Feet) | 102923 | Illinois - Taylorville | 38.99 | -89.71 | 39.83 | -89.02 |
| NAD_1983_(2011)_ICS_Watseka_ (US_Feet) | 102912 | Illinois - Watseka | 40.39 | -88.47 | 41.02 | -87.52 |
| NAD_1983_2011_InGCS_Adams_(ftUS) | 7258 | USA - Indiana - Adams | 40.56 | -85.08 | 40.93 | -84.8 |
| NAD_1983_2011_InGCS_Adams_(m) | 7257 | USA - Indiana - Adams | 40.56 | -85.08 | 40.93 | -84.8 |
| NAD_1983_2011_InGCS_Allen_(ftUS) | 7260 | USA - Indiana - Allen | 40.91 | -85.34 | 41.28 | -84.8 |
| NAD_1983_2011_InGCS_Allen_(m) | 7259 | USA - Indiana - Allen | 40.91 | -85.34 | 41.28 | -84.8 |
| NAD_1983_2011_InGCS_Bartholomew_ (ftUS) | 7262 | USA - Indiana - Bartholomew | 39.03 | -86.09 | 39.36 | -85.68 |
| NAD_1983_2011_InGCS_Bartholomew_ (m) | 7261 | USA - Indiana - Bartholomew | 39.03 | -86.09 | 39.36 | -85.68 |
| NAD_1983_2011_InGCS_Benton_(ftUS) | 7264 | USA - Indiana - Benton | 40.47 | -87.53 | 40.74 | -87.09 |
| NAD_1983_2011_InGCS_Benton_(m) | 7263 | USA - Indiana - Benton | 40.47 | -87.53 | 40.74 | -87.09 |
| NAD_1983_2011_InGCS_Blackford- Delaware_(ftUS) | 7266 | USA - Indiana - Blackford and Delaware | 40.07 | -85.58 | 40.57 | -85.2 |
| NAD_1983_2011_InGCS_Blackford- Delaware_(m) | 7265 | USA - Indiana - Blackford and Delaware | 40.07 | -85.58 | 40.57 | -85.2 |
| NAD_1983_2011_InGCS_Boone- Hendricks_(ftUS) | 7268 | USA - Indiana - Boone and Hendricks | 39.6 | -86.7 | 40.19 | -86.24 |
| NAD_1983_2011_InGCS_Boone- Hendricks_(m) | 7267 | USA - Indiana - Boone and Hendricks | 39.6 | -86.7 | 40.19 | -86.24 |
| NAD_1983_2011_InGCS_Brown_(ftUS) | 7270 | USA - Indiana - Brown | 39.04 | -86.39 | 39.35 | -86.07 |
| NAD_1983_2011_InGCS_Brown_(m) | 7269 | USA - Indiana - Brown | 39.04 | -86.39 | 39.35 | -86.07 |
| NAD_1983_2011_InGCS_Carroll_(ftUS) | 7272 | USA - Indiana - Carroll | 40.43 | -86.78 | 40.74 | -86.37 |
| NAD_1983_2011_InGCS_Carroll_(m) | 7271 | USA - Indiana - Carroll | 40.43 | -86.78 | 40.74 | -86.37 |
| NAD_1983_2011_InGCS_Cass_(ftUS) | 7274 | USA - Indiana - Cass | 40.56 | -86.59 | 40.92 | -86.16 |
| NAD_1983_2011_InGCS_Cass_(m) | 7273 | USA - Indiana - Cass | 40.56 | -86.59 | 40.92 | -86.16 |
| NAD_1983_2011_InGCS_Clark-Floyd- Scott_(ftUS) | 7276 | USA - Indiana - Clark, Floyd, Scott | 38.17 | -86.04 | 38.84 | -85.41 |
| NAD_1983_2011_InGCS_Clark-Floyd- Scott_(m) | 7275 | USA - Indiana - Clark, Floyd, Scott | 38.17 | -86.04 | 38.84 | -85.41 |
| NAD_1983_2011_InGCS_Clay_(ftUS) | 7278 | USA - Indiana - Clay | 39.16 | -87.25 | 39.61 | -86.93 |
| NAD_1983_2011_InGCS_Clay_(m) | 7277 | USA - Indiana - Clay | 39.16 | -87.25 | 39.61 | -86.93 |
| NAD_1983_2011_InGCS_Clinton_(ftUS) | 7280 | USA - Indiana - Clinton | 40.17 | -86.7 | 40.44 | -86.24 |
| NAD_1983_2011_InGCS_Clinton_(m) | 7279 | USA - Indiana - Clinton | 40.17 | -86.7 | 40.44 | -86.24 |
| NAD_1983_2011_InGCS_Crawford- Lawrence-Orange_(ftUS) | 7282 | USA - Indiana - Crawford, Lawrence, Orange | 38.1 | -86.69 | 39 | -86.24 |
| NAD_1983_2011_InGCS_Crawford- Lawrence-Orange_(m) | 7281 | USA - Indiana - Crawford, Lawrence, Orange | 38.1 | -86.69 | 39 | -86.24 |
| NAD_1983_2011_InGCS_Daviess- Greene_(ftUS) | 7284 | USA - Indiana - Daviess and Greene | 38.49 | -87.28 | 39.18 | -86.68 |
| NAD_1983_2011_InGCS_Daviess- Greene_(m) | 7283 | USA - Indiana - Daviess and Greene | 38.49 | -87.28 | 39.18 | -86.68 |
| NAD_1983_2011_InGCS_Dearborn-Ohio- Switzerland_(ftUS) | 7286 | USA - Indiana - Dearborn, Ohio, Switzerland | 38.68 | -85.21 | 39.31 | -84.78 |
| NAD_1983_2011_InGCS_Dearborn-Ohio- Switzerland_(m) | 7285 | USA - Indiana - Dearborn, Ohio, Switzerland | 38.68 | -85.21 | 39.31 | -84.78 |
| NAD_1983_2011_InGCS_Decatur- Rush_(ftUS) | 7288 | USA - Indiana - Decatur and Rush | 39.13 | -85.69 | 39.79 | -85.29 |
| NAD_1983_2011_InGCS_Decatur- Rush_(m) | 7287 | USA - Indiana - Decatur and Rush | 39.13 | -85.69 | 39.79 | -85.29 |
| NAD_1983_2011_InGCS_DeKalb_(ftUS) | 7290 | USA - Indiana - DeKalb | 41.26 | -85.2 | 41.54 | -84.8 |
| NAD_1983_2011_InGCS_DeKalb_(m) | 7289 | USA - Indiana - DeKalb | 41.26 | -85.2 | 41.54 | -84.8 |
| NAD_1983_2011_InGCS_Dubois- Martin_(ftUS) | 7292 | USA - Indiana - Dubois and Martin | 38.2 | -87.08 | 38.91 | -86.67 |
| NAD_1983_2011_InGCS_Dubois- Martin_(m) | 7291 | USA - Indiana - Dubois and Martin | 38.2 | -87.08 | 38.91 | -86.67 |
| NAD_1983_2011_InGCS_Elkhart- Kosciusko-Wabash_(ftUS) | 7294 | USA - Indiana - Elkhart, Kosciusko, Wabash | 40.65 | -86.08 | 41.77 | -85.63 |
| NAD_1983_2011_InGCS_Elkhart- Kosciusko-Wabash_(m) | 7293 | USA - Indiana - Elkhart, Kosciusko, Wabash | 40.65 | -86.08 | 41.77 | -85.63 |
| NAD_1983_2011_InGCS_Fayette- Franklin-Union_(ftUS) | 7296 | USA - Indiana - Fayette, Franklin, Union | 39.26 | -85.31 | 39.79 | -84.81 |
| NAD_1983_2011_InGCS_Fayette- Franklin-Union_(m) | 7295 | USA - Indiana - Fayette, Franklin, Union | 39.26 | -85.31 | 39.79 | -84.81 |
| NAD_1983_2011_InGCS_Fountain- Warren_(ftUS) | 7298 | USA - Indiana - Fountain and Warren | 39.95 | -87.54 | 40.48 | -87.09 |
| NAD_1983_2011_InGCS_Fountain- Warren_(m) | 7297 | USA - Indiana - Fountain and Warren | 39.95 | -87.54 | 40.48 | -87.09 |
| NAD_1983_2011_InGCS_Fulton-Marshall- St_Joseph_(ftUS) | 7300 | USA - Indiana - Fulton, Marshall, St Joseph | 40.9 | -86.53 | 41.77 | -85.94 |
| NAD_1983_2011_InGCS_Fulton-Marshall- St_Joseph_(m) | 7299 | USA - Indiana - Fulton, Marshall, St Joseph | 40.9 | -86.53 | 41.77 | -85.94 |
| NAD_1983_2011_InGCS_Gibson_(ftUS) | 7302 | USA - Indiana - Gibson | 38.16 | -87.98 | 38.54 | -87.31 |
| NAD_1983_2011_InGCS_Gibson_(m) | 7301 | USA - Indiana - Gibson | 38.16 | -87.98 | 38.54 | -87.31 |
| NAD_1983_2011_InGCS_Grant_(ftUS) | 7304 | USA - Indiana - Grant | 40.37 | -85.87 | 40.66 | -85.44 |
| NAD_1983_2011_InGCS_Grant_(m) | 7303 | USA - Indiana - Grant | 40.37 | -85.87 | 40.66 | -85.44 |
| NAD_1983_2011_InGCS_Hamilton- Tipton_(ftUS) | 7306 | USA - Indiana - Hamilton and Tipton | 39.92 | -86.25 | 40.41 | -85.86 |
| NAD_1983_2011_InGCS_Hamilton- Tipton_(m) | 7305 | USA - Indiana - Hamilton and Tipton | 39.92 | -86.25 | 40.41 | -85.86 |
| NAD_1983_2011_InGCS_Hancock- Madison_(ftUS) | 7308 | USA - Indiana - Hancock and Madison | 39.69 | -85.96 | 40.38 | -85.57 |
| NAD_1983_2011_InGCS_Hancock- Madison_(m) | 7307 | USA - Indiana - Hancock and Madison | 39.69 | -85.96 | 40.38 | -85.57 |
| NAD_1983_2011_InGCS_Harrison- Washington_(ftUS) | 7310 | USA - Indiana - Harrison and Washington | 37.95 | -86.33 | 38.79 | -85.84 |
| NAD_1983_2011_InGCS_Harrison- Washington_(m) | 7309 | USA - Indiana - Harrison and Washington | 37.95 | -86.33 | 38.79 | -85.84 |
| NAD_1983_2011_InGCS_Henry_(ftUS) | 7312 | USA - Indiana - Henry | 39.78 | -85.6 | 40.08 | -85.2 |
| NAD_1983_2011_InGCS_Henry_(m) | 7311 | USA - Indiana - Henry | 39.78 | -85.6 | 40.08 | -85.2 |
| NAD_1983_2011_InGCS_Howard- Miami_(ftUS) | 7314 | USA - Indiana - Howard and Miami | 40.37 | -86.38 | 41 | -85.86 |
| NAD_1983_2011_InGCS_Howard- Miami_(m) | 7313 | USA - Indiana - Howard and Miami | 40.37 | -86.38 | 41 | -85.86 |
| NAD_1983_2011_InGCS_Huntington- Whitley_(ftUS) | 7316 | USA - Indiana - Huntington and Whitley | 40.65 | -85.69 | 41.3 | -85.3 |
| NAD_1983_2011_InGCS_Huntington- Whitley_(m) | 7315 | USA - Indiana - Huntington and Whitley | 40.65 | -85.69 | 41.3 | -85.3 |
| NAD_1983_2011_InGCS_Jackson_(ftUS) | 7318 | USA - Indiana - Jackson | 38.72 | -86.32 | 39.08 | -85.79 |
| NAD_1983_2011_InGCS_Jackson_(m) | 7317 | USA - Indiana - Jackson | 38.72 | -86.32 | 39.08 | -85.79 |
| NAD_1983_2011_InGCS_Jasper- Porter_(ftUS) | 7320 | USA - Indiana - Jasper and Porter | 40.73 | -87.28 | 41.77 | -86.92 |
| NAD_1983_2011_InGCS_Jasper- Porter_(m) | 7319 | USA - Indiana - Jasper and Porter | 40.73 | -87.28 | 41.77 | -86.92 |
| NAD_1983_2011_InGCS_Jay_(ftUS) | 7322 | USA - Indiana - Jay | 40.3 | -85.22 | 40.58 | -84.8 |
| NAD_1983_2011_InGCS_Jay_(m) | 7321 | USA - Indiana - Jay | 40.3 | -85.22 | 40.58 | -84.8 |
| NAD_1983_2011_InGCS_Jefferson_(ftUS) | 7324 | USA - Indiana - Jefferson | 38.58 | -85.69 | 38.92 | -85.2 |
| NAD_1983_2011_InGCS_Jefferson_(m) | 7323 | USA - Indiana - Jefferson | 38.58 | -85.69 | 38.92 | -85.2 |
| NAD_1983_2011_InGCS_Jennings_(ftUS) | 7326 | USA - Indiana - Jennings | 38.8 | -85.8 | 39.2 | -85.43 |
| NAD_1983_2011_InGCS_Jennings_(m) | 7325 | USA - Indiana - Jennings | 38.8 | -85.8 | 39.2 | -85.43 |
| NAD_1983_2011_InGCS_Johnson- Marion_(ftUS) | 7328 | USA - Indiana - Johnson and Marion | 39.34 | -86.33 | 39.93 | -85.93 |
| NAD_1983_2011_InGCS_Johnson- Marion_(m) | 7327 | USA - Indiana - Johnson and Marion | 39.34 | -86.33 | 39.93 | -85.93 |
| NAD_1983_2011_InGCS_Knox_(ftUS) | 7330 | USA - Indiana - Knox | 38.41 | -87.75 | 38.91 | -87.09 |
| NAD_1983_2011_InGCS_Knox_(m) | 7329 | USA - Indiana - Knox | 38.41 | -87.75 | 38.91 | -87.09 |
| NAD_1983_2011_InGCS_LaGrange- Noble_(ftUS) | 7332 | USA - Indiana - LaGrange and Noble | 41.26 | -85.66 | 41.77 | -85.19 |
| NAD_1983_2011_InGCS_LaGrange- Noble_(m) | 7331 | USA - Indiana - LaGrange and Noble | 41.26 | -85.66 | 41.77 | -85.19 |
| NAD_1983_2011_InGCS_Lake- Newton_(ftUS) | 7334 | USA - Indiana - Lake and Newton | 40.73 | -87.53 | 41.77 | -87.21 |
| NAD_1983_2011_InGCS_Lake- Newton_(m) | 7333 | USA - Indiana - Lake and Newton | 40.73 | -87.53 | 41.77 | -87.21 |
| NAD_1983_2011_InGCS_LaPorte-Pulaski- Starke_(ftUS) | 7336 | USA - Indiana - LaPorte, Pulaski, Starke | 40.9 | -86.94 | 41.77 | -86.46 |
| NAD_1983_2011_InGCS_LaPorte-Pulaski- Starke_(m) | 7335 | USA - Indiana - LaPorte, Pulaski, Starke | 40.9 | -86.94 | 41.77 | -86.46 |
| NAD_1983_2011_InGCS_Monroe- Morgan_(ftUS) | 7338 | USA - Indiana - Monroe and Morgan | 38.99 | -86.69 | 39.64 | -86.24 |
| NAD_1983_2011_InGCS_Monroe- Morgan_(m) | 7337 | USA - Indiana - Monroe and Morgan | 38.99 | -86.69 | 39.64 | -86.24 |
| NAD_1983_2011_InGCS_Montgomery- Putnam_(ftUS) | 7340 | USA - Indiana - Montgomery and Putnam | 39.47 | -87.1 | 40.22 | -86.64 |
| NAD_1983_2011_InGCS_Montgomery- Putnam_(m) | 7339 | USA - Indiana - Montgomery and Putnam | 39.47 | -87.1 | 40.22 | -86.64 |
| NAD_1983_2011_InGCS_Owen_(ftUS) | 7342 | USA - Indiana - Owen | 39.16 | -87.06 | 39.48 | -86.63 |
| NAD_1983_2011_InGCS_Owen_(m) | 7341 | USA - Indiana - Owen | 39.16 | -87.06 | 39.48 | -86.63 |
| NAD_1983_2011_InGCS_Parke- Vermillion_(ftUS) | 7344 | USA - Indiana - Parke and Vermillion | 39.6 | -87.54 | 40.15 | -87 |
| NAD_1983_2011_InGCS_Parke- Vermillion_(m) | 7343 | USA - Indiana - Parke and Vermillion | 39.6 | -87.54 | 40.15 | -87 |
| NAD_1983_2011_InGCS_Perry_(ftUS) | 7346 | USA - Indiana - Perry | 37.84 | -86.82 | 38.27 | -86.43 |
| NAD_1983_2011_InGCS_Perry_(m) | 7345 | USA - Indiana - Perry | 37.84 | -86.82 | 38.27 | -86.43 |
| NAD_1983_2011_InGCS_Pike- Warrick_(ftUS) | 7348 | USA - Indiana - Pike and Warrick | 37.87 | -87.48 | 38.56 | -87.01 |
| NAD_1983_2011_InGCS_Pike- Warrick_(m) | 7347 | USA - Indiana - Pike and Warrick | 37.87 | -87.48 | 38.56 | -87.01 |
| NAD_1983_2011_InGCS_Posey_(ftUS) | 7350 | USA - Indiana - Posey | 37.77 | -88.06 | 38.24 | -87.68 |
| NAD_1983_2011_InGCS_Posey_(m) | 7349 | USA - Indiana - Posey | 37.77 | -88.06 | 38.24 | -87.68 |
| NAD_1983_2011_InGCS_Randolph- Wayne_(ftUS) | 7352 | USA - Indiana - Randolph and Wayne | 39.71 | -85.23 | 40.32 | -84.8 |
| NAD_1983_2011_InGCS_Randolph- Wayne_(m) | 7351 | USA - Indiana - Randolph and Wayne | 39.71 | -85.23 | 40.32 | -84.8 |
| NAD_1983_2011_InGCS_Ripley_(ftUS) | 7354 | USA - Indiana - Ripley | 38.91 | -85.45 | 39.32 | -85.06 |
| NAD_1983_2011_InGCS_Ripley_(m) | 7353 | USA - Indiana - Ripley | 38.91 | -85.45 | 39.32 | -85.06 |
| NAD_1983_2011_InGCS_Shelby_(ftUS) | 7356 | USA - Indiana - Shelby | 39.34 | -85.96 | 39.7 | -85.62 |
| NAD_1983_2011_InGCS_Shelby_(m) | 7355 | USA - Indiana - Shelby | 39.34 | -85.96 | 39.7 | -85.62 |
| NAD_1983_2011_InGCS_Spencer_(ftUS) | 7358 | USA - Indiana - Spencer | 37.78 | -87.27 | 38.21 | -86.76 |
| NAD_1983_2011_InGCS_Spencer_(m) | 7357 | USA - Indiana - Spencer | 37.78 | -87.27 | 38.21 | -86.76 |
| NAD_1983_2011_InGCS_Steuben_(ftUS) | 7360 | USA - Indiana - Steuben | 41.52 | -85.2 | 41.77 | -84.8 |
| NAD_1983_2011_InGCS_Steuben_(m) | 7359 | USA - Indiana - Steuben | 41.52 | -85.2 | 41.77 | -84.8 |
| NAD_1983_2011_InGCS_Sullivan_(ftUS) | 7362 | USA - Indiana - Sullivan | 38.9 | -87.65 | 39.26 | -87.24 |
| NAD_1983_2011_InGCS_Sullivan_(m) | 7361 | USA - Indiana - Sullivan | 38.9 | -87.65 | 39.26 | -87.24 |
| NAD_1983_2011_InGCS_Tippecanoe- White_(ftUS) | 7364 | USA - Indiana - Tippecanoe and White | 40.21 | -87.1 | 40.92 | -86.58 |
| NAD_1983_2011_InGCS_Tippecanoe- White_(m) | 7363 | USA - Indiana - Tippecanoe and White | 40.21 | -87.1 | 40.92 | -86.58 |
| NAD_1983_2011_InGCS_Vanderburgh_ (ftUS) | 7366 | USA - Indiana - Vanderburgh | 37.82 | -87.71 | 38.17 | -87.44 |
| NAD_1983_2011_InGCS_Vanderburgh_ (m) | 7365 | USA - Indiana - Vanderburgh | 37.82 | -87.71 | 38.17 | -87.44 |
| NAD_1983_2011_InGCS_Vigo_(ftUS) | 7368 | USA - Indiana - Vigo | 39.25 | -87.62 | 39.61 | -87.19 |
| NAD_1983_2011_InGCS_Vigo_(m) | 7367 | USA - Indiana - Vigo | 39.25 | -87.62 | 39.61 | -87.19 |
| NAD_1983_2011_InGCS_Wells_(ftUS) | 7370 | USA - Indiana - Wells | 40.56 | -85.45 | 40.92 | -85.06 |
| NAD_1983_2011_InGCS_Wells_(m) | 7369 | USA - Indiana - Wells | 40.56 | -85.45 | 40.92 | -85.06 |
| NAD_1983_2011_Kansas_LCC | 6924 | USA - Kansas | 36.99 | -102.06 | 40.01 | -94.58 |
| NAD_1983_2011_Kansas_LCC_ftUS | 6925 | USA - Kansas | 36.98 | -102.06 | 40.01 | -94.58 |
| NAD_1983_2011_KS_RCS_Zone_1 | 8518 | USA - Kansas - Goodland | 38.69 | -102.06 | 40.01 | -101.38 |
| NAD_1983_2011_KS_RCS_Zone_2 | 8519 | USA - Kansas - Colby | 38.69 | -101.49 | 40.01 | -100.71 |
| NAD_1983_2011_KS_RCS_Zone_3 | 8520 | USA - Kansas - Oberlin | 38.69 | -100.82 | 40.01 | -100.14 |
| NAD_1983_2011_KS_RCS_Zone_4 | 8521 | USA - Kansas - Hays | 38.69 | -100.19 | 40.01 | -99.03 |
| NAD_1983_2011_KS_RCS_Zone_5 | 8522 | USA - Kansas - Great Bend | 38.26 | -99.07 | 40.01 | -98.47 |
| NAD_1983_2011_KS_RCS_Zone_6 | 8523 | USA - Kansas - Beloit | 38.15 | -98.51 | 40.01 | -97.92 |
| NAD_1983_2011_KS_RCS_Zone_7 | 8524 | USA - Kansas - Salina | 38.08 | -97.94 | 40.01 | -96.8 |
| NAD_1983_2011_KS_RCS_Zone_8 | 8525 | USA - Kansas - Manhattan | 38.73 | -96.97 | 39.57 | -95.94 |
| NAD_1983_2011_KS_RCS_Zone_9 | 8526 | USA - Kansas - Emporia | 38.08 | -96.94 | 38.88 | -95.94 |
| NAD_1983_2011_KS_RCS_Zone_10 | 8527 | USA - Kansas - Atchison | 39.21 | -96.81 | 40.01 | -94.85 |
| NAD_1983_2011_KS_RCS_Zone_11 | 8528 | USA - Kansas - Kansas City | 38.73 | -96.04 | 39.43 | -94.58 |
| NAD_1983_2011_KS_RCS_Zone_12 | 8529 | USA - Kansas - Ulysses | 36.99 | -102.05 | 38.71 | -101.06 |
| NAD_1983_2011_KS_RCS_Zone_13 | 8531 | USA - Kansas - Garden City | 36.99 | -101.13 | 38.71 | -100.08 |
| NAD_1983_2011_KS_RCS_Zone_14 | 8533 | USA - Kansas - Dodge City | 36.99 | -100.25 | 38.7 | -99.54 |
| NAD_1983_2011_KS_RCS_Zone_15 | 8534 | USA - Kansas - Larned | 36.99 | -99.59 | 38.7 | -98.91 |
| NAD_1983_2011_KS_RCS_Zone_16 | 8535 | USA - Kansas - Pratt | 36.99 | -99.03 | 38.27 | -98.34 |
| NAD_1983_2011_KS_RCS_Zone_17 | 8536 | USA - Kansas - Wichita | 37.38 | -98.48 | 38.18 | -96.52 |
| NAD_1983_2011_KS_RCS_Zone_18 | 8538 | USA - Kansas - Arkansas City | 36.99 | -98.35 | 37.48 | -96.52 |
| NAD_1983_2011_KS_RCS_Zone_19 | 8539 | USA - Kansas - Coffeyville | 36.99 | -96.53 | 38.88 | -95.5 |
| NAD_1983_2011_KS_RCS_Zone_20 | 8540 | USA - Kansas - Pittsburg | 36.99 | -95.53 | 38.74 | -94.6 |
| NAD_1983_2011_Maine_2000_Central_ Zone | 6480 | USA - Maine - CS2000 - C | 43.75 | -70.03 | 47.47 | -68.33 |
| NAD_1983_2011_Maine_2000_East_ Zone | 6481 | USA - Maine - CS2000 - E | 44.18 | -68.58 | 47.37 | -66.91 |
| NAD_1983_2011_Maine_2000_West_ Zone | 6482 | USA - Maine - CS2000 - W | 43.07 | -71.09 | 46.58 | -69.61 |
| NAD_1983_2011_Michigan_GeoRef_ Meters | 6497 | USA - Michigan | 41.69 | -90.42 | 48.32 | -82.13 |
| NAD_1983_2011_Mississippi_TM | 6508 | USA - Mississippi | 30.01 | -91.65 | 35.01 | -88.09 |
| NAD_1983_(2011)_Navajo_Nation_ Coordinate_System_Meters | 103592 | Navajo Nation | 32.8 | -114.04 | 37.75 | -106.17 |
| NAD_1983_(2011)_Navajo_Nation_ Coordinate_System_US_Feet | 103593 | Navajo Nation | 32.8 | -114.04 | 37.75 | -106.17 |
| NAD_1983_(2011)_Navajo_Nation_ Coordinate_System_Intl_Feet | 103594 | Navajo Nation | 32.8 | -114.04 | 37.75 | -106.17 |
| NAD_1983_(2011)_NCRS_Las_Vegas_ (ftUS) | 8384 | USA - Nevada - Las Vegas | 35.89 | -115.5 | 36.43 | -114.72 |
| NAD_1983_(2011)_NCRS_Las_Vegas_high (ftUS) | 8387 | USA - Nevada - Las Vegas - high elevation | 35.89 | -115.5 | 36.43 | -114.72 |
| NAD_1983_(2011)_NCRS_Las_Vegas_high _(m) | 8385 | USA - Nevada - Las Vegas - high elevation | 35.89 | -115.5 | 36.43 | -114.72 |
| NAD_1983_(2011)_NCRS_Las_Vegas_(m) | 8383 | USA - Nevada - Las Vegas | 35.89 | -115.5 | 36.43 | -114.72 |
| NAD_1983_2011_Oregon_Statewide_ Lambert | 6556 | USA - Oregon | 41.98 | -124.6 | 46.26 | -116.47 |
| NAD_1983_2011_Oregon_Statewide_ Lambert_Ft_Intl | 6557 | USA - Oregon | 41.98 | -124.6 | 46.26 | -116.47 |
| NAD_1983_(2011)_PCCS_zone_1_(ft) | 8065 | USA - Arizona - Pima county east | 31.43 | -111.57 | 32.52 | -110.44 |
| NAD_1983_(2011)_PCCS_zone_2_(ft) | 8066 | USA - Arizona - Pima county central | 31.5 | -112.52 | 32.51 | -111.56 |
| NAD_1983_(2011)_PCCS_zone_3_(ft) | 8067 | USA - Arizona - Pima county west | 31.8 | -113.33 | 32.51 | -112.51 |
| NAD_1983_(2011)_PCCS_zone_4_(ft) | 8068 | USA - Arizona - Pima county Mt. Lemmon | 32.33 | -110.87 | 32.49 | -110.61 |
| NAD_1983_2011_RMTCRS_Billings_Ft_ Intl | 7127 | USA - Montana - Billings | 44.99 | -109.42 | 47.41 | -107.99 |
| NAD_1983_2011_RMTCRS_Billings_ Meters | 7117 | USA - Montana - Billings | 44.99 | -109.42 | 47.41 | -107.99 |
| NAD_1983_2011_RMTCRS_Blackfeet_Ft_ Intl | 7120 | USA - Montana - Blackfeet reservation | 48 | -113.84 | 49.01 | -112 |
| NAD_1983_2011_RMTCRS_Blackfeet_ Meters | 7110 | USA - Montana - Blackfeet reservation | 48 | -113.84 | 49.01 | -112 |
| NAD_1983_2011_RMTCRS_Bobcat_Ft_ Intl | 7126 | USA - Montana - Three Forks | 45.36 | -112.34 | 46.59 | -110.75 |
| NAD_1983_2011_RMTCRS_Bobcat_ Meters | 7116 | USA - Montana - Three Forks | 45.36 | -112.34 | 46.59 | -110.75 |
| NAD_1983_2011_RMTCRS_Crow_Ft_Intl | 7125 | USA - Montana - Crow reservation | 44.99 | -108.84 | 46.09 | -106.66 |
| NAD_1983_2011_RMTCRS_Crow_Meters | 7115 | USA - Montana - Crow reservation | 44.99 | -108.84 | 46.09 | -106.66 |
| NAD_1983_2011_RMTCRS_Fort_Belknap _Ft_Intl | 7122 | USA - Montana - Fort Belknap | 47.78 | -110.84 | 49.01 | -106.99 |
| NAD_1983_2011_RMTCRS_Fort_Belknap _Meters | 7112 | USA - Montana - Fort Belknap | 47.78 | -110.84 | 49.01 | -106.99 |
| NAD_1983_2011_RMTCRS_Fort_Peck_ Assiniboine_Ft_Intl | 7123 | USA - Montana - Fort Peck higher areas | 48.01 | -107.57 | 48.88 | -104.78 |
| NAD_1983_2011_RMTCRS_Fort_Peck_ Assiniboine_Meters | 7113 | USA - Montana - Fort Peck higher areas | 48.01 | -107.57 | 48.88 | -104.78 |
| NAD_1983_2011_RMTCRS_Fort_Peck_ Sioux_Ft_Intl | 7124 | USA - Montana - Fort Peck lower areas | 47.75 | -107.76 | 49.01 | -104.04 |
| NAD_1983_2011_RMTCRS_Fort_Peck_ Sioux_Meters | 7114 | USA - Montana - Fort Peck lower areas | 47.75 | -107.76 | 49.01 | -104.04 |
| NAD_1983_2011_RMTCRS_Milk_River_Ft _Intl | 7121 | USA - Montana - Milk River | 47.78 | -112.5 | 49.01 | -108.74 |
| NAD_1983_2011_RMTCRS_Milk_River_ Meters | 7111 | USA - Montana - Milk River | 47.78 | -112.5 | 49.01 | -108.74 |
| NAD_1983_2011_RMTCRS_St_Mary_Ft_ Intl | 7119 | USA - Montana - St Mary valley | 48.55 | -113.97 | 49.01 | -113 |
| NAD_1983_2011_RMTCRS_St_Mary_ Meters | 7109 | USA - Montana - St Mary valley | 48.55 | -113.97 | 49.01 | -113 |
| NAD_1983_2011_RMTCRS_Wind_River_ (ftUS) | 7128 | USA - Wyoming - Wind River reservation | 42.69 | -109.5 | 43.86 | -107.94 |
| NAD_1983_2011_RMTCRS_Wind_River_ Meters | 7118 | USA - Wyoming - Wind River reservation | 42.69 | -109.5 | 43.86 | -107.94 |
| NAD_1983_2011_San_Francisco_CS13_ ftUS | 7132 | USA - California - San Francisco Bay Area | 36.85 | -123.56 | 38.87 | -121.2 |
| NAD_1983_2011_San_Francisco_CS13_ Meters | 7131 | USA - California - San Francisco Bay Area | 36.85 | -123.56 | 38.87 | -121.2 |
| Name | WKID | Area of Use | Minimum Latitude | Minimum Longitude | Maximum Latitude | Maximum Longitude |
|---|---|---|---|---|---|---|
| NAD_1983_2011_StatePlane_Alabama_ East_FIPS_0101 | 6355 | USA - Alabama - SPCS - E | 30.99 | -86.79 | 35 | -84.89 |
| NAD_1983_2011_StatePlane_Alabama_ West_FIPS_0102 | 6356 | USA - Alabama - SPCS - W | 30.14 | -88.48 | 35.02 | -86.3 |
| NAD_1983_2011_StatePlane_Alabama_ East_(ftUS) | 9748 | USA - Alabama - SPCS - E | 30.99 | -86.79 | 35 | -84.89 |
| NAD_1983_2011_StatePlane_Alabama_ West_(ftUS) | 9749 | USA - Alabama - SPCS - W | 30.14 | -88.48 | 35.02 | -86.3 |
| NAD_1983_2011_StatePlane_Alaska_10_ FIPS_5010 | 6403 | USA - Alaska - Aleutian Islands | 51.3 | 172.42 | 54.34 | -164.84 |
| NAD_1983_2011_StatePlane_Alaska_10_ FIPS_5010_Feet | 102398 | USA - Alaska - Aleutian Islands | 51.3 | 172.42 | 54.34 | -164.84 |
| NAD_1983_2011_StatePlane_Alaska_1_ FIPS_5001 | 6394 | USA - Alaska - Panhandle | 54.61 | -141 | 60.35 | -129.99 |
| NAD_1983_2011_StatePlane_Alaska_1_ FIPS_5001_Feet | 102445 | USA - Alaska - Panhandle | 54.61 | -141 | 60.35 | -129.99 |
| NAD_1983_2011_StatePlane_Alaska_2_ FIPS_5002 | 6395 | USA - Alaska - 144°W to 141°W | 59.72 | -144.01 | 70.16 | -140.98 |
| NAD_1983_2011_StatePlane_Alaska_2_ FIPS_5002_Feet | 102446 | USA - Alaska - 144°W to 141°W | 59.72 | -144.01 | 70.16 | -140.98 |
| NAD_1983_2011_StatePlane_Alaska_3_ FIPS_5003 | 6396 | USA - Alaska - 148°W to 144°W | 59.72 | -148 | 70.38 | -144 |
| NAD_1983_2011_StatePlane_Alaska_3_ FIPS_5003_Feet | 102447 | USA - Alaska - 148°W to 144°W | 59.72 | -148 | 70.38 | -144 |
| NAD_1983_2011_StatePlane_Alaska_4_ FIPS_5004 | 6397 | USA - Alaska - 152°W to 148°W | 59.11 | -152.01 | 70.63 | -147.99 |
| NAD_1983_2011_StatePlane_Alaska_4_ FIPS_5004_Feet | 102392 | USA - Alaska - 152°W to 148°W | 59.11 | -152.01 | 70.63 | -147.99 |
| NAD_1983_2011_StatePlane_Alaska_5_ FIPS_5005 | 6398 | USA - Alaska - 156°W to 152°W | 55.72 | -156 | 71.28 | -151.86 |
| NAD_1983_2011_StatePlane_Alaska_5_ FIPS_5005_Feet | 102393 | USA - Alaska - 156°W to 152°W | 55.72 | -156 | 71.28 | -151.86 |
| NAD_1983_2011_StatePlane_Alaska_6_ FIPS_5006 | 6399 | USA - Alaska - 160°W to 156°W | 54.89 | -160 | 71.4 | -155.99 |
| NAD_1983_2011_StatePlane_Alaska_6_ FIPS_5006_Feet | 102394 | USA - Alaska - 160°W to 156°W | 54.89 | -160 | 71.4 | -155.99 |
| NAD_1983_2011_StatePlane_Alaska_7_ FIPS_5007 | 6400 | USA - Alaska - 164°W to 160°W | 54.32 | -164.01 | 70.74 | -160 |
| NAD_1983_2011_StatePlane_Alaska_7_ FIPS_5007_Feet | 102395 | USA - Alaska - 164°W to 160°W | 54.32 | -164.01 | 70.74 | -160 |
| NAD_1983_2011_StatePlane_Alaska_8_ FIPS_5008 | 6401 | USA - Alaska - north of 54.5°N; 168°W to 164°W | 54.34 | -168.26 | 69.05 | -164 |
| NAD_1983_2011_StatePlane_Alaska_8_ FIPS_5008_Feet | 102396 | USA - Alaska - north of 54.5°N; 168°W to 164°W | 54.34 | -168.26 | 69.05 | -164 |
| NAD_1983_2011_StatePlane_Alaska_9_ FIPS_5009 | 6402 | USA - Alaska - north of 54.5°N; west of 168°W | 56.49 | -173.16 | 65.82 | -168 |
| NAD_1983_2011_StatePlane_Alaska_9_ FIPS_5009_Feet | 102397 | USA - Alaska - north of 54.5°N; west of 168°W | 56.49 | -173.16 | 65.82 | -168 |
| NAD_1983_2011_StatePlane_Arizona_ Central_FIPS_0202 | 6404 | USA - Arizona - SPCS - C | 31.33 | -113.35 | 37.01 | -110.44 |
| NAD_1983_2011_StatePlane_Arizona_ Central_FIPS_0202_Ft_Intl | 6405 | USA - Arizona - SPCS - C | 31.33 | -113.35 | 37.01 | -110.44 |
| NAD_1983_2011_StatePlane_Arizona_ East_FIPS_0201 | 6406 | USA - Arizona - SPCS - E | 31.33 | -111.71 | 37.01 | -109.04 |
| NAD_1983_2011_StatePlane_Arizona_ East_FIPS_0201_Ft_Intl | 6407 | USA - Arizona - SPCS - E | 31.33 | -111.71 | 37.01 | -109.04 |
| NAD_1983_2011_StatePlane_Arizona_ West_FIPS_0203 | 6408 | USA - Arizona - SPCS - W | 32.05 | -114.81 | 37 | -112.52 |
| NAD_1983_2011_StatePlane_Arizona_ West_FIPS_0203_Ft_Intl | 6409 | USA - Arizona - SPCS - W | 32.05 | -114.81 | 37 | -112.52 |
| NAD_1983_2011_StatePlane_Arkansas_ North_FIPS_0301 | 6410 | USA - Arkansas - SPCS - N | 34.67 | -94.62 | 36.5 | -89.64 |
| NAD_1983_2011_StatePlane_Arkansas_ North_FIPS_0301_Ft_US | 6411 | USA - Arkansas - SPCS - N | 34.67 | -94.62 | 36.5 | -89.64 |
| NAD_1983_2011_StatePlane_Arkansas_ South_FIPS_0302 | 6412 | USA - Arkansas - SPCS - S | 33.01 | -94.48 | 35.1 | -90.4 |
| NAD_1983_2011_StatePlane_Arkansas_ South_FIPS_0302_Ft_US | 6413 | USA - Arkansas - SPCS - S | 33.01 | -94.48 | 35.1 | -90.4 |
| NAD_1983_2011_StatePlane_California_ I_FIPS_0401 | 6415 | USA - California - SPCS - 1 | 39.59 | -124.45 | 42.01 | -119.99 |
| NAD_1983_2011_StatePlane_California_ I_FIPS_0401_Ft_US | 6416 | USA - California - SPCS - 1 | 39.59 | -124.45 | 42.01 | -119.99 |
| NAD_1983_2011_StatePlane_California_II _FIPS_0402 | 6417 | USA - California - SPCS - 2 | 38.02 | -124.06 | 40.16 | -119.54 |
| NAD_1983_2011_StatePlane_California_II _FIPS_0402_Ft_US | 6418 | USA - California - SPCS - 2 | 38.02 | -124.06 | 40.16 | -119.54 |
| NAD_1983_2011_StatePlane_California_ III_FIPS_0403 | 6419 | USA - California - SPCS - 3 | 36.73 | -123.02 | 38.71 | -117.83 |
| NAD_1983_2011_StatePlane_California_ III_FIPS_0403_Ft_US | 6420 | USA - California - SPCS - 3 | 36.73 | -123.02 | 38.71 | -117.83 |
| NAD_1983_2011_StatePlane_California_ IV_FIPS_0404 | 6421 | USA - California - SPCS - 4 | 35.78 | -122.01 | 37.58 | -115.62 |
| NAD_1983_2011_StatePlane_California_ IV_FIPS_0404_Ft_US | 6422 | USA - California - SPCS - 4 | 35.78 | -122.01 | 37.58 | -115.62 |
| NAD_1983_2011_StatePlane_California_ V_FIPS_0405 | 6423 | USA - California - SPCS83 - 5 | 32.76 | -121.42 | 35.81 | -114.12 |
| NAD_1983_2011_StatePlane_California_ V_FIPS_0405_Ft_US | 6424 | USA - California - SPCS83 - 5 | 32.76 | -121.42 | 35.81 | -114.12 |
| NAD_1983_2011_StatePlane_California_ VI_FIPS_0406 | 6425 | USA - California - SPCS - 6 | 32.53 | -118.15 | 34.08 | -114.42 |
| NAD_1983_2011_StatePlane_California_ VI_FIPS_0406_Ft_US | 6426 | USA - California - SPCS - 6 | 32.53 | -118.15 | 34.08 | -114.42 |
| NAD_1983_2011_StatePlane_Colorado_ Central_FIPS_0502 | 6427 | USA - Colorado - SPCS - C | 38.14 | -109.06 | 40.09 | -102.04 |
| NAD_1983_2011_StatePlane_Colorado_ Central_FIPS_0502_Ft_US | 6428 | USA - Colorado - SPCS - C | 38.14 | -109.06 | 40.09 | -102.04 |
| NAD_1983_2011_StatePlane_Colorado_ North_FIPS_0501 | 6429 | USA - Colorado - SPCS - N | 39.56 | -109.06 | 41.01 | -102.04 |
| NAD_1983_2011_StatePlane_Colorado_ North_FIPS_0501_Ft_US | 6430 | USA - Colorado - SPCS - N | 39.56 | -109.06 | 41.01 | -102.04 |
| NAD_1983_2011_StatePlane_Colorado_ South_FIPS_0503 | 6431 | USA - Colorado - SPCS - S | 36.98 | -109.06 | 38.68 | -102.04 |
| NAD_1983_2011_StatePlane_Colorado_ South_FIPS_0503_Ft_US | 6432 | USA - Colorado - SPCS - S | 36.98 | -109.06 | 38.68 | -102.04 |
| NAD_1983_2011_StatePlane_Connecticut _FIPS_0600 | 6433 | USA - Connecticut | 40.98 | -73.73 | 42.05 | -71.78 |
| NAD_1983_2011_StatePlane_Connecticut _FIPS_0600_Ft_US | 6434 | USA - Connecticut | 40.98 | -73.73 | 42.05 | -71.78 |
| NAD_1983_2011_StatePlane_Delaware_ FIPS_0700 | 6435 | USA - Delaware | 38.44 | -75.8 | 39.85 | -74.97 |
| NAD_1983_2011_StatePlane_Delaware_ FIPS_0700_Ft_US | 6436 | USA - Delaware | 38.44 | -75.8 | 39.85 | -74.97 |
| NAD_1983_2011_StatePlane_Florida_ East_FIPS_0901 | 6437 | USA - Florida - SPCS - E | 24.41 | -82.33 | 30.83 | -79.97 |
| NAD_1983_2011_StatePlane_Florida_ East_FIPS_0901_Ft_US | 6438 | USA - Florida - SPCS - E | 24.41 | -82.33 | 30.83 | -79.97 |
| NAD_1983_2011_StatePlane_Florida_ North_FIPS_0903 | 6440 | USA - Florida - SPCS - N | 29.21 | -87.63 | 31.01 | -82.04 |
| NAD_1983_2011_StatePlane_Florida_ North_FIPS_0903_Ft_US | 6441 | USA - Florida - SPCS - N | 29.21 | -87.63 | 31.01 | -82.04 |
| NAD_1983_2011_StatePlane_Florida_ West_FIPS_0902 | 6442 | USA - Florida - SPCS - W | 26.27 | -83.34 | 29.6 | -81.13 |
| NAD_1983_2011_StatePlane_Florida_ West_FIPS_0902_Ft_US | 6443 | USA - Florida - SPCS - W | 26.27 | -83.34 | 29.6 | -81.13 |
| NAD_1983_2011_StatePlane_Georgia_ East_FIPS_1001 | 6444 | USA - Georgia - SPCS - E | 30.36 | -83.47 | 34.68 | -80.77 |
| NAD_1983_2011_StatePlane_Georgia_ East_FIPS_1001_Ft_US | 6445 | USA - Georgia - SPCS - E | 30.36 | -83.47 | 34.68 | -80.77 |
| NAD_1983_2011_StatePlane_Georgia_ West_FIPS_1002 | 6446 | USA - Georgia - SPCS - W | 30.62 | -85.61 | 35.01 | -82.99 |
| NAD_1983_2011_StatePlane_Georgia_ West_FIPS_1002_Ft_US | 6447 | USA - Georgia - SPCS - W | 30.62 | -85.61 | 35.01 | -82.99 |
| NAD_1983_2011_StatePlane_Idaho_ Central_FIPS_1102 | 6448 | USA - Idaho - SPCS - C | 41.99 | -115.3 | 45.7 | -112.68 |
| NAD_1983_2011_StatePlane_Idaho_ Central_FIPS_1102_Ft_US | 6449 | USA - Idaho - SPCS - C | 41.99 | -115.3 | 45.7 | -112.68 |
| NAD_1983_2011_StatePlane_Idaho_ East_FIPS_1101 | 6450 | USA - Idaho - SPCS - E | 41.99 | -113.24 | 44.75 | -111.04 |
| NAD_1983_2011_StatePlane_Idaho_ East_FIPS_1101_Ft_US | 6451 | USA - Idaho - SPCS - E | 41.99 | -113.24 | 44.75 | -111.04 |
| NAD_1983_2011_StatePlane_Idaho_ West_FIPS_1103 | 6452 | USA - Idaho - SPCS - W | 41.99 | -117.24 | 49.01 | -114.32 |
| NAD_1983_2011_StatePlane_Idaho_ West_FIPS_1103_Ft_US | 6453 | USA - Idaho - SPCS - W | 41.99 | -117.24 | 49.01 | -114.32 |
| NAD_1983_2011_StatePlane_Illinois_East _FIPS_1201 | 6454 | USA - Illinois - SPCS - E | 37.06 | -89.28 | 42.5 | -87.02 |
| NAD_1983_2011_StatePlane_Illinois_East _FIPS_1201_Ft_US | 6455 | USA - Illinois - SPCS - E | 37.06 | -89.28 | 42.5 | -87.02 |
| NAD_1983_2011_StatePlane_Illinois_ West_FIPS_1202 | 6456 | USA - Illinois - SPCS - W | 36.98 | -91.52 | 42.51 | -88.93 |
| NAD_1983_2011_StatePlane_Illinois_ West_FIPS_1202_Ft_US | 6457 | USA - Illinois - SPCS - W | 36.98 | -91.52 | 42.51 | -88.93 |
| NAD_1983_2011_StatePlane_Indiana_ East_FIPS_1301 | 6458 | USA - Indiana - SPCS - E | 37.95 | -86.59 | 41.77 | -84.78 |
| NAD_1983_2011_StatePlane_Indiana_ East_FIPS_1301_Ft_US | 6459 | USA - Indiana - SPCS - E | 37.95 | -86.59 | 41.77 | -84.78 |
| NAD_1983_2011_StatePlane_Indiana_ West_FIPS_1302 | 6460 | USA - Indiana - SPCS - W | 37.77 | -88.06 | 41.77 | -86.24 |
| NAD_1983_2011_StatePlane_Indiana_ West_FIPS_1302_Ft_US | 6461 | USA - Indiana - SPCS - W | 37.77 | -88.06 | 41.77 | -86.24 |
| NAD_1983_2011_StatePlane_Iowa_North _FIPS_1401 | 6462 | USA - Iowa - SPCS - N | 41.85 | -96.65 | 43.51 | -90.15 |
| NAD_1983_2011_StatePlane_Iowa_North _FIPS_1401_Ft_US | 6463 | USA - Iowa - SPCS - N | 41.85 | -96.65 | 43.51 | -90.15 |
| NAD_1983_2011_StatePlane_Iowa_South _FIPS_1402 | 6464 | USA - Iowa - SPCS - S | 40.37 | -96.14 | 42.04 | -90.14 |
| NAD_1983_2011_StatePlane_Iowa_South _FIPS_1402_Ft_US | 6465 | USA - Iowa - SPCS - S | 40.37 | -96.14 | 42.04 | -90.14 |
| NAD_1983_2011_StatePlane_Kansas_ North_FIPS_1501 | 6466 | USA - Kansas - SPCS - N | 38.52 | -102.06 | 40.01 | -94.58 |
| NAD_1983_2011_StatePlane_Kansas_ North_FIPS_1501_Ft_US | 6467 | USA - Kansas - SPCS - N | 38.52 | -102.06 | 40.01 | -94.58 |
| NAD_1983_2011_StatePlane_Kansas_ South_FIPS_1502 | 6468 | USA - Kansas - SPCS - S | 36.99 | -102.05 | 38.88 | -94.6 |
| NAD_1983_2011_StatePlane_Kansas_ South_FIPS_1502_Ft_US | 6469 | USA - Kansas - SPCS - S | 36.99 | -102.05 | 38.88 | -94.6 |
| NAD_1983_2011_StatePlane_Kentucky_ FIPS_1600 | 6472 | USA - Kentucky | 36.49 | -89.57 | 39.15 | -81.95 |
| NAD_1983_2011_StatePlane_Kentucky_ FIPS_1600_Ft_US | 6473 | USA - Kentucky | 36.49 | -89.57 | 39.15 | -81.95 |
| NAD_1983_2011_StatePlane_Kentucky_ North_FIPS_1601 | 6470 | USA - Kentucky - SPCS - N | 37.71 | -85.96 | 39.15 | -82.47 |
| NAD_1983_2011_StatePlane_Kentucky_ North_FIPS_1601_Ft_US | 6471 | USA - Kentucky - SPCS - N | 37.71 | -85.96 | 39.15 | -82.47 |
| NAD_1983_2011_StatePlane_Kentucky_ South_FIPS_1602 | 6474 | USA - Kentucky - SPCS - S | 36.49 | -89.57 | 38.17 | -81.95 |
| NAD_1983_2011_StatePlane_Kentucky_ South_FIPS_1602_Ft_US | 6475 | USA - Kentucky - SPCS - S | 36.49 | -89.57 | 38.17 | -81.95 |
| NAD_1983_2011_StatePlane_Louisiana_ North_FIPS_1701 | 6476 | USA - Louisiana - SPCS - N | 30.85 | -94.05 | 33.03 | -90.86 |
| NAD_1983_2011_StatePlane_Louisiana_ North_FIPS_1701_Ft_US | 6477 | USA - Louisiana - SPCS - N | 30.85 | -94.05 | 33.03 | -90.86 |
| NAD_1983_2011_StatePlane_Louisiana_ South_FIPS_1702 | 6478 | USA - Louisiana - SPCS83 - S | 28.85 | -93.94 | 31.07 | -88.75 |
| NAD_1983_2011_StatePlane_Louisiana_ South_FIPS_1702_Ft_US | 6479 | USA - Louisiana - SPCS83 - S | 28.85 | -93.94 | 31.07 | -88.75 |
| NAD_1983_2011_StatePlane_Maine_East _FIPS_1801 | 6483 | USA - Maine - SPCS - E | 43.88 | -70.03 | 47.47 | -66.91 |
| NAD_1983_2011_StatePlane_Maine_East _FIPS_1801_Ft_US | 6484 | USA - Maine - SPCS - E | 43.88 | -70.03 | 47.47 | -66.91 |
| NAD_1983_2011_StatePlane_Maine_ West_FIPS_1802 | 6485 | USA - Maine - SPCS - W | 43.04 | -71.09 | 46.58 | -69.26 |
| NAD_1983_2011_StatePlane_Maine_ West_FIPS_1802_Ft_US | 6486 | USA - Maine - SPCS - W | 43.04 | -71.09 | 46.58 | -69.26 |
| NAD_1983_2011_StatePlane_Maryland_ FIPS_1900 | 6487 | USA - Maryland | 37.97 | -79.49 | 39.73 | -74.97 |
| NAD_1983_2011_StatePlane_Maryland_ FIPS_1900_Ft_US | 6488 | USA - Maryland | 37.97 | -79.49 | 39.73 | -74.97 |
| NAD_1983_2011_StatePlane_ Massachusetts_Island_FIPS_2002 | 6489 | USA - Massachusetts - SPCS - islands | 41.19 | -70.91 | 41.51 | -69.89 |
| NAD_1983_2011_StatePlane_ Massachusetts_Isl_FIPS_2002_FtUS | 6490 | USA - Massachusetts - SPCS - islands | 41.19 | -70.91 | 41.51 | -69.89 |
| NAD_1983_2011_StatePlane_ Massachusetts_Mainland_FIPS_2001 | 6491 | USA - Massachusetts - SPCS - mainland | 41.46 | -73.5 | 42.89 | -69.86 |
| NAD_1983_2011_StatePlane_ Massachusetts_Mnld_FIPS_2001_FtUS | 6492 | USA - Massachusetts - SPCS - mainland | 41.46 | -73.5 | 42.89 | -69.86 |
| NAD_1983_2011_StatePlane_Michigan_ Central_FIPS_2112 | 6493 | USA - Michigan - SPCS - C | 43.8 | -87.06 | 45.92 | -82.27 |
| NAD_1983_2011_StatePlane_Michigan_ Central_FIPS_2112_Ft_Intl | 6494 | USA - Michigan - SPCS - C | 43.8 | -87.06 | 45.92 | -82.27 |
| NAD_1983_2011_StatePlane_Michigan_ North_FIPS_2111 | 6495 | USA - Michigan - SPCS - N | 45.08 | -90.42 | 48.32 | -83.44 |
| NAD_1983_2011_StatePlane_Michigan_ North_FIPS_2111_Ft_Intl | 6496 | USA - Michigan - SPCS - N | 45.08 | -90.42 | 48.32 | -83.44 |
| NAD_1983_2011_StatePlane_Michigan_ South_FIPS_2113 | 6498 | USA - Michigan - SPCS - S | 41.69 | -87.2 | 44.22 | -82.13 |
| NAD_1983_2011_StatePlane_Michigan_ South_FIPS_2113_Ft_Intl | 6499 | USA - Michigan - SPCS - S | 41.69 | -87.2 | 44.22 | -82.13 |
| NAD_1983_2011_StatePlane_Minnesota_ Central_FIPS_2202 | 6500 | USA - Minnesota - SPCS - C | 45.28 | -96.86 | 47.48 | -92.29 |
| NAD_1983_2011_StatePlane_Minnesota_ Central_FIPS_2202_Ft_US | 6501 | USA - Minnesota - SPCS - C | 45.28 | -96.86 | 47.48 | -92.29 |
| NAD_1983_2011_StatePlane_Minnesota_ North_FIPS_2201 | 6502 | USA - Minnesota - SPCS - N | 46.64 | -97.22 | 49.38 | -89.49 |
| NAD_1983_2011_StatePlane_Minnesota_ North_FIPS_2201_Ft_US | 6503 | USA - Minnesota - SPCS - N | 46.64 | -97.22 | 49.38 | -89.49 |
| NAD_1983_2011_StatePlane_Minnesota_ South_FIPS_2203 | 6504 | USA - Minnesota - SPCS - S | 43.49 | -96.85 | 45.59 | -91.21 |
| NAD_1983_2011_StatePlane_Minnesota_ South_FIPS_2203_Ft_US | 6505 | USA - Minnesota - SPCS - S | 43.49 | -96.85 | 45.59 | -91.21 |
| NAD_1983_2011_StatePlane_Mississippi_ East_FIPS_2301 | 6506 | USA - Mississippi - SPCS - E | 30.01 | -89.97 | 35.01 | -88.09 |
| NAD_1983_2011_StatePlane_Mississippi_ East_FIPS_2301_Ft_US | 6507 | USA - Mississippi - SPCS - E | 30.01 | -89.97 | 35.01 | -88.09 |
| NAD_1983_2011_StatePlane_Mississippi_ West_FIPS_2302 | 6509 | USA - Mississippi - SPCS - W | 31 | -91.65 | 35.01 | -89.37 |
| NAD_1983_2011_StatePlane_Mississippi_ West_FIPS_2302_Ft_US | 6510 | USA - Mississippi - SPCS - W | 31 | -91.65 | 35.01 | -89.37 |
| NAD_1983_2011_StatePlane_Missouri_ Central_FIPS_2402 | 6511 | USA - Missouri - SPCS - C | 36.48 | -93.79 | 40.61 | -91.41 |
| NAD_1983_2011_StatePlane_Missouri_ East_FIPS_2401 | 6512 | USA - Missouri - SPCS - E | 35.98 | -91.97 | 40.61 | -89.1 |
| NAD_1983_2011_StatePlane_Missouri_ West_FIPS_2403 | 6513 | USA - Missouri - SPCS - W | 36.48 | -95.77 | 40.59 | -93.48 |
| NAD_1983_2011_StatePlane_Montana_ FIPS_2500 | 6514 | USA - Montana | 44.35 | -116.07 | 49.01 | -104.04 |
| NAD_1983_2011_StatePlane_Montana_ FIPS_2500_Ft_Intl | 6515 | USA - Montana | 44.35 | -116.07 | 49.01 | -104.04 |
| NAD_1983_2011_StatePlane_Nebraska_ FIPS_2600 | 6516 | USA - Nebraska | 39.99 | -104.06 | 43.01 | -95.3 |
| NAD_1983_2011_StatePlane_Nebraska_ FIPS_2600_Ft_US | 6880 | USA - Nebraska | 39.99 | -104.06 | 43.01 | -95.3 |
| NAD_1983_2011_StatePlane_Nevada_ Central_FIPS_2702 | 6518 | USA - Nevada - SPCS - C | 36 | -118.19 | 41 | -114.99 |
| NAD_1983_2011_StatePlane_Nevada_ Central_FIPS_2702_Ft_US | 6519 | USA - Nevada - SPCS - C | 36 | -118.19 | 41 | -114.99 |
| NAD_1983_2011_StatePlane_Nevada_ East_FIPS_2701 | 6520 | USA - Nevada - SPCS - E | 34.99 | -117.01 | 42 | -114.03 |
| NAD_1983_2011_StatePlane_Nevada_ East_FIPS_2701_Ft_US | 6521 | USA - Nevada - SPCS - E | 34.99 | -117.01 | 42 | -114.03 |
| NAD_1983_2011_StatePlane_Nevada_ West_FIPS_2703 | 6522 | USA - Nevada - SPCS - W | 36.95 | -120 | 42 | -116.99 |
| NAD_1983_2011_StatePlane_Nevada_ West_FIPS_2703_Ft_US | 6523 | USA - Nevada - SPCS - W | 36.95 | -120 | 42 | -116.99 |
| NAD_1983_2011_StatePlane_New_ Hampshire_FIPS_2800 | 6524 | USA - New Hampshire | 42.69 | -72.56 | 45.31 | -70.63 |
| NAD_1983_2011_StatePlane_New_ Hampshire_FIPS_2800_Ft_US | 6525 | USA - New Hampshire | 42.69 | -72.56 | 45.31 | -70.63 |
| NAD_1983_2011_StatePlane_New_Jersey _FIPS_2900 | 6526 | USA - New Jersey | 38.87 | -75.6 | 41.36 | -73.88 |
| NAD_1983_2011_StatePlane_New_Jersey _FIPS_2900_Ft_US | 6527 | USA - New Jersey | 38.87 | -75.6 | 41.36 | -73.88 |
| NAD_1983_2011_StatePlane_New_ Mexico_Central_FIPS_3002 | 6528 | USA - New Mexico - SPCS83 - C | 31.78 | -107.73 | 37 | -104.84 |
| NAD_1983_2011_StatePlane_New_ Mexico_Central_FIPS_3002_Ft_US | 6529 | USA - New Mexico - SPCS83 - C | 31.78 | -107.73 | 37 | -104.84 |
| NAD_1983_2011_StatePlane_New_ Mexico_East_FIPS_3001 | 6530 | USA - New Mexico - SPCS - E | 32 | -105.72 | 37 | -102.99 |
| NAD_1983_2011_StatePlane_New_ Mexico_East_FIPS_3001_Ft_US | 6531 | USA - New Mexico - SPCS - E | 32 | -105.72 | 37 | -102.99 |
| NAD_1983_2011_StatePlane_New_ Mexico_West_FIPS_3003 | 6532 | USA - New Mexico - SPCS83 - W | 31.33 | -109.06 | 37 | -106.32 |
| NAD_1983_2011_StatePlane_New_ Mexico_West_FIPS_3003_Ft_US | 6533 | USA - New Mexico - SPCS83 - W | 31.33 | -109.06 | 37 | -106.32 |
| NAD_1983_2011_StatePlane_New_York_ Central_FIPS_3102 | 6534 | USA - New York - SPCS - C | 41.99 | -77.75 | 44.41 | -75.04 |
| NAD_1983_2011_StatePlane_New_York_ Central_FIPS_3102_Ft_US | 6535 | USA - New York - SPCS - C | 41.99 | -77.75 | 44.41 | -75.04 |
| NAD_1983_2011_StatePlane_New_York_ East_FIPS_3101 | 6536 | USA - New York - SPCS - E | 40.88 | -75.87 | 45.02 | -73.23 |
| NAD_1983_2011_StatePlane_New_York_ East_FIPS_3101_Ft_US | 6537 | USA - New York - SPCS - E | 40.88 | -75.87 | 45.02 | -73.23 |
| NAD_1983_2011_StatePlane_New_York_ Long_Island_FIPS_3104 | 6538 | USA - New York - SPCS - Long Island | 40.47 | -74.26 | 41.3 | -71.8 |
| NAD_1983_2011_StatePlane_New_York_ Long_Isl_FIPS_3104_Ft_US | 6539 | USA - New York - SPCS - Long Island | 40.47 | -74.26 | 41.3 | -71.8 |
| NAD_1983_2011_StatePlane_New_York_ West_FIPS_3103 | 6540 | USA - New York - SPCS - W | 41.99 | -79.77 | 43.64 | -77.36 |
| NAD_1983_2011_StatePlane_New_York_ West_FIPS_3103_Ft_US | 6541 | USA - New York - SPCS - W | 41.99 | -79.77 | 43.64 | -77.36 |
| NAD_1983_2011_StatePlane_North_ Carolina_FIPS_3200 | 6542 | USA - North Carolina | 33.83 | -84.33 | 36.59 | -75.38 |
| NAD_1983_2011_StatePlane_North_ Carolina_FIPS_3200_Ft_US | 6543 | USA - North Carolina | 33.83 | -84.33 | 36.59 | -75.38 |
| NAD_1983_2011_StatePlane_North_ Dakota_North_FIPS_3301 | 6544 | USA - North Dakota - SPCS - N | 47.15 | -104.07 | 49.01 | -96.83 |
| NAD_1983_2011_StatePlane_North_ Dakota_North_FIPS_3301_FtI | 6545 | USA - North Dakota - SPCS - N | 47.15 | -104.07 | 49.01 | -96.83 |
| NAD_1983_2011_StatePlane_North_ Dakota_South_FIPS_3302 | 6546 | USA - North Dakota - SPCS - S | 45.93 | -104.05 | 47.83 | -96.55 |
| NAD_1983_2011_StatePlane_North_ Dakota_South_FIPS_3302_FtI | 6547 | USA - North Dakota - SPCS - S | 45.93 | -104.05 | 47.83 | -96.55 |
| NAD_1983_2011_StatePlane_Ohio_North _FIPS_3401 | 6548 | USA - Ohio - SPCS - N | 40.1 | -84.81 | 42.33 | -80.51 |
| NAD_1983_2011_StatePlane_Ohio_North _FIPS_3401_Ft_US | 6549 | USA - Ohio - SPCS - N | 40.1 | -84.81 | 42.33 | -80.51 |
| NAD_1983_2011_StatePlane_Ohio_South _FIPS_3402 | 6550 | USA - Ohio - SPCS - S | 38.4 | -84.83 | 40.36 | -80.7 |
| NAD_1983_2011_StatePlane_Ohio_South _FIPS_3402_Ft_US | 6551 | USA - Ohio - SPCS - S | 38.4 | -84.83 | 40.36 | -80.7 |
| NAD_1983_2011_StatePlane_Oklahoma_ North_FIPS_3501 | 6552 | USA - Oklahoma - SPCS - N | 35.27 | -103 | 37.01 | -94.42 |
| NAD_1983_2011_StatePlane_Oklahoma_ North_FIPS_3501_Ft_US | 6553 | USA - Oklahoma - SPCS - N | 35.27 | -103 | 37.01 | -94.42 |
| NAD_1983_2011_StatePlane_Oklahoma_ South_FIPS_3502 | 6554 | USA - Oklahoma - SPCS - S | 33.62 | -100 | 35.57 | -94.42 |
| NAD_1983_2011_StatePlane_Oklahoma_ South_FIPS_3502_Ft_US | 6555 | USA - Oklahoma - SPCS - S | 33.62 | -100 | 35.57 | -94.42 |
| NAD_1983_2011_StatePlane_Oregon_ North_FIPS_3601 | 6558 | USA - Oregon - SPCS - N | 43.95 | -124.17 | 46.26 | -116.47 |
| NAD_1983_2011_StatePlane_Oregon_ North_FIPS_3601_Ft_Intl | 6559 | USA - Oregon - SPCS - N | 43.95 | -124.17 | 46.26 | -116.47 |
| NAD_1983_2011_StatePlane_Oregon_ South_FIPS_3602 | 6560 | USA - Oregon - SPCS - S | 41.98 | -124.6 | 44.56 | -116.9 |
| NAD_1983_2011_StatePlane_Oregon_ South_FIPS_3602_Ft_Intl | 6561 | USA - Oregon - SPCS - S | 41.98 | -124.6 | 44.56 | -116.9 |
| NAD_1983_2011_StatePlane_ Pennsylvania_North_FIPS_3701 | 6562 | USA - Pennsylvania - SPCS - N | 40.6 | -80.53 | 42.53 | -74.7 |
| NAD_1983_2011_StatePlane_ Pennsylvania_North_FIPS_3701_Ft_US | 6563 | USA - Pennsylvania - SPCS - N | 40.6 | -80.53 | 42.53 | -74.7 |
| NAD_1983_2011_StatePlane_ Pennsylvania_South_FIPS_3702 | 6564 | USA - Pennsylvania - SPCS - S | 39.71 | -80.53 | 41.18 | -74.72 |
| NAD_1983_2011_StatePlane_ Pennsylvania_South_FIPS_3702_Ft_US | 6565 | USA - Pennsylvania - SPCS - S | 39.71 | -80.53 | 41.18 | -74.72 |
| NAD_1983_2011_StatePlane_Puerto_ Rico_Virgin_Isls_FIPS_5200 | 6566 | Caribbean - Puerto Rico and US Virgin Islands - onshore | 17.62 | -67.97 | 18.57 | -64.51 |
| NAD_1983_2011_StatePlane_Rhode_ Island_FIPS_3800 | 6567 | USA - Rhode Island | 41.13 | -71.85 | 42.02 | -71.08 |
| NAD_1983_2011_StatePlane_Rhode_ Island_FIPS_3800_Ft_US | 6568 | USA - Rhode Island | 41.13 | -71.85 | 42.02 | -71.08 |
| NAD_1983_2011_StatePlane_South_ Carolina_FIPS_3900 | 6569 | USA - South Carolina | 32.05 | -83.36 | 35.21 | -78.52 |
| NAD_1983_2011_StatePlane_South_ Carolina_FIPS_3900_Ft_Intl | 6570 | USA - South Carolina | 32.05 | -83.36 | 35.21 | -78.52 |
| NAD_1983_2011_StatePlane_South_ Dakota_North_FIPS_4001 | 6571 | USA - South Dakota - SPCS - N | 44.14 | -104.07 | 45.95 | -96.45 |
| NAD_1983_2011_StatePlane_South_ Dakota_North_FIPS_4001_Ft_US | 6572 | USA - South Dakota - SPCS - N | 44.14 | -104.07 | 45.95 | -96.45 |
| NAD_1983_2011_StatePlane_South_ Dakota_South_FIPS_4002 | 6573 | USA - South Dakota - SPCS - S | 42.48 | -104.06 | 44.79 | -96.43 |
| NAD_1983_2011_StatePlane_South_ Dakota_South_FIPS_4002_Ft_US | 6574 | USA - South Dakota - SPCS - S | 42.48 | -104.06 | 44.79 | -96.43 |
| NAD_1983_2011_StatePlane_Tennessee_ FIPS_4100 | 6575 | USA - Tennessee | 34.98 | -90.31 | 36.68 | -81.65 |
| NAD_1983_2011_StatePlane_Tennessee_ FIPS_4100_Ft_US | 6576 | USA - Tennessee | 34.98 | -90.31 | 36.68 | -81.65 |
| NAD_1983_2011_StatePlane_Texas_ Central_FIPS_4203 | 6577 | USA - Texas - SPCS - C | 29.78 | -106.66 | 32.27 | -93.5 |
| NAD_1983_2011_StatePlane_Texas_ Central_FIPS_4203_Ft_US | 6578 | USA - Texas - SPCS - C | 29.78 | -106.66 | 32.27 | -93.5 |
| NAD_1983_2011_StatePlane_Texas_ North_Central_FIPS_4202 | 6583 | USA - Texas - SPCS - NC | 31.72 | -103.07 | 34.58 | -94 |
| NAD_1983_2011_StatePlane_Texas_ North_Central_FIPS_4202_FtUS | 6584 | USA - Texas - SPCS - NC | 31.72 | -103.07 | 34.58 | -94 |
| NAD_1983_2011_StatePlane_Texas_ North_FIPS_4201 | 6581 | USA - Texas - SPCS - N | 34.3 | -103.03 | 36.5 | -99.99 |
| NAD_1983_2011_StatePlane_Texas_ North_FIPS_4201_Ft_US | 6582 | USA - Texas - SPCS - N | 34.3 | -103.03 | 36.5 | -99.99 |
| NAD_1983_2011_StatePlane_Texas_ South_Central_FIPS_4204 | 6587 | USA - Texas - SPCS83 - SC | 27.78 | -105 | 30.67 | -93.76 |
| NAD_1983_2011_StatePlane_Texas_ South_Central_FIPS_4204_FtUS | 6588 | USA - Texas - SPCS83 - SC | 27.78 | -105 | 30.67 | -93.76 |
| NAD_1983_2011_StatePlane_Texas_ South_FIPS_4205 | 6585 | USA - Texas - SPCS83 - S | 25.83 | -100.2 | 28.21 | -96.85 |
| NAD_1983_2011_StatePlane_Texas_ South_FIPS_4205_Ft_US | 6586 | USA - Texas - SPCS83 - S | 25.83 | -100.2 | 28.21 | -96.85 |
| NAD_1983_2011_StatePlane_Utah_ Central_FIPS_4302 | 6619 | USA - Utah - SPCS - C | 38.49 | -114.05 | 41.08 | -109.04 |
| NAD_1983_2011_StatePlane_Utah_ Central_FIPS_4302_Ft_Intl | 103167 | USA - Utah - SPCS - C | 38.49 | -114.05 | 41.08 | -109.04 |
| NAD_1983_2011_StatePlane_Utah_ Central_FIPS_4302_Ft_US | 6625 | USA - Utah - SPCS - C | 38.49 | -114.05 | 41.08 | -109.04 |
| NAD_1983_2011_StatePlane_Utah_North _FIPS_4301 | 6620 | USA - Utah - SPCS - N | 40.55 | -114.04 | 42.01 | -109.04 |
| NAD_1983_2011_StatePlane_Utah_North _FIPS_4301_Ft_Intl | 103166 | USA - Utah - SPCS - N | 40.55 | -114.04 | 42.01 | -109.04 |
| NAD_1983_2011_StatePlane_Utah_North _FIPS_4301_Ft_US | 6626 | USA - Utah - SPCS - N | 40.55 | -114.04 | 42.01 | -109.04 |
| NAD_1983_2011_StatePlane_Utah_South _FIPS_4303 | 6621 | USA - Utah - SPCS - S | 36.99 | -114.05 | 38.58 | -109.04 |
| NAD_1983_2011_StatePlane_Utah_South _FIPS_4303_Ft_Intl | 103168 | USA - Utah - SPCS - S | 36.99 | -114.05 | 38.58 | -109.04 |
| NAD_1983_2011_StatePlane_Utah_South _FIPS_4303_Ft_US | 6627 | USA - Utah - SPCS - S | 36.99 | -114.05 | 38.58 | -109.04 |
| NAD_1983_2011_StatePlane_Vermont_ FIPS_4400 | 6589 | USA - Vermont | 42.72 | -73.44 | 45.03 | -71.5 |
| NAD_1983_2011_StatePlane_Vermont_ FIPS_4400_Ft_US | 6590 | USA - Vermont | 42.72 | -73.44 | 45.03 | -71.5 |
| NAD_1983_2011_StatePlane_Virginia_ North_FIPS_4501 | 6592 | USA - Virginia - SPCS - N | 37.77 | -80.06 | 39.46 | -76.51 |
| NAD_1983_2011_StatePlane_Virginia_ North_FIPS_4501_Ft_US | 6593 | USA - Virginia - SPCS - N | 37.77 | -80.06 | 39.46 | -76.51 |
| NAD_1983_2011_StatePlane_Virginia_ South_FIPS_4502 | 6594 | USA - Virginia - SPCS - S | 36.54 | -83.68 | 38.28 | -75.31 |
| NAD_1983_2011_StatePlane_Virginia_ South_FIPS_4502_Ft_US | 6595 | USA - Virginia - SPCS - S | 36.54 | -83.68 | 38.28 | -75.31 |
| NAD_1983_2011_StatePlane_Washington _North_FIPS_4601 | 6596 | USA - Washington - SPCS83 - N | 47.08 | -124.79 | 49.05 | -117.02 |
| NAD_1983_2011_StatePlane_Washington _North_FIPS_4601_Ft_US | 6597 | USA - Washington - SPCS83 - N | 47.08 | -124.79 | 49.05 | -117.02 |
| NAD_1983_2011_StatePlane_Washington _South_FIPS_4602 | 6598 | USA - Washington - SPCS83 - S | 45.54 | -124.4 | 47.61 | -116.91 |
| NAD_1983_2011_StatePlane_Washington _South_FIPS_4602_Ft_US | 6599 | USA - Washington - SPCS83 - S | 45.54 | -124.4 | 47.61 | -116.91 |
| NAD_1983_2011_StatePlane_West_ Virginia_North_FIPS_4701 | 6600 | USA - West Virginia - SPCS - N | 38.76 | -81.76 | 40.64 | -77.72 |
| NAD_1983_2011_StatePlane_West_ Virginia_North_FIPS_4701_FtUS | 6601 | USA - West Virginia - SPCS - N | 38.76 | -81.76 | 40.64 | -77.72 |
| NAD_1983_2011_StatePlane_West_ Virginia_South_FIPS_4702 | 6602 | USA - West Virginia - SPCS - S | 37.2 | -82.65 | 39.17 | -79.05 |
| NAD_1983_2011_StatePlane_West_ Virginia_South_FIPS_4702_FtUS | 6603 | USA - West Virginia - SPCS - S | 37.2 | -82.65 | 39.17 | -79.05 |
| NAD_1983_2011_StatePlane_Wisconsin_ Central_FIPS_4802 | 6879 | USA - Wisconsin - SPCS - C | 43.98 | -92.89 | 45.8 | -86.25 |
| NAD_1983_2011_StatePlane_Wisconsin_ Central_FIPS_4802_Ft_US | 6605 | USA - Wisconsin - SPCS - C | 43.98 | -92.89 | 45.8 | -86.25 |
| NAD_1983_2011_StatePlane_Wisconsin_ North_FIPS_4801 | 6606 | USA - Wisconsin - SPCS - N | 45.37 | -92.89 | 47.31 | -88.05 |
| NAD_1983_2011_StatePlane_Wisconsin_ North_FIPS_4801_Ft_US | 6607 | USA - Wisconsin - SPCS - N | 45.37 | -92.89 | 47.31 | -88.05 |
| NAD_1983_2011_StatePlane_Wisconsin_ South_FIPS_4803 | 6608 | USA - Wisconsin - SPCS - S | 42.48 | -91.43 | 44.33 | -86.95 |
| NAD_1983_2011_StatePlane_Wisconsin_ South_FIPS_4803_Ft_US | 6609 | USA - Wisconsin - SPCS - S | 42.48 | -91.43 | 44.33 | -86.95 |
| NAD_1983_2011_StatePlane_Wyoming_ East_Central_FIPS_4902 | 6613 | USA - Wyoming - SPCS - EC | 40.99 | -108.63 | 45.01 | -106 |
| NAD_1983_2011_StatePlane_Wyoming_ East_FIPS_4901 | 6611 | USA - Wyoming - SPCS - E | 40.99 | -106.33 | 45.01 | -104.05 |
| NAD_1983_2011_StatePlane_Wyoming_ East_FIPS_4901_Ft_US | 6612 | USA - Wyoming - SPCS - E | 40.99 | -106.33 | 45.01 | -104.05 |
| NAD_1983_2011_StatePlane_Wyoming_ E_Central_FIPS_4902_Ft_US | 6614 | USA - Wyoming - SPCS - EC | 40.99 | -108.63 | 45.01 | -106 |
| NAD_1983_2011_StatePlane_Wyoming_ W_Central_FIPS_4903_Ft_US | 6618 | USA - Wyoming - SPCS - WC | 40.99 | -111.06 | 45.01 | -107.5 |
| NAD_1983_2011_StatePlane_Wyoming_ West_Central_FIPS_4903 | 6617 | USA - Wyoming - SPCS - WC | 40.99 | -111.06 | 45.01 | -107.5 |
| NAD_1983_2011_StatePlane_Wyoming_ West_FIPS_4904 | 6615 | USA - Wyoming - SPCS - W | 40.99 | -111.06 | 44.67 | -109.04 |
| NAD_1983_2011_StatePlane_Wyoming_ West_FIPS_4904_Ft_US | 6616 | USA - Wyoming - SPCS - W | 40.99 | -111.06 | 44.67 | -109.04 |
| NAD_1983_2011_Texas_Centric_ Mapping_System_Albers | 6579 | USA - Texas | 25.83 | -106.66 | 36.5 | -93.5 |
| NAD_1983_2011_Texas_Centric_ Mapping_System_Lambert | 6580 | USA - Texas | 25.83 | -106.66 | 36.5 | -93.5 |
| NAD_1983_2011_UTM_Zone_10N | 6339 | USA - 126°W to 120°W | 30.54 | -126 | 49.09 | -119.99 |
| NAD_1983_2011_UTM_Zone_11N | 6340 | USA - 120°W to 114°W | 30.88 | -120 | 49.01 | -114 |
| NAD_1983_2011_UTM_Zone_12N | 6341 | USA - 114°W to 108°W | 31.33 | -114 | 49.01 | -108 |
| NAD_1983_2011_UTM_Zone_13N | 6342 | USA - 108°W to 102°W | 28.98 | -108 | 49.01 | -102 |
| NAD_1983_2011_UTM_Zone_14N | 6343 | USA - 102°W to 96°W | 25.83 | -102 | 49.01 | -96 |
| NAD_1983_2011_UTM_Zone_15N | 6344 | USA - 96°W to 90°W | 25.61 | -96.01 | 49.38 | -90 |
| NAD_1983_2011_UTM_Zone_16N | 6345 | USA - 90°W to 84°W | 23.97 | -90 | 48.32 | -84 |
| NAD_1983_2011_UTM_Zone_17N | 6346 | USA - 84°W to 78°W | 23.81 | -84 | 46.13 | -78 |
| NAD_1983_2011_UTM_Zone_18N | 6347 | USA - 78°W to 72°W | 28.28 | -78 | 45.03 | -72 |
| NAD_1983_2011_UTM_Zone_19N | 6348 | USA - 72°W to 66°W | 33.61 | -72 | 47.47 | -65.99 |
| NAD_1983_2011_UTM_Zone_1N | 6330 | USA - 180°W to 174°W - AK, OCS | 47.88 | -180 | 63.21 | -173.99 |
| NAD_1983_2011_UTM_Zone_20N | 102045 | Caribbean - Puerto Rico and US Virgin Islands | 14.92 | -68.49 | 21.86 | -63.88 |
| NAD_1983_2011_UTM_Zone_2N | 6331 | USA - 174°W to 168°W - AK, OCS | 48.66 | -174 | 73.05 | -167.99 |
| NAD_1983_2011_UTM_Zone_3N | 6332 | USA - 168°W to 162°W - AK, OCS | 49.52 | -168 | 74.29 | -161.99 |
| NAD_1983_2011_UTM_Zone_4N | 6333 | USA - 162°W to 156°W - AK, OCS | 50.98 | -162 | 74.71 | -155.99 |
| NAD_1983_2011_UTM_Zone_59N | 6328 | USA - west of 174°E - AK, OCS | 49.01 | 167.65 | 56.28 | 174.01 |
| NAD_1983_2011_UTM_Zone_5N | 6334 | USA - 156°W to 150°W - AK, OCS | 52.15 | -156 | 74.71 | -149.99 |
| NAD_1983_2011_UTM_Zone_60N | 6329 | USA - 174°E to 180°E - AK, OCS | 47.92 | 174 | 56.67 | 180 |
| NAD_1983_2011_UTM_Zone_6N | 6335 | USA - 150°W to 144°W - AK, OCS | 54.05 | -150 | 74.13 | -143.99 |
| NAD_1983_2011_UTM_Zone_7N | 6336 | USA - 144°W to 138°W | 53.47 | -144 | 73.59 | -137.99 |
| NAD_1983_2011_UTM_Zone_8N | 6337 | USA - 138°W to 132°W | 53.6 | -138 | 73.04 | -131.99 |
| NAD_1983_2011_UTM_Zone_9N | 6338 | USA - 132°W to 126°W | 35.38 | -132 | 56.84 | -126 |
| NAD_1983_2011_Virginia_Lambert | 6591 | USA - Virginia | 36.54 | -83.68 | 39.46 | -75.31 |
| NAD_1983_2011_Wisconsin_TM | 6610 | USA - Wisconsin | 42.48 | -92.89 | 47.31 | -86.25 |
| NAD_1983_2011_Wisconsin_TM_US_Ft | 102974 | USA - Wisconsin | 42.48 | -92.89 | 47.31 | -86.25 |
| NAD_1983_2011_WISCRS_Adams_and_ Juneau_Feet | 7587 | USA - Wisconsin - Adams and Juneau | 43.64 | -90.32 | 44.25 | -89.59 |
| NAD_1983_2011_WISCRS_Adams_and_ Juneau_Meters | 7528 | USA - Wisconsin - Adams and Juneau | 43.64 | -90.32 | 44.25 | -89.59 |
| NAD_1983_2011_WISCRS_Ashland_Feet | 7588 | USA - Wisconsin - Ashland | 45.98 | -90.93 | 47.09 | -90.3 |
| NAD_1983_2011_WISCRS_Ashland_ Meters | 7529 | USA - Wisconsin - Ashland | 45.98 | -90.93 | 47.09 | -90.3 |
| NAD_1983_2011_WISCRS_Barron_Feet | 7589 | USA - Wisconsin - Barron | 45.2 | -92.16 | 45.65 | -91.53 |
| NAD_1983_2011_WISCRS_Barron_ Meters | 7530 | USA - Wisconsin - Barron | 45.2 | -92.16 | 45.65 | -91.53 |
| NAD_1983_2011_WISCRS_Bayfield_Feet | 7590 | USA - Wisconsin - Bayfield | 46.15 | -91.56 | 47.01 | -90.75 |
| NAD_1983_2011_WISCRS_Bayfield_ Meters | 7531 | USA - Wisconsin - Bayfield | 46.15 | -91.56 | 47.01 | -90.75 |
| NAD_1983_2011_WISCRS_Brown_Feet | 7591 | USA - Wisconsin - Brown | 44.24 | -88.26 | 44.68 | -87.76 |
| NAD_1983_2011_WISCRS_Brown_Meters | 7532 | USA - Wisconsin - Brown | 44.24 | -88.26 | 44.68 | -87.76 |
| NAD_1983_2011_WISCRS_Buffalo_Feet | 7592 | USA - Wisconsin - Buffalo | 44.02 | -92.09 | 44.6 | -91.52 |
| NAD_1983_2011_WISCRS_Buffalo_ Meters | 7533 | USA - Wisconsin - Buffalo | 44.02 | -92.09 | 44.6 | -91.52 |
| NAD_1983_2011_WISCRS_Burnett_Feet | 7593 | USA - Wisconsin - Burnett | 45.63 | -92.89 | 46.16 | -92.03 |
| NAD_1983_2011_WISCRS_Burnett_ Meters | 7534 | USA - Wisconsin - Burnett | 45.63 | -92.89 | 46.16 | -92.03 |
| NAD_1983_2011_WISCRS_Calumet_ Fond_du_Lac_Outagamie_Winnebago_ Feet | 7594 | USA - Wisconsin - Calumet, Fond du Lac, Outagamie and Winnebago | 43.54 | -88.89 | 44.6 | -88.04 |
| NAD_1983_2011_WISCRS_Calumet_ Fond_du_Lac_Outagamie_Winnebago_ Meters | 7535 | USA - Wisconsin - Calumet, Fond du Lac, Outagamie and Winnebago | 43.54 | -88.89 | 44.6 | -88.04 |
| NAD_1983_2011_WISCRS_Chippewa_ Feet | 7595 | USA - Wisconsin - Chippewa | 44.85 | -91.67 | 45.3 | -90.92 |
| NAD_1983_2011_WISCRS_Chippewa_ Meters | 7536 | USA - Wisconsin - Chippewa | 44.85 | -91.67 | 45.3 | -90.92 |
| NAD_1983_2011_WISCRS_Clark_Feet | 7596 | USA - Wisconsin - Clark | 44.42 | -90.93 | 45.04 | -90.31 |
| NAD_1983_2011_WISCRS_Clark_Meters | 7537 | USA - Wisconsin - Clark | 44.42 | -90.93 | 45.04 | -90.31 |
| NAD_1983_2011_WISCRS_Columbia_ Feet | 7597 | USA - Wisconsin - Columbia | 43.28 | -89.79 | 43.65 | -89 |
| NAD_1983_2011_WISCRS_Columbia_ Meters | 7538 | USA - Wisconsin - Columbia | 43.28 | -89.79 | 43.65 | -89 |
| NAD_1983_2011_WISCRS_Crawford_ Feet | 7598 | USA - Wisconsin - Crawford | 42.98 | -91.22 | 43.43 | -90.66 |
| NAD_1983_2011_WISCRS_Crawford_ Meters | 7539 | USA - Wisconsin - Crawford | 42.98 | -91.22 | 43.43 | -90.66 |
| NAD_1983_2011_WISCRS_Dane_Feet | 7599 | USA - Wisconsin - Dane | 42.84 | -89.84 | 43.3 | -89 |
| NAD_1983_2011_WISCRS_Dane_Meters | 7540 | USA - Wisconsin - Dane | 42.84 | -89.84 | 43.3 | -89 |
| NAD_1983_2011_WISCRS_Dodge_and_ Jefferson_Feet | 7600 | USA - Wisconsin - Dodge and Jefferson | 42.84 | -89.02 | 43.64 | -88.4 |
| NAD_1983_2011_WISCRS_Dodge_and_ Jefferson_Meters | 7541 | USA - Wisconsin - Dodge and Jefferson | 42.84 | -89.02 | 43.64 | -88.4 |
| NAD_1983_2011_WISCRS_Door_Feet | 7601 | USA - Wisconsin - Oneida | 45.46 | -90.05 | 45.91 | -89.04 |
| NAD_1983_2011_WISCRS_Door_Meters | 7542 | USA - Wisconsin - Door | 44.67 | -87.74 | 45.43 | -86.8 |
| NAD_1983_2011_WISCRS_Douglas_Feet | 7602 | USA - Wisconsin - Douglas | 46.15 | -92.3 | 46.76 | -91.55 |
| NAD_1983_2011_WISCRS_Douglas_ Meters | 7543 | USA - Wisconsin - Douglas | 46.15 | -92.3 | 46.76 | -91.55 |
| NAD_1983_2011_WISCRS_Dunn_Feet | 7603 | USA - Wisconsin - Dunn | 44.68 | -92.16 | 45.21 | -91.64 |
| NAD_1983_2011_WISCRS_Dunn_Meters | 7544 | USA - Wisconsin - Dunn | 44.68 | -92.16 | 45.21 | -91.64 |
| NAD_1983_2011_WISCRS_Eau_Claire_ Feet | 7604 | USA - Wisconsin - Eau Claire | 44.59 | -91.66 | 44.86 | -90.92 |
| NAD_1983_2011_WISCRS_EauClaire_ Meters | 7545 | USA - Wisconsin - Eau Claire | 44.59 | -91.66 | 44.86 | -90.92 |
| NAD_1983_2011_WISCRS_Florence_Feet | 7605 | USA - Wisconsin - Florence | 45.71 | -88.69 | 46.03 | -88.05 |
| NAD_1983_2011_WISCRS_Florence_ Meters | 7546 | USA - Wisconsin - Florence | 45.71 | -88.69 | 46.03 | -88.05 |
| NAD_1983_2011_WISCRS_Forest_Feet | 7606 | USA - Wisconsin - Forest | 45.37 | -89.05 | 46.08 | -88.42 |
| NAD_1983_2011_WISCRS_Forest_Meters | 7547 | USA - Wisconsin - Forest | 45.37 | -89.05 | 46.08 | -88.42 |
| NAD_1983_2011_WISCRS_Grant_Feet | 7607 | USA - Wisconsin - Grant | 42.5 | -91.16 | 43.22 | -90.42 |
| NAD_1983_2011_WISCRS_Grant_Meters | 7548 | USA - Wisconsin - Grant | 42.5 | -91.16 | 43.22 | -90.42 |
| NAD_1983_2011_WISCRS_Green_and_ Lafayette_Feet | 7608 | USA - Wisconsin - Green and Lafayette | 42.5 | -90.43 | 42.86 | -89.36 |
| NAD_1983_2011_WISCRS_Green_and_ Lafayette_Meters | 7549 | USA - Wisconsin - Green and Lafayette | 42.5 | -90.43 | 42.86 | -89.36 |
| NAD_1983_2011_WISCRS_Green_Lake_ and_Marquette_Feet | 7609 | USA - Wisconsin - Green Lake and Marquette | 43.63 | -89.6 | 43.99 | -88.88 |
| NAD_1983_2011_WISCRS_Green_Lake_ and_Marquette_Meters | 7550 | USA - Wisconsin - Green Lake and Marquette | 43.63 | -89.6 | 43.99 | -88.88 |
| NAD_1983_2011_WISCRS_Iowa_Feet | 7610 | USA - Wisconsin - Iowa | 42.81 | -90.43 | 43.21 | -89.83 |
| NAD_1983_2011_WISCRS_Iowa_Meters | 7551 | USA - Wisconsin - Iowa | 42.81 | -90.43 | 43.21 | -89.83 |
| NAD_1983_2011_WISCRS_Iron_Feet | 7611 | USA - Wisconsin - Iron | 45.98 | -90.56 | 46.6 | -89.92 |
| NAD_1983_2011_WISCRS_Iron_Meters | 7552 | USA - Wisconsin - Iron | 45.98 | -90.56 | 46.6 | -89.92 |
| NAD_1983_2011_WISCRS_Jackson_Feet | 7612 | USA - Wisconsin - Jackson | 44.07 | -91.17 | 44.6 | -90.31 |
| NAD_1983_2011_WISCRS_Jackson_ Meters | 7553 | USA - Wisconsin - Jackson | 44.07 | -91.17 | 44.6 | -90.31 |
| NAD_1983_2011_WISCRS_Kenosha_ Milwaukee_Ozaukee_Racine_Feet | 7613 | USA - Wisconsin - Kenosha, Milwaukee, Ozaukee and Racine | 42.49 | -88.31 | 43.55 | -87.75 |
| NAD_1983_2011_WISCRS_Kenosha_ Milwaukee_Ozaukee_Racine_Meters | 7554 | USA - Wisconsin - Kenosha, Milwaukee, Ozaukee and Racine | 42.49 | -88.31 | 43.55 | -87.75 |
| NAD_1983_2011_WISCRS_Kewaunee_ Manitowoc_Sheboygan_Feet | 7614 | USA - Wisconsin - Kewaunee, Manitowoc and Sheboygan | 43.54 | -88.17 | 44.68 | -87.37 |
| NAD_1983_2011_WISCRS_Kewaunee_ Manitowoc_Sheboygan_Meters | 7555 | USA - Wisconsin - Kewaunee, Manitowoc and Sheboygan | 43.54 | -88.17 | 44.68 | -87.37 |
| NAD_1983_2011_WISCRS_La_Crosse_ Feet | 7615 | USA - Wisconsin - La Crosse | 43.72 | -91.43 | 44.1 | -90.91 |
| NAD_1983_2011_WISCRS_La_Crosse_ Meters | 7556 | USA - Wisconsin - La Crosse | 43.72 | -91.43 | 44.1 | -90.91 |
| NAD_1983_2011_WISCRS_Langlade_Feet | 7616 | USA - Wisconsin - Langlade | 45.02 | -89.43 | 45.48 | -88.63 |
| NAD_1983_2011_WISCRS_Langlade_ Meters | 7557 | USA - Wisconsin - Langlade | 45.02 | -89.43 | 45.48 | -88.63 |
| NAD_1983_2011_WISCRS_Lincoln_Feet | 7617 | USA - Wisconsin - Lincoln | 45.11 | -90.05 | 45.56 | -89.42 |
| NAD_1983_2011_WISCRS_Lincoln_ Meters | 7558 | USA - Wisconsin - Lincoln | 45.11 | -90.05 | 45.56 | -89.42 |
| NAD_1983_2011_WISCRS_Marathon_ Feet | 7618 | USA - Wisconsin - Marathon | 44.68 | -90.32 | 45.13 | -89.22 |
| NAD_1983_2011_WISCRS_Marathon_ Meters | 7559 | USA - Wisconsin - Marathon | 44.68 | -90.32 | 45.13 | -89.22 |
| NAD_1983_2011_WISCRS_Marinette_ Feet | 7619 | USA - Wisconsin - Marinette | 44.96 | -88.43 | 45.8 | -87.48 |
| NAD_1983_2011_WISCRS_Marinette_ Meters | 7560 | USA - Wisconsin - Marinette | 44.96 | -88.43 | 45.8 | -87.48 |
| NAD_1983_2011_WISCRS_Menominee_ Feet | 7620 | USA - Wisconsin - Menominee | 44.85 | -88.99 | 45.12 | -88.48 |
| NAD_1983_2011_WISCRS_Menominee_ Meters | 7561 | USA - Wisconsin - Menominee | 44.85 | -88.99 | 45.12 | -88.48 |
| NAD_1983_2011_WISCRS_Monroe_Feet | 7621 | USA - Wisconsin - Monroe | 43.72 | -90.98 | 44.17 | -90.31 |
| NAD_1983_2011_WISCRS_Monroe_ Meters | 7562 | USA - Wisconsin - Monroe | 43.72 | -90.98 | 44.17 | -90.31 |
| NAD_1983_2011_WISCRS_Oconto_Feet | 7622 | USA - Wisconsin - Oconto | 44.67 | -88.69 | 45.38 | -87.76 |
| NAD_1983_2011_WISCRS_Oconto_ Meters | 7563 | USA - Wisconsin - Oconto | 44.67 | -88.69 | 45.38 | -87.76 |
| NAD_1983_2011_WISCRS_Oneida_Feet | 7623 | USA - Wisconsin - Oneida | 45.46 | -90.05 | 45.91 | -89.04 |
| NAD_1983_2011_WISCRS_Oneida_ Meters | 7564 | USA - Wisconsin - Oneida | 45.46 | -90.05 | 45.91 | -89.04 |
| NAD_1983_2011_WISCRS_Pepin_and_ Pierce_Feet | 7624 | USA - Wisconsin - Pepin and Pierce | 44.4 | -92.81 | 44.87 | -91.65 |
| NAD_1983_2011_WISCRS_Pepin_and_ Pierce_Meters | 7565 | USA - Wisconsin - Pepin and Pierce | 44.4 | -92.81 | 44.87 | -91.65 |
| NAD_1983_2011_WISCRS_Polk_Feet | 7625 | USA - Wisconsin - Polk | 45.2 | -92.89 | 45.73 | -92.15 |
| NAD_1983_2011_WISCRS_Polk_Meters | 7566 | USA - Wisconsin - Polk | 45.2 | -92.89 | 45.73 | -92.15 |
| NAD_1983_2011_WISCRS_Portage_Feet | 7626 | USA - Wisconsin - Portage | 44.24 | -89.85 | 44.69 | -89.22 |
| NAD_1983_2011_WISCRS_Portage_ Meters | 7567 | USA - Wisconsin - Portage | 44.24 | -89.85 | 44.69 | -89.22 |
| NAD_1983_2011_WISCRS_Price_Feet | 7627 | USA - Wisconsin - Price | 45.37 | -90.68 | 45.99 | -90.04 |
| NAD_1983_2011_WISCRS_Price_Meters | 7568 | USA - Wisconsin - Price | 45.37 | -90.68 | 45.99 | -90.04 |
| NAD_1983_2011_WISCRS_Richland_Feet | 7628 | USA - Wisconsin - Richland | 43.16 | -90.68 | 43.56 | -90.19 |
| NAD_1983_2011_WISCRS_Richland_ Meters | 7569 | USA - Wisconsin - Richland | 43.16 | -90.68 | 43.56 | -90.19 |
| NAD_1983_2011_WISCRS_Rock_Feet | 7629 | USA - Wisconsin - Rock | 42.49 | -89.37 | 42.85 | -88.77 |
| NAD_1983_2011_WISCRS_Rock_Meters | 7570 | USA - Wisconsin - Rock | 42.49 | -89.37 | 42.85 | -88.77 |
| NAD_1983_2011_WISCRS_Rusk_Feet | 7630 | USA - Wisconsin - Rusk | 45.29 | -91.55 | 45.64 | -90.67 |
| NAD_1983_2011_WISCRS_Rusk_Meters | 7571 | USA - Wisconsin - Rusk | 45.29 | -91.55 | 45.64 | -90.67 |
| NAD_1983_2011_WISCRS_Sauk_Feet | 7631 | USA - Wisconsin - Sauk | 43.14 | -90.32 | 43.65 | -89.59 |
| NAD_1983_2011_WISCRS_Sauk_Meters | 7572 | USA - Wisconsin - Sauk | 43.14 | -90.32 | 43.65 | -89.59 |
| NAD_1983_2011_WISCRS_Sawyer_Feet | 7632 | USA - Wisconsin - Sawyer | 45.63 | -91.56 | 46.16 | -90.67 |
| NAD_1983_2011_WISCRS_Sawyer_ Meters | 7573 | USA - Wisconsin - Sawyer | 45.63 | -91.56 | 46.16 | -90.67 |
| NAD_1983_2011_WISCRS_Shawano_Feet | 7633 | USA - Wisconsin - Shawano | 44.58 | -89.23 | 45.03 | -88.24 |
| NAD_1983_2011_WISCRS_Shawano_ Meters | 7574 | USA - Wisconsin - Shawano | 44.58 | -89.23 | 45.03 | -88.24 |
| NAD_1983_2011_WISCRS_St_Croix_Feet | 7634 | USA - Wisconsin - St. Croix | 44.85 | -92.81 | 45.22 | -92.13 |
| NAD_1983_2011_WISCRS_St_Croix_ Meters | 7575 | USA - Wisconsin - St. Croix | 44.85 | -92.81 | 45.22 | -92.13 |
| NAD_1983_2011_WISCRS_Taylor_Feet | 7635 | USA - Wisconsin - Taylor | 45.03 | -90.93 | 45.39 | -90.04 |
| NAD_1983_2011_WISCRS_Taylor_Meters | 7576 | USA - Wisconsin - Taylor | 45.03 | -90.93 | 45.39 | -90.04 |
| NAD_1983_2011_WISCRS_Trempealeau_ Feet | 7636 | USA - Wisconsin - Trempealeau | 43.98 | -91.62 | 44.6 | -91.15 |
| NAD_1983_2011_WISCRS_Trempealeau_ Meters | 7577 | USA - Wisconsin - Trempealeau | 43.98 | -91.62 | 44.6 | -91.15 |
| NAD_1983_2011_WISCRS_Vernon_Feet | 7637 | USA - Wisconsin - Vernon | 43.42 | -91.28 | 43.74 | -90.31 |
| NAD_1983_2011_WISCRS_Vernon_ Meters | 7578 | USA - Wisconsin - Vernon | 43.42 | -91.28 | 43.74 | -90.31 |
| NAD_1983_2011_WISCRS_Vilas_Feet | 7638 | USA - Wisconsin - Vilas | 45.85 | -90.05 | 46.3 | -88.93 |
| NAD_1983_2011_WISCRS_Vilas_Meters | 7579 | USA - Wisconsin - Vilas | 45.85 | -90.05 | 46.3 | -88.93 |
| NAD_1983_2011_WISCRS_Walworth_ Feet | 7639 | USA - Wisconsin - Walworth | 42.49 | -88.78 | 42.85 | -88.3 |
| NAD_1983_2011_WISCRS_Walworth_ Meters | 7580 | USA - Wisconsin - Walworth | 42.49 | -88.78 | 42.85 | -88.3 |
| NAD_1983_2011_WISCRS_Washburn_ Feet | 7640 | USA - Wisconsin - Washburn | 45.63 | -92.06 | 46.16 | -91.54 |
| NAD_1983_2011_WISCRS_Washburn_ Meters | 7581 | USA - Wisconsin - Washburn | 45.63 | -92.06 | 46.16 | -91.54 |
| NAD_1983_2011_WISCRS_Washington_ Feet | 7641 | USA - Wisconsin - Washington | 43.19 | -88.42 | 43.55 | -88.03 |
| NAD_1983_2011_WISCRS_Washington_ Meters | 7582 | USA - Wisconsin - Washington | 43.19 | -88.42 | 43.55 | -88.03 |
| NAD_1983_2011_WISCRS_Waukesha_ Feet | 7642 | USA - Wisconsin - Waukesha | 42.84 | -88.55 | 43.2 | -88.06 |
| NAD_1983_2011_WISCRS_Waukesha_ Meters | 7583 | USA - Wisconsin - Waukesha | 42.84 | -88.55 | 43.2 | -88.06 |
| NAD_1983_2011_WISCRS_Waupaca_Feet | 7643 | USA - Wisconsin - Waupaca | 44.24 | -89.23 | 44.69 | -88.6 |
| NAD_1983_2011_WISCRS_Waupaca_ Meters | 7584 | USA - Wisconsin - Waupaca | 44.24 | -89.23 | 44.69 | -88.6 |
| NAD_1983_2011_WISCRS_Waushara_ Feet | 7644 | USA - Wisconsin - Waushara | 43.98 | -89.6 | 44.25 | -88.88 |
| NAD_1983_2011_WISCRS_Waushara_ Meters | 7585 | USA - Wisconsin - Waushara | 43.98 | -89.6 | 44.25 | -88.88 |
| NAD_1983_2011_WISCRS_Wood_Feet | 7645 | USA - Wisconsin - Wood | 44.24 | -90.32 | 44.69 | -89.72 |
| NAD_1983_2011_WISCRS_Wood_Meters | 7586 | USA - Wisconsin - Wood | 44.24 | -90.32 | 44.69 | -89.72 |
| NAD_1983_3TM_111 | 3775 | Canada - Alberta - east of 112.5°W | 48.99 | -112.5 | 60 | -109.98 |
| NAD_1983_3TM_114 | 3776 | Canada - Alberta - 115.5°W to 112.5°W | 48.99 | -115.5 | 60 | -112.5 |
| NAD_1983_3TM_117 | 3777 | Canada - Alberta - 118.5°W to 115.5°W | 50.77 | -118.5 | 60 | -115.5 |
| NAD_1983_3TM_120 | 3801 | Canada - Alberta - west of 118.5°W | 52.88 | -120 | 60 | -118.5 |
| NAD_1983_Alaska_Albers | 3338 | USA - Alaska | 51.3 | 172.42 | 71.4 | -129.99 |
| NAD_1983_Albers_BLM_MT_ND_SD | 102399 | USA - Montana, North Dakota, and South Dakota | 44.3 | -116.1 | 49.1 | -96.3 |
| NAD_1983_BC_Environment_Albers | 3005 | Canada - British Columbia | 48.25 | -139.04 | 60.01 | -114.08 |
| NAD_1983_BLM_Zone_10N | 4430 | USA - 126°W to 120°W | 30.54 | -126 | 49.09 | -119.99 |
| NAD_1983_BLM_Zone_11N | 4431 | USA - 120°W to 114°W | 30.88 | -120 | 49.01 | -114 |
| NAD_1983_BLM_Zone_12N | 4432 | USA - 114°W to 108°W | 31.33 | -114 | 49.01 | -108 |
| NAD_1983_BLM_Zone_13N | 4433 | USA - 108°W to 102°W | 28.98 | -108 | 49.01 | -102 |
| NAD_1983_BLM_Zone_14N_ftUS | 32164 | USA - 102°W to 96°W and Gulf of Mexico OCS | 25.83 | -102 | 49.01 | -95.87 |
| NAD_1983_BLM_Zone_15N_ftUS | 32165 | USA - 96°W to 90°W and Gulf of Mexico OCS | 25.61 | -96.01 | 49.38 | -89.86 |
| NAD_1983_BLM_Zone_16N_ftUS | 32166 | USA - 90°W to 84°W and Gulf of Mexico OCS | 23.95 | -90.01 | 48.32 | -83.91 |
| NAD_1983_BLM_Zone_17N_ftUS | 32167 | USA - 84°W to 78°W and Gulf of Mexico OCS | 23.81 | -84.09 | 46.13 | -77.99 |
| NAD_1983_BLM_Zone_18N | 4438 | USA - 78°W to 72°W | 28.28 | -78 | 45.03 | -72 |
| NAD_1983_BLM_Zone_19N | 4439 | USA - 72°W to 66°W | 33.61 | -72 | 47.47 | -65.99 |
| NAD_1983_BLM_Zone_1N | 4421 | USA - 180°W to 174°W - AK, OCS | 47.88 | -180 | 63.21 | -173.99 |
| NAD_1983_BLM_Zone_2N | 4422 | USA - 174°W to 168°W - AK, OCS | 48.66 | -174 | 73.05 | -167.99 |
| NAD_1983_BLM_Zone_3N | 4423 | USA - 168°W to 162°W - AK, OCS | 49.52 | -168 | 74.29 | -161.99 |
| NAD_1983_BLM_Zone_4N | 4424 | USA - 162°W to 156°W - AK, OCS | 50.98 | -162 | 74.71 | -155.99 |
| NAD_1983_BLM_Zone_59N | 4217 | USA - west of 174°E - AK, OCS | 49.01 | 167.65 | 56.28 | 174.01 |
| NAD_1983_BLM_Zone_5N | 4425 | USA - 156°W to 150°W - AK, OCS | 52.15 | -156 | 74.71 | -149.99 |
| NAD_1983_BLM_Zone_60N | 4420 | USA - 174°E to 180°E - AK, OCS | 47.92 | 174 | 56.67 | 180 |
| NAD_1983_BLM_Zone_6N | 4426 | USA - 150°W to 144°W - AK, OCS | 54.05 | -150 | 74.13 | -143.99 |
| NAD_1983_BLM_Zone_7N | 4427 | USA - 144°W to 138°W | 53.47 | -144 | 73.59 | -137.99 |
| NAD_1983_BLM_Zone_8N | 4428 | USA - 138°W to 132°W | 53.6 | -138 | 73.04 | -131.99 |
| NAD_1983_BLM_Zone_9N | 4429 | USA - 132°W to 126°W | 35.38 | -132 | 56.84 | -126 |
| NAD_1983_California_Teale_Albers | 3310 | USA - California | 32.53 | -124.45 | 42.01 | -114.12 |
| NAD_1983_California_Teale_Albers_ Ft_Intl | 102760 | USA - California | 32.53 | -124.45 | 42.01 | -114.12 |
| NAD_1983_California_Teale_Albers_FtUS | 102600 | USA - California | 32.53 | -124.45 | 42.01 | -114.12 |
| NAD_1983_Canada_Atlas_Lambert | 3978 | Canada | 38.21 | -141.01 | 86.46 | -40.73 |
| NAD_1983_Contiguous_USA_Albers | 5070 | USA - CONUS - onshore | 24.41 | -124.79 | 49.38 | -66.91 |
| NAD_1983_CORS96_Alaska_Albers | 102247 | USA - Alaska | 51.3 | 172.42 | 71.4 | -129.99 |
| NAD_1983_CORS96_Maine_2000_Central _Zone | 103373 | USA - Maine - CS2000 - Central | 43.75 | -70.03 | 47.47 | -68.33 |
| NAD_1983_CORS96_Maine_2000_East_ Zone | 103372 | USA - Maine - CS2000 - East | 44.18 | -68.58 | 47.37 | -66.91 |
| NAD_1983_CORS96_Maine_2000_West_ Zone | 103374 | USA - Maine - CS2000 - West | 43.07 | -71.09 | 46.58 | -69.61 |
| NAD_1983_CORS96_Oregon_Statewide_ Lambert | 6867 | USA - Oregon | 41.98 | -124.6 | 46.26 | -116.47 |
| NAD_1983_CORS96_Oregon_Statewide_ Lambert_Ft_Intl | 6868 | USA - Oregon | 41.98 | -124.6 | 46.26 | -116.47 |
| NAD_1983_CORS96_SPCS_Puerto_Rico_ and_Virgin_Islands | 6307 | Caribbean - Puerto Rico and US Virgin Islands - onshore | 17.62 | -67.97 | 18.57 | -64.51 |
| NAD_1983_CORS96_StatePlane_Alabama _East_FIPS_0101 | 103220 | USA - Alabama - SPCS - E | 30.99 | -86.79 | 35 | -84.89 |
| NAD_1983_CORS96_StatePlane_Alabama _West_FIPS_0102 | 103221 | USA - Alabama - SPCS - W | 30.14 | -88.48 | 35.02 | -86.3 |
| NAD_1983_CORS96_StatePlane_Alaska_ 10_FIPS_5010 | 102375 | USA - Alaska - Aleutian Islands | 51.3 | 172.42 | 54.34 | -164.84 |
| NAD_1983_CORS96_StatePlane_Alaska_1 _FIPS_5001 | 102366 | USA - Alaska - Panhandle | 54.61 | -141 | 60.35 | -129.99 |
| NAD_1983_CORS96_StatePlane_Alaska_2 _FIPS_5002 | 102367 | USA - Alaska - 144°W to 141°W | 59.72 | -144.01 | 70.16 | -140.98 |
| NAD_1983_CORS96_StatePlane_Alaska_3 _FIPS_5003 | 102368 | USA - Alaska - 148°W to 144°W | 59.72 | -148 | 70.38 | -144 |
| NAD_1983_CORS96_StatePlane_Alaska_4 _FIPS_5004 | 102369 | USA - Alaska - 152°W to 148°W | 59.11 | -152.01 | 70.63 | -147.99 |
| NAD_1983_CORS96_StatePlane_Alaska_5 _FIPS_5005 | 102370 | USA - Alaska - 156°W to 152°W | 55.72 | -156 | 71.28 | -151.86 |
| NAD_1983_CORS96_StatePlane_Alaska_6 _FIPS_5006 | 102371 | USA - Alaska - 160°W to 156°W | 54.89 | -160 | 71.4 | -155.99 |
| NAD_1983_CORS96_StatePlane_Alaska_7 _FIPS_5007 | 102372 | USA - Alaska - 164°W to 160°W | 54.32 | -164.01 | 70.74 | -160 |
| NAD_1983_CORS96_StatePlane_Alaska_8 _FIPS_5008 | 102373 | USA - Alaska - north of 54.5°N; 168°W to 164°W | 54.34 | -168.26 | 69.05 | -164 |
| NAD_1983_CORS96_StatePlane_Alaska_9 _FIPS_5009 | 102374 | USA - Alaska - north of 54.5°N; west of 168°W | 56.49 | -173.16 | 65.82 | -168 |
| NAD_1983_CORS96_StatePlane_Arizona_ Central_FIPS_0202 | 103223 | USA - Arizona - SPCS - C | 31.33 | -113.35 | 37.01 | -110.44 |
| NAD_1983_CORS96_StatePlane_Arizona_ Central_FIPS_0202_Ft_Intl | 103226 | USA - Arizona - SPCS - C | 31.33 | -113.35 | 37.01 | -110.44 |
| NAD_1983_CORS96_StatePlane_Arizona_ East_FIPS_0201 | 103222 | USA - Arizona - SPCS - E | 31.33 | -111.71 | 37.01 | -109.04 |
| NAD_1983_CORS96_StatePlane_Arizona_ East_FIPS_0201_Ft_Intl | 103225 | USA - Arizona - SPCS - E | 31.33 | -111.71 | 37.01 | -109.04 |
| NAD_1983_CORS96_StatePlane_Arizona_ West_FIPS_0203 | 103224 | USA - Arizona - SPCS - W | 32.05 | -114.81 | 37 | -112.52 |
| NAD_1983_CORS96_StatePlane_Arizona_ West_FIPS_0203_Ft_Intl | 103227 | USA - Arizona - SPCS - W | 32.05 | -114.81 | 37 | -112.52 |
| NAD_1983_CORS96_StatePlane_Arkansas _North_FIPS_0301 | 103228 | USA - Arkansas - SPCS - N | 34.67 | -94.62 | 36.5 | -89.64 |
| NAD_1983_CORS96_StatePlane_Arkansas _North_FIPS_0301_Ft_US | 103230 | USA - Arkansas - SPCS - N | 34.67 | -94.62 | 36.5 | -89.64 |
| NAD_1983_CORS96_StatePlane_Arkansas _South_FIPS_0302 | 103229 | USA - Arkansas - SPCS - S | 33.01 | -94.48 | 35.1 | -90.4 |
| NAD_1983_CORS96_StatePlane_Arkansas _South_FIPS_0302_Ft_US | 103231 | USA - Arkansas - SPCS - S | 33.01 | -94.48 | 35.1 | -90.4 |
| NAD_1983_CORS96_StatePlane_ California_I_FIPS_0401 | 103232 | USA - California - SPCS - 1 | 39.59 | -124.45 | 42.01 | -119.99 |
| NAD_1983_CORS96_StatePlane_ California_I_FIPS_0401_Ft_US | 103238 | USA - California - SPCS - 1 | 39.59 | -124.45 | 42.01 | -119.99 |
| NAD_1983_CORS96_StatePlane_ California_II_FIPS_0402 | 103233 | USA - California - SPCS - 2 | 38.02 | -124.06 | 40.16 | -119.54 |
| NAD_1983_CORS96_StatePlane_ California_II_FIPS_0402_Ft_US | 103239 | USA - California - SPCS - 2 | 38.02 | -124.06 | 40.16 | -119.54 |
| NAD_1983_CORS96_StatePlane_ California_III_FIPS_0403 | 103234 | USA - California - SPCS - 3 | 36.73 | -123.02 | 38.71 | -117.83 |
| NAD_1983_CORS96_StatePlane_ California_III_FIPS_0403_Ft_US | 103240 | USA - California - SPCS - 3 | 36.73 | -123.02 | 38.71 | -117.83 |
| NAD_1983_CORS96_StatePlane_ California_IV_FIPS_0404 | 103235 | USA - California - SPCS - 4 | 35.78 | -122.01 | 37.58 | -115.62 |
| NAD_1983_CORS96_StatePlane_ California_IV_FIPS_0404_Ft_US | 103241 | USA - California - SPCS - 4 | 35.78 | -122.01 | 37.58 | -115.62 |
| NAD_1983_CORS96_StatePlane_ California_V_FIPS_0405 | 103236 | USA - California - SPCS83 - 5 | 32.76 | -121.42 | 35.81 | -114.12 |
| NAD_1983_CORS96_StatePlane_ California_V_FIPS_0405_Ft_US | 103242 | USA - California - SPCS83 - 5 | 32.76 | -121.42 | 35.81 | -114.12 |
| NAD_1983_CORS96_StatePlane_ California_VI_FIPS_0406 | 103237 | USA - California - SPCS - 6 | 32.53 | -118.15 | 34.08 | -114.42 |
| NAD_1983_CORS96_StatePlane_ California_VI_FIPS_0406_Ft_US | 103243 | USA - California - SPCS - 6 | 32.53 | -118.15 | 34.08 | -114.42 |
| NAD_1983_CORS96_StatePlane_Colorado _Central_FIPS_0502 | 103245 | USA - Colorado - SPCS - C | 38.14 | -109.06 | 40.09 | -102.04 |
| NAD_1983_CORS96_StatePlane_Colorado _Central_FIPS_0502_Ft_US | 103248 | USA - Colorado - SPCS - C | 38.14 | -109.06 | 40.09 | -102.04 |
| NAD_1983_CORS96_StatePlane_Colorado _North_FIPS_0501 | 103244 | USA - Colorado - SPCS - N | 39.56 | -109.06 | 41.01 | -102.04 |
| NAD_1983_CORS96_StatePlane_Colorado _North_FIPS_0501_Ft_US | 103247 | USA - Colorado - SPCS - N | 39.56 | -109.06 | 41.01 | -102.04 |
| NAD_1983_CORS96_StatePlane_Colorado _South_FIPS_0503 | 103246 | USA - Colorado - SPCS - S | 36.98 | -109.06 | 38.68 | -102.04 |
| NAD_1983_CORS96_StatePlane_Colorado _South_FIPS_0503_Ft_US | 103249 | USA - Colorado - SPCS - S | 36.98 | -109.06 | 38.68 | -102.04 |
| NAD_1983_CORS96_StatePlane_ Connecticut_FIPS_0600 | 103250 | USA - Connecticut | 40.98 | -73.73 | 42.05 | -71.78 |
| NAD_1983_CORS96_StatePlane_ Connecticut_FIPS_0600_Ft_US | 103251 | USA - Connecticut | 40.98 | -73.73 | 42.05 | -71.78 |
| NAD_1983_CORS96_StatePlane_ Delaware_FIPS_0700 | 103252 | USA - Delaware | 38.44 | -75.8 | 39.85 | -74.97 |
| NAD_1983_CORS96_StatePlane_ Delaware_FIPS_0700_Ft_US | 103253 | USA - Delaware | 38.44 | -75.8 | 39.85 | -74.97 |
| NAD_1983_CORS96_StatePlane_Florida_ East_FIPS_0901 | 103254 | USA - Florida - SPCS - E | 24.41 | -82.33 | 30.83 | -79.97 |
| NAD_1983_CORS96_StatePlane_Florida_ East_FIPS_0901_Ft_US | 103257 | USA - Florida - SPCS - E | 24.41 | -82.33 | 30.83 | -79.97 |
| NAD_1983_CORS96_StatePlane_Florida_ North_FIPS_0903 | 103256 | USA - Florida - SPCS - N | 29.21 | -87.63 | 31.01 | -82.04 |
| NAD_1983_CORS96_StatePlane_Florida_ North_FIPS_0903_Ft_US | 103259 | USA - Florida - SPCS - N | 29.21 | -87.63 | 31.01 | -82.04 |
| NAD_1983_CORS96_StatePlane_Florida_ West_FIPS_0902 | 103255 | USA - Florida - SPCS - W | 26.27 | -83.34 | 29.6 | -81.13 |
| NAD_1983_CORS96_StatePlane_Florida_ West_FIPS_0902_Ft_US | 103258 | USA - Florida - SPCS - W | 26.27 | -83.34 | 29.6 | -81.13 |
| NAD_1983_CORS96_StatePlane_Georgia_ East_FIPS_1001 | 103260 | USA - Georgia - SPCS - E | 30.36 | -83.47 | 34.68 | -80.77 |
| NAD_1983_CORS96_StatePlane_Georgia_ East_FIPS_1001_Ft_US | 103262 | USA - Georgia - SPCS - E | 30.36 | -83.47 | 34.68 | -80.77 |
| NAD_1983_CORS96_StatePlane_Georgia_ West_FIPS_1002 | 103261 | USA - Georgia - SPCS - W | 30.62 | -85.61 | 35.01 | -82.99 |
| NAD_1983_CORS96_StatePlane_Georgia_ West_FIPS_1002_Ft_US | 103263 | USA - Georgia - SPCS - W | 30.62 | -85.61 | 35.01 | -82.99 |
| NAD_1983_CORS96_StatePlane_Idaho_ Central_FIPS_1102 | 103265 | USA - Idaho - SPCS - C | 41.99 | -115.3 | 45.7 | -112.68 |
| NAD_1983_CORS96_StatePlane_Idaho_ Central_FIPS_1102_Ft_US | 103268 | USA - Idaho - SPCS - C | 41.99 | -115.3 | 45.7 | -112.68 |
| NAD_1983_CORS96_StatePlane_Idaho_ East_FIPS_1101 | 103264 | USA - Idaho - SPCS - E | 41.99 | -113.24 | 44.75 | -111.04 |
| NAD_1983_CORS96_StatePlane_Idaho_ East_FIPS_1101_Ft_US | 103267 | USA - Idaho - SPCS - E | 41.99 | -113.24 | 44.75 | -111.04 |
| NAD_1983_CORS96_StatePlane_Idaho_ West_FIPS_1103 | 103266 | USA - Idaho - SPCS - W | 41.99 | -117.24 | 49.01 | -114.32 |
| NAD_1983_CORS96_StatePlane_Idaho_ West_FIPS_1103_Ft_US | 103269 | USA - Idaho - SPCS - W | 41.99 | -117.24 | 49.01 | -114.32 |
| NAD_1983_CORS96_StatePlane_Illinois_ East_FIPS_1201 | 103270 | USA - Illinois - SPCS - E | 37.06 | -89.28 | 42.5 | -87.02 |
| NAD_1983_CORS96_StatePlane_Illinois_ East_FIPS_1201_Ft_US | 103272 | USA - Illinois - SPCS - E | 37.06 | -89.28 | 42.5 | -87.02 |
| NAD_1983_CORS96_StatePlane_Illinois_ West_FIPS_1202 | 103271 | USA - Illinois - SPCS - W | 36.98 | -91.52 | 42.51 | -88.93 |
| NAD_1983_CORS96_StatePlane_Illinois_ West_FIPS_1202_Ft_US | 103273 | USA - Illinois - SPCS - W | 36.98 | -91.52 | 42.51 | -88.93 |
| NAD_1983_CORS96_StatePlane_Indiana_ East_FIPS_1301 | 103274 | USA - Indiana - SPCS - E | 37.95 | -86.59 | 41.77 | -84.78 |
| NAD_1983_CORS96_StatePlane_Indiana_ East_FIPS_1301_Ft_US | 103276 | USA - Indiana - SPCS - E | 37.95 | -86.59 | 41.77 | -84.78 |
| NAD_1983_CORS96_StatePlane_Indiana_ West_FIPS_1302 | 103275 | USA - Indiana - SPCS - W | 37.77 | -88.06 | 41.77 | -86.24 |
| NAD_1983_CORS96_StatePlane_Indiana_ West_FIPS_1302_Ft_US | 103277 | USA - Indiana - SPCS - W | 37.77 | -88.06 | 41.77 | -86.24 |
| NAD_1983_CORS96_StatePlane_Iowa_ North_FIPS_1401 | 103278 | USA - Iowa - SPCS - N | 41.85 | -96.65 | 43.51 | -90.15 |
| NAD_1983_CORS96_StatePlane_Iowa_ North_FIPS_1401_Ft_US | 103280 | USA - Iowa - SPCS - N | 41.85 | -96.65 | 43.51 | -90.15 |
| NAD_1983_CORS96_StatePlane_Iowa_ South_FIPS_1402 | 103279 | USA - Iowa - SPCS - S | 40.37 | -96.14 | 42.04 | -90.14 |
| NAD_1983_CORS96_StatePlane_Iowa_ South_FIPS_1402_Ft_US | 103281 | USA - Iowa - SPCS - S | 40.37 | -96.14 | 42.04 | -90.14 |
| NAD_1983_CORS96_StatePlane_Kansas_ North_FIPS_1501 | 103282 | USA - Kansas - SPCS - N | 38.52 | -102.06 | 40.01 | -94.58 |
| NAD_1983_CORS96_StatePlane_Kansas_ North_FIPS_1501_Ft_US | 103284 | USA - Kansas - SPCS - N | 38.52 | -102.06 | 40.01 | -94.58 |
| NAD_1983_CORS96_StatePlane_Kansas_ South_FIPS_1502 | 103283 | USA - Kansas - SPCS - S | 36.99 | -102.05 | 38.88 | -94.6 |
| NAD_1983_CORS96_StatePlane_Kansas_ South_FIPS_1502_Ft_US | 103285 | USA - Kansas - SPCS - S | 36.99 | -102.05 | 38.88 | -94.6 |
| NAD_1983_CORS96_StatePlane_ Kentucky_FIPS_1600 | 103288 | USA - Kentucky | 36.49 | -89.57 | 39.15 | -81.95 |
| NAD_1983_CORS96_StatePlane_ Kentucky_FIPS_1600_Ft_US | 103289 | USA - Kentucky | 36.49 | -89.57 | 39.15 | -81.95 |
| NAD_1983_CORS96_StatePlane_ Kentucky_North_FIPS_1601 | 103286 | USA - Kentucky - SPCS - N | 37.71 | -85.96 | 39.15 | -82.47 |
| NAD_1983_CORS96_StatePlane_ Kentucky_North_FIPS_1601_Ft_US | 103287 | USA - Kentucky - SPCS - N | 37.71 | -85.96 | 39.15 | -82.47 |
| NAD_1983_CORS96_StatePlane_ Kentucky_South_FIPS_1602 | 103290 | USA - Kentucky - SPCS - S | 36.49 | -89.57 | 38.17 | -81.95 |
| NAD_1983_CORS96_StatePlane_ Kentucky_South_FIPS_1602_Ft_US | 103291 | USA - Kentucky - SPCS - S | 36.49 | -89.57 | 38.17 | -81.95 |
| NAD_1983_CORS96_StatePlane_ Louisiana_North_FIPS_1701 | 103292 | USA - Louisiana - SPCS - N | 30.85 | -94.05 | 33.03 | -90.86 |
| NAD_1983_CORS96_StatePlane_ Louisiana_North_FIPS_1701_Ft_US | 103294 | USA - Louisiana - SPCS - N | 30.85 | -94.05 | 33.03 | -90.86 |
| NAD_1983_CORS96_StatePlane_ Louisiana_South_FIPS_1702 | 103293 | USA - Louisiana - SPCS83 - S | 28.85 | -93.94 | 31.07 | -88.75 |
| NAD_1983_CORS96_StatePlane_ Louisiana_South_FIPS_1702_Ft_US | 103295 | USA - Louisiana - SPCS83 - S | 28.85 | -93.94 | 31.07 | -88.75 |
| NAD_1983_CORS96_StatePlane_Maine_ East_FIPS_1801 | 103296 | USA - Maine - SPCS - E | 43.88 | -70.03 | 47.47 | -66.91 |
| NAD_1983_CORS96_StatePlane_Maine_ East_FIPS_1801_Ft_US | 103298 | USA - Maine - SPCS - E | 43.88 | -70.03 | 47.47 | -66.91 |
| NAD_1983_CORS96_StatePlane_Maine_ West_FIPS_1802 | 103297 | USA - Maine - SPCS - W | 43.04 | -71.09 | 46.58 | -69.26 |
| NAD_1983_CORS96_StatePlane_Maine_ West_FIPS_1802_Ft_US | 103299 | USA - Maine - SPCS - W | 43.04 | -71.09 | 46.58 | -69.26 |
| NAD_1983_CORS96_StatePlane_ Maryland_FIPS_1900 | 103375 | USA - Maryland | 37.97 | -79.49 | 39.73 | -74.97 |
| NAD_1983_CORS96_StatePlane_ Maryland_FIPS_1900_Ft_US | 103376 | USA - Maryland | 37.97 | -79.49 | 39.73 | -74.97 |
| NAD_1983_CORS96_StatePlane_ Massachusetts_Island_FIPS_2002 | 103378 | USA - Massachusetts - SPCS - islands | 41.19 | -70.91 | 41.51 | -69.89 |
| NAD_1983_CORS96_StatePlane_ Massachusetts_Isl_FIPS_2002_FtUS | 103380 | USA - Massachusetts - SPCS - islands | 41.19 | -70.91 | 41.51 | -69.89 |
| NAD_1983_CORS96_StatePlane_ Massachusetts_Mainland_FIPS_2001 | 103377 | USA - Massachusetts - SPCS - mainland | 41.46 | -73.5 | 42.89 | -69.86 |
| NAD_1983_CORS96_StatePlane_ Massachusetts_Mnld_FIPS_2001_FtUS | 103379 | USA - Massachusetts - SPCS - mainland | 41.46 | -73.5 | 42.89 | -69.86 |
| NAD_1983_CORS96_StatePlane_ Michigan_Central_FIPS_2112 | 103382 | USA - Michigan - SPCS - C | 43.8 | -87.06 | 45.92 | -82.27 |
| NAD_1983_CORS96_StatePlane_ Michigan_Central_FIPS_2112_Ft_Intl | 103385 | USA - Michigan - SPCS - C | 43.8 | -87.06 | 45.92 | -82.27 |
| NAD_1983_CORS96_StatePlane_ Michigan_North_FIPS_2111 | 103381 | USA - Michigan - SPCS - N | 45.08 | -90.42 | 48.32 | -83.44 |
| NAD_1983_CORS96_StatePlane_ Michigan_North_FIPS_2111_Ft_Intl | 103384 | USA - Michigan - SPCS - N | 45.08 | -90.42 | 48.32 | -83.44 |
| NAD_1983_CORS96_StatePlane_ Michigan_South_FIPS_2113 | 103383 | USA - Michigan - SPCS - S | 41.69 | -87.2 | 44.22 | -82.13 |
| NAD_1983_CORS96_StatePlane_ Michigan_South_FIPS_2113_Ft_Intl | 103386 | USA - Michigan - SPCS - S | 41.69 | -87.2 | 44.22 | -82.13 |
| NAD_1983_CORS96_StatePlane_ Minnesota_Central_FIPS_2202 | 103388 | USA - Minnesota - SPCS - C | 45.28 | -96.86 | 47.48 | -92.29 |
| NAD_1983_CORS96_StatePlane_ Minnesota_Central_FIPS_2202_Ft_US | 103391 | USA - Minnesota - SPCS - C | 45.28 | -96.86 | 47.48 | -92.29 |
| NAD_1983_CORS96_StatePlane_ Minnesota_North_FIPS_2201 | 103387 | USA - Minnesota - SPCS - N | 46.64 | -97.22 | 49.38 | -89.49 |
| NAD_1983_CORS96_StatePlane_ Minnesota_North_FIPS_2201_Ft_US | 103390 | USA - Minnesota - SPCS - N | 46.64 | -97.22 | 49.38 | -89.49 |
| NAD_1983_CORS96_StatePlane_ Minnesota_South_FIPS_2203 | 103389 | USA - Minnesota - SPCS - S | 43.49 | -96.85 | 45.59 | -91.21 |
| NAD_1983_CORS96_StatePlane_ Minnesota_South_FIPS_2203_Ft_US | 103392 | USA - Minnesota - SPCS - S | 43.49 | -96.85 | 45.59 | -91.21 |
| NAD_1983_CORS96_StatePlane_ Mississippi_East_FIPS_2301 | 103393 | USA - Mississippi - SPCS - E | 30.01 | -89.97 | 35.01 | -88.09 |
| NAD_1983_CORS96_StatePlane_ Mississippi_East_FIPS_2301_Ft_US | 103395 | USA - Mississippi - SPCS - E | 30.01 | -89.97 | 35.01 | -88.09 |
| NAD_1983_CORS96_StatePlane_ Mississippi_West_FIPS_2302 | 103394 | USA - Mississippi - SPCS - W | 31 | -91.65 | 35.01 | -89.37 |
| NAD_1983_CORS96_StatePlane_ Mississippi_West_FIPS_2302_Ft_US | 103396 | USA - Mississippi - SPCS - W | 31 | -91.65 | 35.01 | -89.37 |
| NAD_1983_CORS96_StatePlane_Missouri _Central_FIPS_2402 | 103398 | USA - Missouri - SPCS - C | 36.48 | -93.79 | 40.61 | -91.41 |
| NAD_1983_CORS96_StatePlane_Missouri _East_FIPS_2401 | 103397 | USA - Missouri - SPCS - E | 35.98 | -91.97 | 40.61 | -89.1 |
| NAD_1983_CORS96_StatePlane_Missouri _West_FIPS_2403 | 103399 | USA - Missouri - SPCS - W | 36.48 | -95.77 | 40.59 | -93.48 |
| NAD_1983_CORS96_StatePlane_ Montana_FIPS_2500 | 103472 | USA - Montana | 44.35 | -116.07 | 49.01 | -104.04 |
| NAD_1983_CORS96_StatePlane_ Montana_FIPS_2500_Ft_Intl | 103473 | USA - Montana | 44.35 | -116.07 | 49.01 | -104.04 |
| NAD_1983_CORS96_StatePlane_ Nebraska_FIPS_2600 | 103474 | USA - Nebraska | 39.99 | -104.06 | 43.01 | -95.3 |
| NAD_1983_CORS96_StatePlane_ Nebraska_FIPS_2600_Ft_US | 103475 | USA - Nebraska | 39.99 | -104.06 | 43.01 | -95.3 |
| NAD_1983_CORS96_StatePlane_Nevada_ Central_FIPS_2702 | 103477 | USA - Nevada - SPCS - C | 36 | -118.19 | 41 | -114.99 |
| NAD_1983_CORS96_StatePlane_Nevada_ Central_FIPS_2702_Ft_US | 103480 | USA - Nevada - SPCS - C | 36 | -118.19 | 41 | -114.99 |
| NAD_1983_CORS96_StatePlane_Nevada_ East_FIPS_2701 | 103476 | USA - Nevada - SPCS - E | 34.99 | -117.01 | 42 | -114.03 |
| NAD_1983_CORS96_StatePlane_Nevada_ East_FIPS_2701_Ft_US | 103479 | USA - Nevada - SPCS - E | 34.99 | -117.01 | 42 | -114.03 |
| NAD_1983_CORS96_StatePlane_Nevada_ West_FIPS_2703 | 103478 | USA - Nevada - SPCS - W | 36.95 | -120 | 42 | -116.99 |
| NAD_1983_CORS96_StatePlane_Nevada_ West_FIPS_2703_Ft_US | 103481 | USA - Nevada - SPCS - W | 36.95 | -120 | 42 | -116.99 |
| NAD_1983_CORS96_StatePlane_New_ Hampshire_FIPS_2800 | 103482 | USA - New Hampshire | 42.69 | -72.56 | 45.31 | -70.63 |
| NAD_1983_CORS96_StatePlane_New_ Hampshire_FIPS_2800_Ft_US | 103483 | USA - New Hampshire | 42.69 | -72.56 | 45.31 | -70.63 |
| NAD_1983_CORS96_StatePlane_New_ Jersey_FIPS_2900 | 103484 | USA - New Jersey | 38.87 | -75.6 | 41.36 | -73.88 |
| NAD_1983_CORS96_StatePlane_New_ Jersey_FIPS_2900_Ft_US | 103485 | USA - New Jersey | 38.87 | -75.6 | 41.36 | -73.88 |
| NAD_1983_CORS96_StatePlane_New_ Mexico_Central_FIPS_3002 | 103487 | USA - New Mexico - SPCS83 - C | 31.78 | -107.73 | 37 | -104.84 |
| NAD_1983_CORS96_StatePlane_New_ Mexico_Central_FIPS_3002_Ft_US | 103490 | USA - New Mexico - SPCS83 - C | 31.78 | -107.73 | 37 | -104.84 |
| NAD_1983_CORS96_StatePlane_New_ Mexico_East_FIPS_3001 | 103486 | USA - New Mexico - SPCS - E | 32 | -105.72 | 37 | -102.99 |
| NAD_1983_CORS96_StatePlane_New_ Mexico_East_FIPS_3001_Ft_US | 103489 | USA - New Mexico - SPCS - E | 32 | -105.72 | 37 | -102.99 |
| NAD_1983_CORS96_StatePlane_New_ Mexico_West_FIPS_3003 | 103488 | USA - New Mexico - SPCS83 - W | 31.33 | -109.06 | 37 | -106.32 |
| NAD_1983_CORS96_StatePlane_New_ Mexico_West_FIPS_3003_Ft_US | 103491 | USA - New Mexico - SPCS83 - W | 31.33 | -109.06 | 37 | -106.32 |
| NAD_1983_CORS96_StatePlane_New_ York_Central_FIPS_3102 | 103493 | USA - New York - SPCS - C | 41.99 | -77.75 | 44.41 | -75.04 |
| NAD_1983_CORS96_StatePlane_New_ York_Central_FIPS_3102_Ft_US | 103497 | USA - New York - SPCS - C | 41.99 | -77.75 | 44.41 | -75.04 |
| NAD_1983_CORS96_StatePlane_New_ York_East_FIPS_3101 | 103492 | USA - New York - SPCS - E | 40.88 | -75.87 | 45.02 | -73.23 |
| NAD_1983_CORS96_StatePlane_New_ York_East_FIPS_3101_Ft_US | 103496 | USA - New York - SPCS - E | 40.88 | -75.87 | 45.02 | -73.23 |
| NAD_1983_CORS96_StatePlane_New_ York_Long_Island_FIPS_3104 | 103495 | USA - New York - SPCS - Long Island | 40.47 | -74.26 | 41.3 | -71.8 |
| NAD_1983_CORS96_StatePlane_New_ York_Long_Isl_FIPS_3104_Ft_US | 103499 | USA - New York - SPCS - Long Island | 40.47 | -74.26 | 41.3 | -71.8 |
| NAD_1983_CORS96_StatePlane_New_ York_West_FIPS_3103 | 103494 | USA - New York - SPCS - W | 41.99 | -79.77 | 43.64 | -77.36 |
| NAD_1983_CORS96_StatePlane_New_ York_West_FIPS_3103_Ft_US | 103498 | USA - New York - SPCS - W | 41.99 | -79.77 | 43.64 | -77.36 |
| NAD_1983_CORS96_StatePlane_North_ Carolina_FIPS_3200 | 103500 | USA - North Carolina | 33.83 | -84.33 | 36.59 | -75.38 |
| NAD_1983_CORS96_StatePlane_North_ Carolina_FIPS_3200_Ft_US | 103501 | USA - North Carolina | 33.83 | -84.33 | 36.59 | -75.38 |
| NAD_1983_CORS96_StatePlane_North_ Dakota_North_FIPS_3301 | 103502 | USA - North Dakota - SPCS - N | 47.15 | -104.07 | 49.01 | -96.83 |
| NAD_1983_CORS96_StatePlane_North_ Dakota_North_FIPS_3301_FtI | 103504 | USA - North Dakota - SPCS - N | 47.15 | -104.07 | 49.01 | -96.83 |
| NAD_1983_CORS96_StatePlane_North_ Dakota_South_FIPS_3302 | 103503 | USA - North Dakota - SPCS - S | 45.93 | -104.05 | 47.83 | -96.55 |
| NAD_1983_CORS96_StatePlane_North_ Dakota_South_FIPS_3302_FtI | 103505 | USA - North Dakota - SPCS - S | 45.93 | -104.05 | 47.83 | -96.55 |
| NAD_1983_CORS96_StatePlane_Ohio_ North_FIPS_3401 | 103506 | USA - Ohio - SPCS - N | 40.1 | -84.81 | 42.33 | -80.51 |
| NAD_1983_CORS96_StatePlane_Ohio_ North_FIPS_3401_Ft_US | 103508 | USA - Ohio - SPCS - N | 40.1 | -84.81 | 42.33 | -80.51 |
| NAD_1983_CORS96_StatePlane_Ohio_ South_FIPS_3402 | 103507 | USA - Ohio - SPCS - S | 38.4 | -84.83 | 40.36 | -80.7 |
| NAD_1983_CORS96_StatePlane_Ohio_ South_FIPS_3402_Ft_US | 103509 | USA - Ohio - SPCS - S | 38.4 | -84.83 | 40.36 | -80.7 |
| NAD_1983_CORS96_StatePlane_ Oklahoma_North_FIPS_3501 | 103510 | USA - Oklahoma - SPCS - N | 35.27 | -103 | 37.01 | -94.42 |
| NAD_1983_CORS96_StatePlane_ Oklahoma_North_FIPS_3501_Ft_US | 103512 | USA - Oklahoma - SPCS - N | 35.27 | -103 | 37.01 | -94.42 |
| NAD_1983_CORS96_StatePlane_ Oklahoma_South_FIPS_3502 | 103511 | USA - Oklahoma - SPCS - S | 33.62 | -100 | 35.57 | -94.42 |
| NAD_1983_CORS96_StatePlane_ Oklahoma_South_FIPS_3502_Ft_US | 103513 | USA - Oklahoma - SPCS - S | 33.62 | -100 | 35.57 | -94.42 |
| NAD_1983_CORS96_StatePlane_Oregon_ North_FIPS_3601 | 6884 | USA - Oregon - SPCS - N | 43.95 | -124.17 | 46.26 | -116.47 |
| NAD_1983_CORS96_StatePlane_Oregon_ North_FIPS_3601_Ft_Intl | 6885 | USA - Oregon - SPCS - N | 43.95 | -124.17 | 46.26 | -116.47 |
| NAD_1983_CORS96_StatePlane_Oregon_ South_FIPS_3602 | 6886 | USA - Oregon - SPCS - S | 41.98 | -124.6 | 44.56 | -116.9 |
| NAD_1983_CORS96_StatePlane_Oregon_ South_FIPS_3602_Ft_Intl | 6887 | USA - Oregon - SPCS - S | 41.98 | -124.6 | 44.56 | -116.9 |
| NAD_1983_CORS96_StatePlane_ Pennsylvania_North_FIPS_3701 | 103514 | USA - Pennsylvania - SPCS - N | 40.6 | -80.53 | 42.53 | -74.7 |
| NAD_1983_CORS96_StatePlane_ Pennsylvania_North_FIPS_3701_Ft_US | 103515 | USA - Pennsylvania - SPCS - N | 40.6 | -80.53 | 42.53 | -74.7 |
| NAD_1983_CORS96_StatePlane_ Pennsylvania_South_FIPS_3702 | 103516 | USA - Pennsylvania - SPCS - S | 39.71 | -80.53 | 41.18 | -74.72 |
| NAD_1983_CORS96_StatePlane_ Pennsylvania_South_FIPS_3702_Ft_US | 103517 | USA - Pennsylvania - SPCS - S | 39.71 | -80.53 | 41.18 | -74.72 |
| NAD_1983_CORS96_StatePlane_Rhode_ Island_FIPS_3800 | 103518 | USA - Rhode Island | 41.13 | -71.85 | 42.02 | -71.08 |
| NAD_1983_CORS96_StatePlane_Rhode_ Island_FIPS_3800_Ft_US | 103519 | USA - Rhode Island | 41.13 | -71.85 | 42.02 | -71.08 |
| NAD_1983_CORS96_StatePlane_South_ Carolina_FIPS_3900 | 103520 | USA - South Carolina | 32.05 | -83.36 | 35.21 | -78.52 |
| NAD_1983_CORS96_StatePlane_South_ Carolina_FIPS_3900_Ft_Intl | 103521 | USA - South Carolina | 32.05 | -83.36 | 35.21 | -78.52 |
| NAD_1983_CORS96_StatePlane_South_ Dakota_North_FIPS_4001 | 103522 | USA - South Dakota - SPCS - N | 44.14 | -104.07 | 45.95 | -96.45 |
| NAD_1983_CORS96_StatePlane_South_ Dakota_North_FIPS_4001_Ft_US | 103524 | USA - South Dakota - SPCS - N | 44.14 | -104.07 | 45.95 | -96.45 |
| NAD_1983_CORS96_StatePlane_South_ Dakota_South_FIPS_4002 | 103523 | USA - South Dakota - SPCS - S | 42.48 | -104.06 | 44.79 | -96.43 |
| NAD_1983_CORS96_StatePlane_South_ Dakota_South_FIPS_4002_Ft_US | 103525 | USA - South Dakota - SPCS - S | 42.48 | -104.06 | 44.79 | -96.43 |
| NAD_1983_CORS96_StatePlane_ Tennessee_FIPS_4100 | 103526 | USA - Tennessee | 34.98 | -90.31 | 36.68 | -81.65 |
| NAD_1983_CORS96_StatePlane_ Tennessee_FIPS_4100_Ft_US | 103527 | USA - Tennessee | 34.98 | -90.31 | 36.68 | -81.65 |
| NAD_1983_CORS96_StatePlane_Texas_ Central_FIPS_4203 | 103541 | USA - Texas - SPCS - C | 29.78 | -106.66 | 32.27 | -93.5 |
| NAD_1983_CORS96_StatePlane_Texas_ Central_FIPS_4203_Ft_US | 103546 | USA - Texas - SPCS - C | 29.78 | -106.66 | 32.27 | -93.5 |
| NAD_1983_CORS96_StatePlane_Texas_ North_Central_FIPS_4202 | 103540 | USA - Texas - SPCS - NC | 31.72 | -103.07 | 34.58 | -94 |
| NAD_1983_CORS96_StatePlane_Texas_ North_Central_FIPS_4202_FtUS | 103545 | USA - Texas - SPCS - NC | 31.72 | -103.07 | 34.58 | -94 |
| NAD_1983_CORS96_StatePlane_Texas_ North_FIPS_4201 | 103539 | USA - Texas - SPCS - N | 34.3 | -103.03 | 36.5 | -99.99 |
| NAD_1983_CORS96_StatePlane_Texas_ North_FIPS_4201_Ft_US | 103544 | USA - Texas - SPCS - N | 34.3 | -103.03 | 36.5 | -99.99 |
| NAD_1983_CORS96_StatePlane_Texas_ South_Central_FIPS_4204 | 103542 | USA - Texas - SPCS83 - SC | 27.78 | -105 | 30.67 | -93.76 |
| NAD_1983_CORS96_StatePlane_Texas_ South_Central_FIPS_4204_FtUS | 103547 | USA - Texas - SPCS83 - SC | 27.78 | -105 | 30.67 | -93.76 |
| NAD_1983_CORS96_StatePlane_Texas_ South_FIPS_4205 | 103543 | USA - Texas - SPCS83 - S | 25.83 | -100.2 | 28.21 | -96.85 |
| NAD_1983_CORS96_StatePlane_Texas_ South_FIPS_4205_Ft_US | 103548 | USA - Texas - SPCS83 - S | 25.83 | -100.2 | 28.21 | -96.85 |
| NAD_1983_CORS96_StatePlane_Utah_ Central_FIPS_4302 | 103550 | USA - Utah - SPCS - C | 38.49 | -114.05 | 41.08 | -109.04 |
| NAD_1983_CORS96_StatePlane_Utah_ Central_FIPS_4302_Ft_Intl | 103553 | USA - Utah - SPCS - C | 38.49 | -114.05 | 41.08 | -109.04 |
| NAD_1983_CORS96_StatePlane_Utah_ Central_FIPS_4302_Ft_US | 103556 | USA - Utah - SPCS - C | 38.49 | -114.05 | 41.08 | -109.04 |
| NAD_1983_CORS96_StatePlane_Utah_ North_FIPS_4301 | 103549 | USA - Utah - SPCS - N | 40.55 | -114.04 | 42.01 | -109.04 |
| NAD_1983_CORS96_StatePlane_Utah_ North_FIPS_4301_Ft_Intl | 103552 | USA - Utah - SPCS - N | 40.55 | -114.04 | 42.01 | -109.04 |
| NAD_1983_CORS96_StatePlane_Utah_ North_FIPS_4301_Ft_US | 103555 | USA - Utah - SPCS - N | 40.55 | -114.04 | 42.01 | -109.04 |
| NAD_1983_CORS96_StatePlane_Utah_ South_FIPS_4303 | 103551 | USA - Utah - SPCS - S | 36.99 | -114.05 | 38.58 | -109.04 |
| NAD_1983_CORS96_StatePlane_Utah_ South_FIPS_4303_Ft_Intl | 103554 | USA - Utah - SPCS - S | 36.99 | -114.05 | 38.58 | -109.04 |
| NAD_1983_CORS96_StatePlane_Utah_ South_FIPS_4303_Ft_US | 103557 | USA - Utah - SPCS - S | 36.99 | -114.05 | 38.58 | -109.04 |
| NAD_1983_CORS96_StatePlane_Vermont _FIPS_4400 | 103558 | USA - Vermont | 42.72 | -73.44 | 45.03 | -71.5 |
| NAD_1983_CORS96_StatePlane_Virginia_ North_FIPS_4501 | 103559 | USA - Virginia - SPCS - N | 37.77 | -80.06 | 39.46 | -76.51 |
| NAD_1983_CORS96_StatePlane_Virginia_ North_FIPS_4501_Ft_US | 103561 | USA - Virginia - SPCS - N | 37.77 | -80.06 | 39.46 | -76.51 |
| NAD_1983_CORS96_StatePlane_Virginia_ South_FIPS_4502 | 103560 | USA - Virginia - SPCS - S | 36.54 | -83.68 | 38.28 | -75.31 |
| NAD_1983_CORS96_StatePlane_Virginia_ South_FIPS_4502_Ft_US | 103562 | USA - Virginia - SPCS - S | 36.54 | -83.68 | 38.28 | -75.31 |
| NAD_1983_CORS96_StatePlane_ Washington_North_FIPS_4601 | 103563 | USA - Washington - SPCS83 - N | 47.08 | -124.79 | 49.05 | -117.02 |
| NAD_1983_CORS96_StatePlane_ Washington_North_FIPS_4601_Ft_US | 103565 | USA - Washington - SPCS83 - N | 47.08 | -124.79 | 49.05 | -117.02 |
| NAD_1983_CORS96_StatePlane_ Washington_South_FIPS_4602 | 103564 | USA - Washington - SPCS83 - S | 45.54 | -124.4 | 47.61 | -116.91 |
| NAD_1983_CORS96_StatePlane_ Washington_South_FIPS_4602_Ft_US | 103566 | USA - Washington - SPCS83 - S | 45.54 | -124.4 | 47.61 | -116.91 |
| NAD_1983_CORS96_StatePlane_West_ Virginia_North_FIPS_4701 | 103567 | USA - West Virginia - SPCS - N | 38.76 | -81.76 | 40.64 | -77.72 |
| NAD_1983_CORS96_StatePlane_West_ Virginia_North_FIPS_4701_FtUS | 103569 | USA - West Virginia - SPCS - N | 38.76 | -81.76 | 40.64 | -77.72 |
| NAD_1983_CORS96_StatePlane_West_ Virginia_South_FIPS_4702 | 103568 | USA - West Virginia - SPCS - S | 37.2 | -82.65 | 39.17 | -79.05 |
| NAD_1983_CORS96_StatePlane_West_ Virginia_South_FIPS_4702_FtUS | 103570 | USA - West Virginia - SPCS - S | 37.2 | -82.65 | 39.17 | -79.05 |
| NAD_1983_CORS96_StatePlane_ Wisconsin_Central_FIPS_4802 | 103572 | USA - Wisconsin - SPCS - C | 43.98 | -92.89 | 45.8 | -86.25 |
| NAD_1983_CORS96_StatePlane_ Wisconsin_Central_FIPS_4802_Ft_US | 103575 | USA - Wisconsin - SPCS - C | 43.98 | -92.89 | 45.8 | -86.25 |
| NAD_1983_CORS96_StatePlane_ Wisconsin_North_FIPS_4801 | 103571 | USA - Wisconsin - SPCS - N | 45.37 | -92.89 | 47.31 | -88.05 |
| NAD_1983_CORS96_StatePlane_ Wisconsin_North_FIPS_4801_Ft_US | 103574 | USA - Wisconsin - SPCS - N | 45.37 | -92.89 | 47.31 | -88.05 |
| NAD_1983_CORS96_StatePlane_ Wisconsin_South_FIPS_4803 | 103573 | USA - Wisconsin - SPCS - S | 42.48 | -91.43 | 44.33 | -86.95 |
| NAD_1983_CORS96_StatePlane_ Wisconsin_South_FIPS_4803_Ft_US | 103576 | USA - Wisconsin - SPCS - S | 42.48 | -91.43 | 44.33 | -86.95 |
| NAD_1983_CORS96_StatePlane_ Wyoming_East_Central_FIPS_4902 | 103578 | USA - Wyoming - SPCS - EC | 40.99 | -108.63 | 45.01 | -106 |
| NAD_1983_CORS96_StatePlane_ Wyoming_East_FIPS_4901 | 103577 | USA - Wyoming - SPCS - E | 40.99 | -106.33 | 45.01 | -104.05 |
| NAD_1983_CORS96_StatePlane_ Wyoming_East_FIPS_4901_Ft_US | 103581 | USA - Wyoming - SPCS - E | 40.99 | -106.33 | 45.01 | -104.05 |
| NAD_1983_CORS96_StatePlane_ Wyoming_E_Central_FIPS_4902_Ft_US | 103582 | USA - Wyoming - SPCS - EC | 40.99 | -108.63 | 45.01 | -106 |
| NAD_1983_CORS96_StatePlane_ Wyoming_W_Central_FIPS_4903_Ft_US | 103583 | USA - Wyoming - SPCS - WC | 40.99 | -111.06 | 45.01 | -107.5 |
| NAD_1983_CORS96_StatePlane_ Wyoming_West_Central_FIPS_4903 | 103579 | USA - Wyoming - SPCS - WC | 40.99 | -111.06 | 45.01 | -107.5 |
| NAD_1983_CORS96_StatePlane_ Wyoming_West_FIPS_4904 | 103580 | USA - Wyoming - SPCS - W | 40.99 | -111.06 | 44.67 | -109.04 |
| NAD_1983_CORS96_StatePlane_ Wyoming_West_FIPS_4904_Ft_US | 103585 | USA - Wyoming - SPCS - W | 40.99 | -111.06 | 44.67 | -109.04 |
| NAD_1983_CORS96_UTM_Zone_10N | 102410 | USA - 126°W to 120°W | 30.54 | -126 | 49.09 | -119.99 |
| NAD_1983_CORS96_UTM_Zone_11N | 102411 | USA - 120°W to 114°W | 30.88 | -120 | 49.01 | -114 |
| NAD_1983_CORS96_UTM_Zone_12N | 102412 | USA - 114°W to 108°W | 31.33 | -114 | 49.01 | -108 |
| NAD_1983_CORS96_UTM_Zone_13N | 102413 | USA - 108°W to 102°W | 28.98 | -108 | 49.01 | -102 |
| NAD_1983_CORS96_UTM_Zone_14N | 102414 | USA - 102°W to 96°W | 25.83 | -102 | 49.01 | -96 |
| NAD_1983_CORS96_UTM_Zone_15N | 102415 | USA - 96°W to 90°W | 25.61 | -96.01 | 49.38 | -90 |
| NAD_1983_CORS96_UTM_Zone_16N | 102416 | USA - 90°W to 84°W | 23.97 | -90 | 48.32 | -84 |
| NAD_1983_CORS96_UTM_Zone_17N | 102417 | USA - 84°W to 78°W | 23.81 | -84 | 46.13 | -78 |
| NAD_1983_CORS96_UTM_Zone_18N | 102418 | USA - 78°W to 72°W | 28.28 | -78 | 45.03 | -72 |
| NAD_1983_CORS96_UTM_Zone_19N | 102419 | USA - 72°W to 66°W | 33.61 | -72 | 47.47 | -65.99 |
| NAD_1983_CORS96_UTM_Zone_1N | 102401 | USA - 180°W to 174°W - AK, OCS | 47.88 | -180 | 63.21 | -173.99 |
| NAD_1983_CORS96_UTM_Zone_20N | 102043 | Caribbean - Puerto Rico and US Virgin Islands | 14.92 | -68.49 | 21.86 | -63.88 |
| NAD_1983_CORS96_UTM_Zone_2N | 102402 | USA - 174°W to 168°W - AK, OCS | 48.66 | -174 | 73.05 | -167.99 |
| NAD_1983_CORS96_UTM_Zone_3N | 102403 | USA - 168°W to 162°W - AK, OCS | 49.52 | -168 | 74.29 | -161.99 |
| NAD_1983_CORS96_UTM_Zone_4N | 102404 | USA - 168°W to 162°W - AK, OCS | 49.52 | -168 | 74.29 | -161.99 |
| NAD_1983_CORS96_UTM_Zone_59N | 102364 | USA - west of 174°E - AK, OCS | 49.01 | 167.65 | 56.28 | 174.01 |
| NAD_1983_CORS96_UTM_Zone_5N | 102405 | USA - 156°W to 150°W - AK, OCS | 52.15 | -156 | 74.71 | -149.99 |
| NAD_1983_CORS96_UTM_Zone_60N | 102365 | USA - 174°E to 180°E - AK, OCS | 47.92 | 174 | 56.67 | 180 |
| NAD_1983_CORS96_UTM_Zone_6N | 102406 | USA - 150°W to 144°W - AK, OCS | 54.05 | -150 | 74.13 | -143.99 |
| NAD_1983_CORS96_UTM_Zone_7N | 102407 | USA - 144°W to 138°W | 53.47 | -144 | 73.59 | -137.99 |
| NAD_1983_CORS96_UTM_Zone_8N | 102408 | USA - 138°W to 132°W | 53.6 | -138 | 73.04 | -131.99 |
| NAD_1983_CORS96_UTM_Zone_9N | 102409 | USA - 132°W to 126°W | 35.38 | -132 | 56.84 | -126 |
| NAD_1983_CSRS_10TM_AEP_Forest | 3402 | Canada - Alberta | 48.99 | -120 | 60 | -109.98 |
| NAD_1983_CSRS_10TM_AEP_Resource | 3403 | Canada - Alberta | 48.99 | -120 | 60 | -109.98 |
| NAD_1983_CSRS_3TM_111 | 3779 | Canada - Alberta - east of 112.5°W | 48.99 | -112.5 | 60 | -109.98 |
| NAD_1983_CSRS_3TM_114 | 3780 | Canada - Alberta - 115.5°W to 112.5°W | 48.99 | -115.5 | 60 | -112.5 |
| NAD_1983_CSRS_3TM_117 | 3781 | Canada - Alberta - 118.5°W to 115.5°W | 50.77 | -118.5 | 60 | -115.5 |
| NAD_1983_CSRS_3TM_120 | 3802 | Canada - Alberta - west of 118.5°W | 52.88 | -120 | 60 | -118.5 |
| NAD_1983_CSRS_BC_Environment_ Albers | 3153 | Canada - British Columbia | 48.25 | -139.04 | 60.01 | -114.08 |
| NAD_1983_CSRS_Canada_Atlas_Lambert | 3979 | Canada | 38.21 | -141.01 | 86.46 | -40.73 |
| NAD_1983_CSRS_EPSG_Arctic_zone_1-23 | 6098 | Arctic - 87°50'N to 82°50'N, 120°W to 60°W | 82.83 | -120 | 87.84 | -60 |
| NAD_1983_CSRS_EPSG_Arctic_zone_2-14 | 6099 | Arctic - 84°30'N to 79°30'N, 135°W to 95°W | 79.5 | -135 | 84.51 | -95 |
| NAD_1983_CSRS_EPSG_Arctic_zone_2-16 | 6100 | Arctic - 84°30'N to 79°30'N, 95°W to 55°W | 79.5 | -95 | 84.51 | -55 |
| NAD_1983_CSRS_EPSG_Arctic_zone_3-25 | 6101 | Arctic - 81°10'N to 76°10'N, 144°W to 114°W | 76.16 | -144 | 81.17 | -114 |
| NAD_1983_CSRS_EPSG_Arctic_zone_3-27 | 6102 | Arctic - 81°10'N to 76°10'N, 114°W to 84°W | 76.16 | -114 | 81.17 | -84 |
| NAD_1983_CSRS_EPSG_Arctic_zone_3-29 | 6103 | Arctic - 81°10'N to 76°10'N, Canada east of 84°W | 76.16 | -84 | 81.17 | -64.78 |
| NAD_1983_CSRS_EPSG_Arctic_zone_4-14 | 6104 | Arctic - 77°50'N to 72°50'N, 141°W to 116°W | 72.83 | -141 | 77.84 | -116 |
| NAD_1983_CSRS_EPSG_Arctic_zone_4-16 | 6105 | Arctic - 77°50'N to 72°50'N, 116°W to 91°W | 72.83 | -116 | 77.84 | -91 |
| NAD_1983_CSRS_EPSG_Arctic_zone_4-18 | 6106 | Arctic - 77°50'N to 72°50'N, 91°W to 67°W | 72.83 | -91 | 77.84 | -67 |
| NAD_1983_CSRS_EPSG_Arctic_zone_5-33 | 6107 | Arctic - 74°30'N to 69°30'N, 141°W to 121°W | 69.5 | -141 | 74.51 | -121 |
| NAD_1983_CSRS_EPSG_Arctic_zone_5-35 | 6108 | Arctic - 74°30'N to 69°30'N, 121°W to 101°W | 69.5 | -121 | 74.51 | -101 |
| NAD_1983_CSRS_EPSG_Arctic_zone_5-37 | 6109 | Arctic - 74°30'N to 69°30'N, 101°W to 81°W | 69.5 | -101 | 74.51 | -81 |
| NAD_1983_CSRS_EPSG_Arctic_zone_5-39 | 6110 | Arctic - 74°30'N to 69°30'N, 81°W to 61°W | 69.5 | -81 | 74.51 | -61 |
| NAD_1983_CSRS_EPSG_Arctic_zone_6-18 | 6111 | Arctic - 71°10'N to 66°10'N, 141°W to 122°W | 66.16 | -141 | 71.17 | -122 |
| NAD_1983_CSRS_EPSG_Arctic_zone_6-20 | 6112 | Arctic - 71°10'N to 66°10'N, 122°W to 103°W | 66.16 | -122 | 71.17 | -103 |
| NAD_1983_CSRS_EPSG_Arctic_zone_6-22 | 6113 | Arctic - 71°10'N to 66°10'N, 103°W to 84°W | 66.16 | -103 | 71.17 | -84 |
| NAD_1983_CSRS_EPSG_Arctic_zone_6-24 | 6114 | Arctic - 71°10'N to 66°10'N, 84°W to 65°W | 66.16 | -84 | 71.17 | -65 |
| NAD_1983_CSRS_MTM_1 | 26898 | Canada - Newfoundland - east of 54.5°W | 46.56 | -54.5 | 49.89 | -52.54 |
| NAD_1983_CSRS_MTM_10 | 2952 | Canada - Quebec and Ontario - MTM zone 10 | 42.26 | -81 | 62.45 | -78 |
| NAD_1983_CSRS_MTM_11 | 26891 | Canada - Ontario - MTM zone 11 | 41.67 | -83.6 | 46 | -81 |
| NAD_1983_CSRS_MTM_12 | 26892 | Canada - Ontario - MTM zone 12 | 46 | -82.5 | 55.21 | -79.5 |
| NAD_1983_CSRS_MTM_13 | 26893 | Canada - Ontario - MTM zone 13 | 46 | -85.5 | 55.59 | -82.5 |
| NAD_1983_CSRS_MTM_14 | 26894 | Canada - Ontario - 88.5°W to 85.5°W | 47.17 | -88.5 | 56.7 | -85.5 |
| NAD_1983_CSRS_MTM_15 | 26895 | Canada - Ontario - 91.5°W to 88.5°W | 47.97 | -91.5 | 56.9 | -88.5 |
| NAD_1983_CSRS_MTM_16 | 26896 | Canada - Ontario - 94.5°W to 91.5°W | 48.06 | -94.5 | 55.2 | -91.5 |
| NAD_1983_CSRS_MTM_17 | 26897 | Canada - Ontario - west of 94.5°W | 48.69 | -95.16 | 53.24 | -94.5 |
| NAD_1983_CSRS_MTM_2 | 26899 | Canada - Newfoundland and Labrador - 57.5°W to 54.5°W | 46.81 | -57.5 | 54.71 | -54.5 |
| NAD_1983_CSRS_MTM_2_SCoPQ | 2944 | Canada - Quebec - east of 57°W | 46.6 | -57 | 53.76 | -54 |
| NAD_1983_CSRS_MTM_3 | 2945 | Canada - Quebec, Newfoundland and Labrador - MTM zone 3 | 47.5 | -60 | 55.38 | -57.1 |
| NAD_1983_CSRS_MTM_4 | 2946 | Canada - Quebec and Labrador - 63°W to 60°W | 47.16 | -63 | 58.92 | -60 |
| NAD_1983_CSRS_MTM_5 | 2947 | Canada - Quebec and Labrador - 66°W to 63°W | 47.95 | -66 | 60.52 | -63 |
| NAD_1983_CSRS_MTM_6 | 2948 | Canada - Quebec and Labrador - 69°W to 66°W | 47.31 | -69 | 59 | -66 |
| NAD_1983_CSRS_MTM_7 | 2949 | Canada - Quebec - 72°W to 69°W | 45.01 | -72 | 61.8 | -69 |
| NAD_1983_CSRS_MTM_8 | 2950 | Canada - Quebec and Ontario - 75°W to 72°W | 44.98 | -75 | 62.53 | -72 |
| NAD_1983_CSRS_MTM_9 | 2951 | Canada - Quebec and Ontario - 78°W to 75°W | 43.63 | -78 | 62.65 | -75 |
| NAD_1983_(CSRS)_MTM_Nova_Scotia_4 | 8082 | Canada - Nova Scotia - east of 63°W | 44.64 | -63 | 47.08 | -59.73 |
| NAD_1983_(CSRS)_MTM_ Nova_Scotia_5 | 8083 | Canada - Nova Scotia - west of 63°W | 43.41 | -66.28 | 46.02 | -63 |
| NAD_1983_CSRS_MTQ_Lambert | 3799 | Canada - Quebec | 44.99 | -79.85 | 62.62 | -57.1 |
| NAD_1983_CSRS_New_Brunswick_Stereo graphic | 2953 | Canada - New Brunswick | 44.56 | -69.05 | 48.07 | -63.7 |
| NAD_1983_CSRS_Northwest_Territories_ Lambert | 3581 | Canada - NWT | 59.98 | -136.46 | 78.81 | -102 |
| NAD_1983_CSRS_Ontario_MNR_Lambert | 3162 | Canada - Ontario | 41.67 | -95.16 | 56.9 | -74.35 |
| NAD_1983_CSRS_Prince_Edward_Island | 2954 | Canada - Prince Edward Island | 45.9 | -64.49 | 47.09 | -61.9 |
| NAD_1983_CSRS_Quebec_Albers | 6624 | Canada - Quebec | 44.99 | -79.85 | 62.62 | -57.1 |
| NAD_1983_CSRS_Quebec_Lambert | 6622 | Canada - Quebec | 44.99 | -79.85 | 62.62 | -57.1 |
| NAD_1983_CSRS_Statistics_Canada_ Lambert | 3348 | Canada | 38.21 | -141.01 | 86.46 | -40.73 |
| NAD_1983_CSRS_Teranet_Ontario_ Lambert | 5321 | Canada - Ontario | 41.67 | -95.16 | 56.9 | -74.35 |
| NAD_1983_CSRS_UTM_Zone_10N | 3157 | Canada - 126°W to 120°W | 48.13 | -126 | 81.8 | -120 |
| NAD_1983_CSRS_UTM_Zone_11N | 2955 | Canada - 120°W to 114°W | 48.99 | -120 | 83.5 | -114 |
| NAD_1983_CSRS_UTM_Zone_12N | 2956 | Canada - 114°W to 108°W | 48.99 | -114 | 84 | -108 |
| NAD_1983_CSRS_UTM_Zone_13N | 2957 | Canada - 108°W to 102°W | 48.99 | -108 | 84 | -102 |
| NAD_1983_CSRS_UTM_Zone_14N | 3158 | Canada - 102°W to 96°W | 48.99 | -102 | 84 | -96 |
| NAD_1983_CSRS_UTM_Zone_15N | 3159 | Canada - 96°W to 90°W | 48.03 | -96 | 84 | -90 |
| NAD_1983_CSRS_UTM_Zone_16N | 3160 | Canada - 90°W to 84°W | 46.11 | -90 | 84 | -84 |
| NAD_1983_CSRS_UTM_Zone_17N | 2958 | Canada - 84°W to 78°W | 41.67 | -84 | 84 | -78 |
| NAD_1983_CSRS_UTM_Zone_18N | 2959 | Canada - 78°W to 72°W | 43.63 | -78 | 84 | -72 |
| NAD_1983_CSRS_UTM_Zone_19N | 2960 | Canada - 72°W to 66°W | 40.8 | -72 | 84 | -66 |
| NAD_1983_CSRS_UTM_Zone_20N | 2961 | Canada - 66°W to 60°W | 40.04 | -66 | 84 | -60 |
| NAD_1983_CSRS_UTM_Zone_21N | 2962 | Canada - 60°W to 54°W | 38.56 | -60 | 84 | -54 |
| NAD_1983_CSRS_UTM_Zone_22N | 3761 | Canada - 54°W to 48°W | 39.5 | -54 | 57.65 | -48 |
| NAD_1983_CSRS_UTM_Zone_23N | 9709 | Canada - 48°W to 42°W | 39.85 | -48 | 54.47 | -42 |
| NAD_1983_CSRS_UTM_Zone_24N | 9713 | Canada - east of 42°W | 45.53 | -42 | 49.53 | -40.73 |
| NAD_1983_CSRS_UTM_Zone_7N | 3154 | Canada - 144°W to 138°W | 52.05 | -141.01 | 72.53 | -138 |
| NAD_1983_CSRS_UTM_Zone_8N | 3155 | Canada - 138°W to 132°W | 48.06 | -138 | 79.42 | -132 |
| NAD_1983_CSRS_UTM_Zone_9N | 3156 | Canada - 132°W to 126°W | 46.52 | -132 | 80.93 | -126 |
| NAD_1983_(CSRS)_v6_UTM_Zone_15N | 103873 | Canada - 96~W to 90~W | 48.03 | -96 | 84 | -90 |
| NAD_1983_(CSRS)_v6_UTM_Zone_16N | 103874 | Canada - 90~W to 84~W | 46.11 | -90 | 84 | -84 |
| NAD_1983_(CSRS)_v6_UTM_Zone_17N | 103875 | Canada - 84~W to 78~W | 41.67 | -84 | 84 | -78 |
| NAD_1983_(CSRS)_v6_UTM_Zone_18N | 103876 | Canada - 78~W to 72~W | 43.63 | -78 | 84 | -72 |
| NAD_1983_(CSRS)_v6_UTM_Zone_19N | 103696 | Canada - 72°W to 66°W | 40.8 | -72 | 84 | -66 |
| NAD_1983_(CSRS)_v6_UTM_Zone_20N | 103697 | Canada - 66°W to 60°W | 40.04 | -66 | 84 | -60 |
| NAD_1983_(CSRS)_v6_UTM_Zone_21N | 103698 | Canada - 60°W to 54°W | 38.56 | -60 | 84 | -54 |
| NAD_1983_CSRS_Yukon_Albers | 3579 | Canada - Yukon | 59.99 | -141.01 | 69.7 | -123.91 |
| NAD_1983_Fargo_Ground_Coordinate_ System | 102389 | USA - North Dakota - Fargo | 46.7 | -96.93 | 47 | -96.75 |
| NAD_1983_Florida_GDL_Albers | 3086 | USA - Florida | 24.41 | -87.63 | 31.01 | -79.97 |
| NAD_1983_Georgia_Statewide_Lambert | 102604 | USA - Georgia | 30.36 | -85.61 | 35.01 | -80.77 |
| NAD_1983_Great_Lakes_and_St_ Lawrence_Albers | 3175 | North America - Great Lakes basin and St Lawrence Seaway | 40.99 | -93.17 | 52.22 | -54.75 |
| NAD_1983_Great_Lakes_Basin_Albers | 3174 | North America - Great Lakes basin | 40.99 | -93.17 | 50.74 | -74.47 |
| NAD_1983_HARN_Adj_MN_Aitkin_Feet | 103700 | USA - Minnesota | 43.49 | -97.22 | 49.38 | -89.49 |
| NAD_1983_HARN_Adj_MN_Aitkin_Meter s | 103600 | USA - Minnesota | 43.49 | -97.22 | 49.38 | -89.49 |
| NAD_1983_HARN_Adj_MN_Anoka_Feet | 103708 | USA - Minnesota | 43.49 | -97.22 | 49.38 | -89.49 |
| NAD_1983_HARN_Adj_MN_Anoka_ Meters | 103608 | USA - Minnesota | 43.49 | -97.22 | 49.38 | -89.49 |
| NAD_1983_HARN_Adj_MN_Becker_Feet | 103709 | USA - Minnesota | 43.49 | -97.22 | 49.38 | -89.49 |
| NAD_1983_HARN_Adj_MN_Becker_ Meters | 103609 | USA - Minnesota | 43.49 | -97.22 | 49.38 | -89.49 |
| NAD_1983_HARN_Adj_MN_Beltrami_ North_Feet | 103710 | USA - Minnesota | 43.49 | -97.22 | 49.38 | -89.49 |
| NAD_1983_HARN_Adj_MN_Beltrami_ North_Meters | 103610 | USA - Minnesota | 43.49 | -97.22 | 49.38 | -89.49 |
| NAD_1983_HARN_Adj_MN_Beltrami_ South_Feet | 103711 | USA - Minnesota | 43.49 | -97.22 | 49.38 | -89.49 |
| NAD_1983_HARN_Adj_MN_Beltrami_ South_Meters | 103611 | USA - Minnesota | 43.49 | -97.22 | 49.38 | -89.49 |
| NAD_1983_HARN_Adj_MN_Benton_Feet | 103712 | USA - Minnesota | 43.49 | -97.22 | 49.38 | -89.49 |
| NAD_1983_HARN_Adj_MN_Benton_ Meters | 103612 | USA - Minnesota | 43.49 | -97.22 | 49.38 | -89.49 |
| NAD_1983_HARN_Adj_MN_Big_Stone_ Feet | 103713 | USA - Minnesota | 43.49 | -97.22 | 49.38 | -89.49 |
| NAD_1983_HARN_Adj_MN_Big_Stone_ Meters | 103613 | USA - Minnesota | 43.49 | -97.22 | 49.38 | -89.49 |
| NAD_1983_HARN_Adj_MN_Blue_Earth_ Feet | 103714 | USA - Minnesota | 43.49 | -97.22 | 49.38 | -89.49 |
| NAD_1983_HARN_Adj_MN_Blue_Earth_ Meters | 103614 | USA - Minnesota | 43.49 | -97.22 | 49.38 | -89.49 |
| NAD_1983_HARN_Adj_MN_Brown_Feet | 103715 | USA - Minnesota | 43.49 | -97.22 | 49.38 | -89.49 |
| NAD_1983_HARN_Adj_MN_Brown_ Meters | 103615 | USA - Minnesota | 43.49 | -97.22 | 49.38 | -89.49 |
| NAD_1983_HARN_Adj_MN_Carlton_Feet | 103716 | USA - Minnesota | 43.49 | -97.22 | 49.38 | -89.49 |
| NAD_1983_HARN_Adj_MN_Carlton_ Meters | 103616 | USA - Minnesota | 43.49 | -97.22 | 49.38 | -89.49 |
| NAD_1983_HARN_Adj_MN_Carver_Feet | 103717 | USA - Minnesota | 43.49 | -97.22 | 49.38 | -89.49 |
| NAD_1983_HARN_Adj_MN_Carver_ Meters | 103617 | USA - Minnesota | 43.49 | -97.22 | 49.38 | -89.49 |
| NAD_1983_HARN_Adj_MN_Cass_North_ Feet | 103718 | USA - Minnesota | 43.49 | -97.22 | 49.38 | -89.49 |
| NAD_1983_HARN_Adj_MN_Cass_North_ Meters | 103618 | USA - Minnesota | 43.49 | -97.22 | 49.38 | -89.49 |
| NAD_1983_HARN_Adj_MN_Cass_South_ Feet | 103719 | USA - Minnesota | 43.49 | -97.22 | 49.38 | -89.49 |
| NAD_1983_HARN_Adj_MN_Cass_South_ Meters | 103619 | USA - Minnesota | 43.49 | -97.22 | 49.38 | -89.49 |
| NAD_1983_HARN_Adj_MN_Chippewa_ Feet | 103720 | USA - Minnesota | 43.49 | -97.22 | 49.38 | -89.49 |
| NAD_1983_HARN_Adj_MN_Chippewa_ Meters | 103620 | USA - Minnesota | 43.49 | -97.22 | 49.38 | -89.49 |
| NAD_1983_HARN_Adj_MN_Chisago_Feet | 103721 | USA - Minnesota | 43.49 | -97.22 | 49.38 | -89.49 |
| NAD_1983_HARN_Adj_MN_Chisago_ Meters | 103621 | USA - Minnesota | 43.49 | -97.22 | 49.38 | -89.49 |
| NAD_1983_HARN_Adj_MN_Clay_Feet | 103701 | USA - Minnesota | 43.49 | -97.22 | 49.38 | -89.49 |
| NAD_1983_HARN_Adj_MN_Clay_Meters | 103601 | USA - Minnesota | 43.49 | -97.22 | 49.38 | -89.49 |
| NAD_1983_HARN_Adj_MN_Clearwater_ Feet | 103702 | USA - Minnesota | 43.49 | -97.22 | 49.38 | -89.49 |
| NAD_1983_HARN_Adj_MN_Clearwater_ Meters | 103602 | USA - Minnesota | 43.49 | -97.22 | 49.38 | -89.49 |
| NAD_1983_HARN_Adj_MN_Cook_North_ Feet | 103722 | USA - Minnesota | 43.49 | -97.22 | 49.38 | -89.49 |
| NAD_1983_HARN_Adj_MN_Cook_North_ Meters | 103622 | USA - Minnesota | 43.49 | -97.22 | 49.38 | -89.49 |
| NAD_1983_HARN_Adj_MN_Cook_South_ Feet | 103723 | USA - Minnesota | 43.49 | -97.22 | 49.38 | -89.49 |
| NAD_1983_HARN_Adj_MN_Cook_South_ Meters | 103623 | USA - Minnesota | 43.49 | -97.22 | 49.38 | -89.49 |
| NAD_1983_HARN_Adj_MN_Cottonwood _Feet | 103724 | USA - Minnesota | 43.49 | -97.22 | 49.38 | -89.49 |
| NAD_1983_HARN_Adj_MN_Cottonwood _Meters | 103624 | USA - Minnesota | 43.49 | -97.22 | 49.38 | -89.49 |
| NAD_1983_HARN_Adj_MN_Crow_Wing_ Feet | 103725 | USA - Minnesota | 43.49 | -97.22 | 49.38 | -89.49 |
| NAD_1983_HARN_Adj_MN_Crow_Wing_ Meters | 103625 | USA - Minnesota | 43.49 | -97.22 | 49.38 | -89.49 |
| NAD_1983_HARN_Adj_MN_Dakota_Feet | 103726 | USA - Minnesota | 43.49 | -97.22 | 49.38 | -89.49 |
| NAD_1983_HARN_Adj_MN_Dakota_ Meters | 103626 | USA - Minnesota | 43.49 | -97.22 | 49.38 | -89.49 |
| NAD_1983_HARN_Adj_MN_Dodge_Feet | 103727 | USA - Minnesota | 43.49 | -97.22 | 49.38 | -89.49 |
| NAD_1983_HARN_Adj_MN_Dodge_ Meters | 103627 | USA - Minnesota | 43.49 | -97.22 | 49.38 | -89.49 |
| NAD_1983_HARN_Adj_MN_Douglas_Feet | 103728 | USA - Minnesota | 43.49 | -97.22 | 49.38 | -89.49 |
| NAD_1983_HARN_Adj_MN_Douglas_ Meters | 103628 | USA - Minnesota | 43.49 | -97.22 | 49.38 | -89.49 |
| NAD_1983_HARN_Adj_MN_Faribault_ Feet | 103729 | USA - Minnesota | 43.49 | -97.22 | 49.38 | -89.49 |
| NAD_1983_HARN_Adj_MN_Faribault_ Meters | 103629 | USA - Minnesota | 43.49 | -97.22 | 49.38 | -89.49 |
| NAD_1983_HARN_Adj_MN_Fillmore_ Feet | 103730 | USA - Minnesota | 43.49 | -97.22 | 49.38 | -89.49 |
| NAD_1983_HARN_Adj_MN_Fillmore_ Meters | 103630 | USA - Minnesota | 43.49 | -97.22 | 49.38 | -89.49 |
| NAD_1983_HARN_Adj_MN_Freeborn_ Feet | 103731 | USA - Minnesota | 43.49 | -97.22 | 49.38 | -89.49 |
| NAD_1983_HARN_Adj_MN_Freeborn_ Meters | 103631 | USA - Minnesota | 43.49 | -97.22 | 49.38 | -89.49 |
| NAD_1983_HARN_Adj_MN_Goodhue_ Feet | 103732 | USA - Minnesota | 43.49 | -97.22 | 49.38 | -89.49 |
| NAD_1983_HARN_Adj_MN_Goodhue_ Meters | 103632 | USA - Minnesota | 43.49 | -97.22 | 49.38 | -89.49 |
| NAD_1983_HARN_Adj_MN_Grant_Feet | 103733 | USA - Minnesota | 43.49 | -97.22 | 49.38 | -89.49 |
| NAD_1983_HARN_Adj_MN_Grant_ Meters | 103633 | USA - Minnesota | 43.49 | -97.22 | 49.38 | -89.49 |
| NAD_1983_HARN_Adj_MN_Hennepin_ Feet | 103734 | USA - Minnesota | 43.49 | -97.22 | 49.38 | -89.49 |
| NAD_1983_HARN_Adj_MN_Hennepin_ Meters | 103634 | USA - Minnesota | 43.49 | -97.22 | 49.38 | -89.49 |
| NAD_1983_HARN_Adj_MN_Houston_ Feet | 103735 | USA - Minnesota | 43.49 | -97.22 | 49.38 | -89.49 |
| NAD_1983_HARN_Adj_MN_Houston_ Meters | 103635 | USA - Minnesota | 43.49 | -97.22 | 49.38 | -89.49 |
| NAD_1983_HARN_Adj_MN_Hubbard_ Feet | 103703 | USA - Minnesota | 43.49 | -97.22 | 49.38 | -89.49 |
| NAD_1983_HARN_Adj_MN_Hubbard_ Meters | 103603 | USA - Minnesota | 43.49 | -97.22 | 49.38 | -89.49 |
| NAD_1983_HARN_Adj_MN_Isanti_Feet | 103736 | USA - Minnesota | 43.49 | -97.22 | 49.38 | -89.49 |
| NAD_1983_HARN_Adj_MN_Isanti_ Meters | 103636 | USA - Minnesota | 43.49 | -97.22 | 49.38 | -89.49 |
| NAD_1983_HARN_Adj_MN_Itasca_North _Feet | 103737 | USA - Minnesota | 43.49 | -97.22 | 49.38 | -89.49 |
| NAD_1983_HARN_Adj_MN_Itasca_North _Meters | 103637 | USA - Minnesota | 43.49 | -97.22 | 49.38 | -89.49 |
| NAD_1983_HARN_Adj_MN_Itasca_South _Feet | 103738 | USA - Minnesota | 43.49 | -97.22 | 49.38 | -89.49 |
| NAD_1983_HARN_Adj_MN_Itasca_South _Meters | 103638 | USA - Minnesota | 43.49 | -97.22 | 49.38 | -89.49 |
| NAD_1983_HARN_Adj_MN_Jackson_Feet | 103739 | USA - Minnesota | 43.49 | -97.22 | 49.38 | -89.49 |
| NAD_1983_HARN_Adj_MN_Jackson_ Meters | 103639 | USA - Minnesota | 43.49 | -97.22 | 49.38 | -89.49 |
| NAD_1983_HARN_Adj_MN_Kanabec_ Feet | 103740 | USA - Minnesota | 43.49 | -97.22 | 49.38 | -89.49 |
| NAD_1983_HARN_Adj_MN_Kanabec_ Meters | 103640 | USA - Minnesota | 43.49 | -97.22 | 49.38 | -89.49 |
| NAD_1983_HARN_Adj_MN_Kandiyohi_ Feet | 103741 | USA - Minnesota | 43.49 | -97.22 | 49.38 | -89.49 |
| NAD_1983_HARN_Adj_MN_Kandiyohi_ Meters | 103641 | USA - Minnesota | 43.49 | -97.22 | 49.38 | -89.49 |
| NAD_1983_HARN_Adj_MN_Kittson_Feet | 103742 | USA - Minnesota | 43.49 | -97.22 | 49.38 | -89.49 |
| NAD_1983_HARN_Adj_MN_Kittson_ Meters | 103642 | USA - Minnesota | 43.49 | -97.22 | 49.38 | -89.49 |
| NAD_1983_HARN_Adj_MN_Koochiching_ Feet | 103743 | USA - Minnesota | 43.49 | -97.22 | 49.38 | -89.49 |
| NAD_1983_HARN_Adj_MN_Koochiching_ Meters | 103643 | USA - Minnesota | 43.49 | -97.22 | 49.38 | -89.49 |
| NAD_1983_HARN_Adj_MN_Lac_Qui_ Parle_Feet | 103744 | USA - Minnesota | 43.49 | -97.22 | 49.38 | -89.49 |
| NAD_1983_HARN_Adj_MN_Lac_Qui_ Parle_Meters | 103644 | USA - Minnesota | 43.49 | -97.22 | 49.38 | -89.49 |
| NAD_1983_HARN_Adj_MN_Lake_Feet | 103704 | USA - Minnesota | 43.49 | -97.22 | 49.38 | -89.49 |
| NAD_1983_HARN_Adj_MN_Lake_Meters | 103604 | USA - Minnesota | 43.49 | -97.22 | 49.38 | -89.49 |
| NAD_1983_HARN_Adj_MN_Lake_of_the_ Woods_North_Feet | 103745 | USA - Minnesota | 43.49 | -97.22 | 49.38 | -89.49 |
| NAD_1983_HARN_Adj_MN_Lake_of_the_ Woods_North_Meters | 103645 | USA - Minnesota | 43.49 | -97.22 | 49.38 | -89.49 |
| NAD_1983_HARN_Adj_MN_Lake_of_the_ Woods_South_Feet | 103746 | USA - Minnesota | 43.49 | -97.22 | 49.38 | -89.49 |
| NAD_1983_HARN_Adj_MN_Lake_of_the_ Woods_South_Meters | 103646 | USA - Minnesota | 43.49 | -97.22 | 49.38 | -89.49 |
| NAD_1983_HARN_Adj_MN_Le_Sueur_ Feet | 103747 | USA - Minnesota | 43.49 | -97.22 | 49.38 | -89.49 |
| NAD_1983_HARN_Adj_MN_Le_Sueur_ Meters | 103647 | USA - Minnesota | 43.49 | -97.22 | 49.38 | -89.49 |
| NAD_1983_HARN_Adj_MN_Lincoln_Feet | 103748 | USA - Minnesota | 43.49 | -97.22 | 49.38 | -89.49 |
| NAD_1983_HARN_Adj_MN_Lincoln_ Meters | 103648 | USA - Minnesota | 43.49 | -97.22 | 49.38 | -89.49 |
| NAD_1983_HARN_Adj_MN_Lyon_Feet | 103749 | USA - Minnesota | 43.49 | -97.22 | 49.38 | -89.49 |
| NAD_1983_HARN_Adj_MN_Lyon_Meters | 103649 | USA - Minnesota | 43.49 | -97.22 | 49.38 | -89.49 |
| NAD_1983_HARN_Adj_MN_Mahnomen_ Feet | 103751 | USA - Minnesota | 43.49 | -97.22 | 49.38 | -89.49 |
| NAD_1983_HARN_Adj_MN_Mahnomen_ Meters | 103651 | USA - Minnesota | 43.49 | -97.22 | 49.38 | -89.49 |
| NAD_1983_HARN_Adj_MN_Marshall_ Feet | 103752 | USA - Minnesota | 43.49 | -97.22 | 49.38 | -89.49 |
| NAD_1983_HARN_Adj_MN_Marshall_ Meters | 103652 | USA - Minnesota | 43.49 | -97.22 | 49.38 | -89.49 |
| NAD_1983_HARN_Adj_MN_Martin_Feet | 103753 | USA - Minnesota | 43.49 | -97.22 | 49.38 | -89.49 |
| NAD_1983_HARN_Adj_MN_Martin_ Meters | 103653 | USA - Minnesota | 43.49 | -97.22 | 49.38 | -89.49 |
| NAD_1983_HARN_Adj_MN_McLeod_Feet | 103750 | USA - Minnesota | 43.49 | -97.22 | 49.38 | -89.49 |
| NAD_1983_HARN_Adj_MN_McLeod_ Meters | 103650 | USA - Minnesota | 43.49 | -97.22 | 49.38 | -89.49 |
| NAD_1983_HARN_Adj_MN_Meeker_Feet | 103754 | USA - Minnesota | 43.49 | -97.22 | 49.38 | -89.49 |
| NAD_1983_HARN_Adj_MN_Meeker_ Meters | 103654 | USA - Minnesota | 43.49 | -97.22 | 49.38 | -89.49 |
| NAD_1983_HARN_Adj_MN_Mille_Lacs_ Feet | 103705 | USA - Minnesota | 43.49 | -97.22 | 49.38 | -89.49 |
| NAD_1983_HARN_Adj_MN_Mille_Lacs_ Meters | 103605 | USA - Minnesota | 43.49 | -97.22 | 49.38 | -89.49 |
| NAD_1983_HARN_Adj_MN_Morrison_ Feet | 103755 | USA - Minnesota | 43.49 | -97.22 | 49.38 | -89.49 |
| NAD_1983_HARN_Adj_MN_Morrison_ Meters | 103655 | USA - Minnesota | 43.49 | -97.22 | 49.38 | -89.49 |
| NAD_1983_HARN_Adj_MN_Mower_Feet | 103756 | USA - Minnesota | 43.49 | -97.22 | 49.38 | -89.49 |
| NAD_1983_HARN_Adj_MN_Mower_ Meters | 103656 | USA - Minnesota | 43.49 | -97.22 | 49.38 | -89.49 |
| NAD_1983_HARN_Adj_MN_Murray_Feet | 103757 | USA - Minnesota | 43.49 | -97.22 | 49.38 | -89.49 |
| NAD_1983_HARN_Adj_MN_Murray_ Meters | 103657 | USA - Minnesota | 43.49 | -97.22 | 49.38 | -89.49 |
| NAD_1983_HARN_Adj_MN_Nicollet_Feet | 103758 | USA - Minnesota | 43.49 | -97.22 | 49.38 | -89.49 |
| NAD_1983_HARN_Adj_MN_Nicollet_ Meters | 103658 | USA - Minnesota | 43.49 | -97.22 | 49.38 | -89.49 |
| NAD_1983_HARN_Adj_MN_Nobles_Feet | 103759 | USA - Minnesota | 43.49 | -97.22 | 49.38 | -89.49 |
| NAD_1983_HARN_Adj_MN_Nobles_ Meters | 103659 | USA - Minnesota | 43.49 | -97.22 | 49.38 | -89.49 |
| NAD_1983_HARN_Adj_MN_Norman_ Feet | 103760 | USA - Minnesota | 43.49 | -97.22 | 49.38 | -89.49 |
| NAD_1983_HARN_Adj_MN_Norman_ Meters | 103660 | USA - Minnesota | 43.49 | -97.22 | 49.38 | -89.49 |
| NAD_1983_HARN_Adj_MN_Olmsted_ Feet | 103761 | USA - Minnesota | 43.49 | -97.22 | 49.38 | -89.49 |
| NAD_1983_HARN_Adj_MN_Olmsted_ Meters | 103661 | USA - Minnesota | 43.49 | -97.22 | 49.38 | -89.49 |
| NAD_1983_HARN_Adj_MN_Ottertail_ Feet | 103762 | USA - Minnesota | 43.49 | -97.22 | 49.38 | -89.49 |
| NAD_1983_HARN_Adj_MN_Ottertail_ Meters | 103662 | USA - Minnesota | 43.49 | -97.22 | 49.38 | -89.49 |
| NAD_1983_HARN_Adj_MN_Pennington_ Feet | 103763 | USA - Minnesota | 43.49 | -97.22 | 49.38 | -89.49 |
| NAD_1983_HARN_Adj_MN_Pennington_ Meters | 103663 | USA - Minnesota | 43.49 | -97.22 | 49.38 | -89.49 |
| NAD_1983_HARN_Adj_MN_Pine_Feet | 103764 | USA - Minnesota | 43.49 | -97.22 | 49.38 | -89.49 |
| NAD_1983_HARN_Adj_MN_Pine_Meters | 103664 | USA - Minnesota | 43.49 | -97.22 | 49.38 | -89.49 |
| NAD_1983_HARN_Adj_MN_Pipestone_ Feet | 103765 | USA - Minnesota | 43.49 | -97.22 | 49.38 | -89.49 |
| NAD_1983_HARN_Adj_MN_Pipestone_ Meters | 103665 | USA - Minnesota | 43.49 | -97.22 | 49.38 | -89.49 |
| NAD_1983_HARN_Adj_MN_Polk_Feet | 103766 | USA - Minnesota | 43.49 | -97.22 | 49.38 | -89.49 |
| NAD_1983_HARN_Adj_MN_Polk_Meters | 103666 | USA - Minnesota | 43.49 | -97.22 | 49.38 | -89.49 |
| NAD_1983_HARN_Adj_MN_Pope_Feet | 103767 | USA - Minnesota | 43.49 | -97.22 | 49.38 | -89.49 |
| NAD_1983_HARN_Adj_MN_Pope_Meters | 103667 | USA - Minnesota | 43.49 | -97.22 | 49.38 | -89.49 |
| NAD_1983_HARN_Adj_MN_Ramsey_Feet | 103768 | USA - Minnesota | 43.49 | -97.22 | 49.38 | -89.49 |
| NAD_1983_HARN_Adj_MN_Ramsey_ Meters | 103668 | USA - Minnesota | 43.49 | -97.22 | 49.38 | -89.49 |
| NAD_1983_HARN_Adj_MN_Red_Lake_ Feet | 103769 | USA - Minnesota | 43.49 | -97.22 | 49.38 | -89.49 |
| NAD_1983_HARN_Adj_MN_Red_Lake_ Meters | 103669 | USA - Minnesota | 43.49 | -97.22 | 49.38 | -89.49 |
| NAD_1983_HARN_Adj_MN_Redwood_ Feet | 103770 | USA - Minnesota | 43.49 | -97.22 | 49.38 | -89.49 |
| NAD_1983_HARN_Adj_MN_Redwood_ Meters | 103670 | USA - Minnesota | 43.49 | -97.22 | 49.38 | -89.49 |
| NAD_1983_HARN_Adj_MN_Renville_Feet | 103771 | USA - Minnesota | 43.49 | -97.22 | 49.38 | -89.49 |
| NAD_1983_HARN_Adj_MN_Renville_ Meters | 103671 | USA - Minnesota | 43.49 | -97.22 | 49.38 | -89.49 |
| NAD_1983_HARN_Adj_MN_Rice_Feet | 103772 | USA - Minnesota | 43.49 | -97.22 | 49.38 | -89.49 |
| NAD_1983_HARN_Adj_MN_Rice_Meters | 103672 | USA - Minnesota | 43.49 | -97.22 | 49.38 | -89.49 |
| NAD_1983_HARN_Adj_MN_Rock_Feet | 103773 | USA - Minnesota | 43.49 | -97.22 | 49.38 | -89.49 |
| NAD_1983_HARN_Adj_MN_Rock_Meters | 103673 | USA - Minnesota | 43.49 | -97.22 | 49.38 | -89.49 |
| NAD_1983_HARN_Adj_MN_Roseau_Feet | 103774 | USA - Minnesota | 43.49 | -97.22 | 49.38 | -89.49 |
| NAD_1983_HARN_Adj_MN_Roseau_ Meters | 103674 | USA - Minnesota | 43.49 | -97.22 | 49.38 | -89.49 |
| NAD_1983_HARN_Adj_MN_Scott_Feet | 103778 | USA - Minnesota | 43.49 | -97.22 | 49.38 | -89.49 |
| NAD_1983_HARN_Adj_MN_Scott_Meters | 103678 | USA - Minnesota | 43.49 | -97.22 | 49.38 | -89.49 |
| NAD_1983_HARN_Adj_MN_Sherburne_ Feet | 103779 | USA - Minnesota | 43.49 | -97.22 | 49.38 | -89.49 |
| NAD_1983_HARN_Adj_MN_Sherburne_ Meters | 103679 | USA - Minnesota | 43.49 | -97.22 | 49.38 | -89.49 |
| NAD_1983_HARN_Adj_MN_Sibley_Feet | 103780 | USA - Minnesota | 43.49 | -97.22 | 49.38 | -89.49 |
| NAD_1983_HARN_Adj_MN_Sibley_ Meters | 103680 | USA - Minnesota | 43.49 | -97.22 | 49.38 | -89.49 |
| NAD_1983_HARN_Adj_MN_Stearns_Feet | 103781 | USA - Minnesota | 43.49 | -97.22 | 49.38 | -89.49 |
| NAD_1983_HARN_Adj_MN_Stearns_ Meters | 103681 | USA - Minnesota | 43.49 | -97.22 | 49.38 | -89.49 |
| NAD_1983_HARN_Adj_MN_Steele_Feet | 103782 | USA - Minnesota | 43.49 | -97.22 | 49.38 | -89.49 |
| NAD_1983_HARN_Adj_MN_Steele_ Meters | 103682 | USA - Minnesota | 43.49 | -97.22 | 49.38 | -89.49 |
| NAD_1983_HARN_Adj_MN_Stevens_Feet | 103783 | USA - Minnesota | 43.49 | -97.22 | 49.38 | -89.49 |
| NAD_1983_HARN_Adj_MN_Stevens_ Meters | 103683 | USA - Minnesota | 43.49 | -97.22 | 49.38 | -89.49 |
| NAD_1983_HARN_Adj_MN_St_Louis_ Central_Feet | 103776 | USA - Minnesota | 43.49 | -97.22 | 49.38 | -89.49 |
| NAD_1983_HARN_Adj_MN_St_Louis_ Central_Meters | 103676 | USA - Minnesota | 43.49 | -97.22 | 49.38 | -89.49 |
| NAD_1983_HARN_Adj_MN_St_Louis_ CS96_Feet | 103695 | USA - Minnesota | 43.49 | -97.22 | 49.38 | -89.49 |
| NAD_1983_HARN_Adj_MN_St_Louis_ CS96_Meters | 103694 | USA - Minnesota | 43.49 | -97.22 | 49.38 | -89.49 |
| NAD_1983_HARN_Adj_MN_St_Louis_ North_Feet | 103775 | USA - Minnesota | 43.49 | -97.22 | 49.38 | -89.49 |
| NAD_1983_HARN_Adj_MN_St_Louis_ North_Meters | 103675 | USA - Minnesota | 43.49 | -97.22 | 49.38 | -89.49 |
| NAD_1983_HARN_Adj_MN_St_Louis_ South_Feet | 103777 | USA - Minnesota | 43.49 | -97.22 | 49.38 | -89.49 |
| NAD_1983_HARN_Adj_MN_St_Louis_ South_Meters | 103677 | USA - Minnesota | 43.49 | -97.22 | 49.38 | -89.49 |
| NAD_1983_HARN_Adj_MN_Swift_Feet | 103784 | USA - Minnesota | 43.49 | -97.22 | 49.38 | -89.49 |
| NAD_1983_HARN_Adj_MN_Swift_Meters | 103684 | USA - Minnesota | 43.49 | -97.22 | 49.38 | -89.49 |
| NAD_1983_HARN_Adj_MN_Todd_Feet | 103785 | USA - Minnesota | 43.49 | -97.22 | 49.38 | -89.49 |
| NAD_1983_HARN_Adj_MN_Todd_Meters | 103685 | USA - Minnesota | 43.49 | -97.22 | 49.38 | -89.49 |
| NAD_1983_HARN_Adj_MN_Traverse_ Feet | 103786 | USA - Minnesota | 43.49 | -97.22 | 49.38 | -89.49 |
| NAD_1983_HARN_Adj_MN_Traverse_ Meters | 103686 | USA - Minnesota | 43.49 | -97.22 | 49.38 | -89.49 |
| NAD_1983_HARN_Adj_MN_Wabasha_ Feet | 103787 | USA - Minnesota | 43.49 | -97.22 | 49.38 | -89.49 |
| NAD_1983_HARN_Adj_MN_Wabasha_ Meters | 103687 | USA - Minnesota | 43.49 | -97.22 | 49.38 | -89.49 |
| NAD_1983_HARN_Adj_MN_Wadena_ Feet | 103788 | USA - Minnesota | 43.49 | -97.22 | 49.38 | -89.49 |
| NAD_1983_HARN_Adj_MN_Wadena_ Meters | 103688 | USA - Minnesota | 43.49 | -97.22 | 49.38 | -89.49 |
| NAD_1983_HARN_Adj_MN_Waseca_ Feet | 103789 | USA - Minnesota | 43.49 | -97.22 | 49.38 | -89.49 |
| NAD_1983_HARN_Adj_MN_Waseca_ Meters | 103689 | USA - Minnesota | 43.49 | -97.22 | 49.38 | -89.49 |
| NAD_1983_HARN_Adj_MN_Washington_ Feet | 103706 | USA - Minnesota | 43.49 | -97.22 | 49.38 | -89.49 |
| NAD_1983_HARN_Adj_MN_Washington_ Meters | 103606 | USA - Minnesota | 43.49 | -97.22 | 49.38 | -89.49 |
| NAD_1983_HARN_Adj_MN_Watonwan_ Feet | 103790 | USA - Minnesota | 43.49 | -97.22 | 49.38 | -89.49 |
| NAD_1983_HARN_Adj_MN_Watonwan_ Meters | 103690 | USA - Minnesota | 43.49 | -97.22 | 49.38 | -89.49 |
| NAD_1983_HARN_Adj_MN_Wilkin_Feet | 103707 | USA - Minnesota | 43.49 | -97.22 | 49.38 | -89.49 |
| NAD_1983_HARN_Adj_MN_Wilkin_ Meters | 103607 | USA - Minnesota | 43.49 | -97.22 | 49.38 | -89.49 |
| NAD_1983_HARN_Adj_MN_Winona_Feet | 103791 | USA - Minnesota | 43.49 | -97.22 | 49.38 | -89.49 |
| NAD_1983_HARN_Adj_MN_Winona_ Meters | 103691 | USA - Minnesota | 43.49 | -97.22 | 49.38 | -89.49 |
| NAD_1983_HARN_Adj_MN_Wright_Feet | 103792 | USA - Minnesota | 43.49 | -97.22 | 49.38 | -89.49 |
| NAD_1983_HARN_Adj_MN_Wright_ Meters | 103692 | USA - Minnesota | 43.49 | -97.22 | 49.38 | -89.49 |
| NAD_1983_HARN_Adj_MN_Yellow_ Medicine_Feet | 103793 | USA - Minnesota | 43.49 | -97.22 | 49.38 | -89.49 |
| NAD_1983_HARN_Adj_MN_Yellow_ Medicine_Meters | 103693 | USA - Minnesota | 43.49 | -97.22 | 49.38 | -89.49 |
| NAD_1983_HARN_Adj_WI_Chippewa_ Feet | 103946 | USA - Wisconsin | 42.48 | -92.89 | 47.31 | -86.25 |
| NAD_1983_HARN_Adj_WI_Chippewa_ Meters | 103846 | USA - Wisconsin | 42.48 | -92.89 | 47.31 | -86.25 |
| NAD_1983_HARN_California_Teale_ Albers | 3311 | USA - California | 32.53 | -124.45 | 42.01 | -114.12 |
| NAD_1983_HARN_Contiguous_USA_ Albers | 5071 | USA - CONUS - onshore | 24.41 | -124.79 | 49.38 | -66.91 |
| NAD_1983_HARN_Fargo_Ground_ Coordinate_System | 102390 | USA - North Dakota - Fargo | 46.7 | -96.93 | 47 | -96.75 |
| NAD_1983_HARN_Florida_GDL_Albers | 3087 | USA - Florida | 24.41 | -87.63 | 31.01 | -79.97 |
| NAD_1983_HARN_Guam_Map_Grid | 4414 | Guam - onshore | 13.18 | 144.58 | 13.7 | 145.01 |
| NAD_1983_HARN_Maine_2000_Central_ Zone | 3464 | USA - Maine - CS2000 - C | 43.75 | -70.03 | 47.47 | -68.33 |
| NAD_1983_HARN_Maine_2000_East_ Zone | 3075 | USA - Maine - CS2000 - E | 44.18 | -68.58 | 47.37 | -66.91 |
| NAD_1983_HARN_Maine_2000_West_ Zone | 3077 | USA - Maine - CS2000 - W | 43.07 | -71.09 | 46.58 | -69.61 |
| NAD_1983_HARN_Michigan_GeoRef_ Meters | 3079 | USA - Michigan | 41.69 | -90.42 | 48.32 | -82.13 |
| NAD_1983_HARN_Mississippi_TM | 3815 | USA - Mississippi | 30.01 | -91.65 | 35.01 | -88.09 |
| NAD_1983_HARN_Navajo_Nation_ Coordinate_System_Meters | 103586 | Navajo Nation | 32.8 | -114.04 | 37.75 | -106.17 |
| NAD_1983_HARN_Navajo_Nation_ Coordinate_System_US_Feet | 103587 | Navajo Nation | 32.8 | -114.04 | 37.75 | -106.17 |
| NAD_1983_HARN_Navajo_Nation_ Coordinate_System_Intl_Feet | 103588 | Navajo Nation | 32.8 | -114.04 | 37.75 | -106.17 |
| NAD_1983_HARN_Oregon_Statewide_ Lambert | 2993 | USA - Oregon | 41.98 | -124.6 | 46.26 | -116.47 |
| NAD_1983_HARN_Oregon_Statewide_ Lambert_Feet_Intl | 2994 | USA - Oregon | 41.98 | -124.6 | 46.26 | -116.47 |
| NAD_1983_HARN_StatePlane_Alabama_ East_FIPS_0101 | 2759 | USA - Alabama - SPCS - E | 30.99 | -86.79 | 35 | -84.89 |
| NAD_1983_HARN_StatePlane_Alabama_ West_FIPS_0102 | 2760 | USA - Alabama - SPCS - W | 30.14 | -88.48 | 35.02 | -86.3 |
| NAD_1983_HARN_StatePlane_Arizona_ Central_FIPS_0202 | 2762 | USA - Arizona - SPCS - C | 31.33 | -113.35 | 37.01 | -110.44 |
| NAD_1983_HARN_StatePlane_Arizona_ Central_FIPS_0202_Feet_Intl | 2868 | USA - Arizona - SPCS - C | 31.33 | -113.35 | 37.01 | -110.44 |
| NAD_1983_HARN_StatePlane_Arizona_ East_FIPS_0201 | 2761 | USA - Arizona - SPCS - E | 31.33 | -111.71 | 37.01 | -109.04 |
| NAD_1983_HARN_StatePlane_Arizona_ East_FIPS_0201_Feet_Intl | 2867 | USA - Arizona - SPCS - E | 31.33 | -111.71 | 37.01 | -109.04 |
| NAD_1983_HARN_StatePlane_Arizona_ West_FIPS_0203 | 2763 | USA - Arizona - SPCS - W | 32.05 | -114.81 | 37 | -112.52 |
| NAD_1983_HARN_StatePlane_Arizona_ West_FIPS_0203_Feet_Intl | 2869 | USA - Arizona - SPCS - W | 32.05 | -114.81 | 37 | -112.52 |
| NAD_1983_HARN_StatePlane_Arkansas_ North_FIPS_0301 | 2764 | USA - Arkansas - SPCS - N | 34.67 | -94.62 | 36.5 | -89.64 |
| NAD_1983_HARN_StatePlane_Arkansas_ North_FIPS_0301_Feet | 3441 | USA - Arkansas - SPCS - N | 34.67 | -94.62 | 36.5 | -89.64 |
| NAD_1983_HARN_StatePlane_Arkansas_ South_FIPS_0302 | 2765 | USA - Arkansas - SPCS - S | 33.01 | -94.48 | 35.1 | -90.4 |
| NAD_1983_HARN_StatePlane_Arkansas_ South_FIPS_0302_Feet | 3442 | USA - Arkansas - SPCS - S | 33.01 | -94.48 | 35.1 | -90.4 |
| NAD_1983_HARN_StatePlane_California_ I_FIPS_0401 | 2766 | USA - California - SPCS - 1 | 39.59 | -124.45 | 42.01 | -119.99 |
| NAD_1983_HARN_StatePlane_California_ I_FIPS_0401_Feet | 2870 | USA - California - SPCS - 1 | 39.59 | -124.45 | 42.01 | -119.99 |
| NAD_1983_HARN_StatePlane_California_ II_FIPS_0402 | 2767 | USA - California - SPCS - 2 | 38.02 | -124.06 | 40.16 | -119.54 |
| NAD_1983_HARN_StatePlane_California_ II_FIPS_0402_Feet | 2871 | USA - California - SPCS - 2 | 38.02 | -124.06 | 40.16 | -119.54 |
| NAD_1983_HARN_StatePlane_California_ III_FIPS_0403 | 2768 | USA - California - SPCS - 3 | 36.73 | -123.02 | 38.71 | -117.83 |
| NAD_1983_HARN_StatePlane_California_ III_FIPS_0403_Feet | 2872 | USA - California - SPCS - 3 | 36.73 | -123.02 | 38.71 | -117.83 |
| NAD_1983_HARN_StatePlane_California_ IV_FIPS_0404 | 2769 | USA - California - SPCS - 4 | 35.78 | -122.01 | 37.58 | -115.62 |
| NAD_1983_HARN_StatePlane_California_ IV_FIPS_0404_Feet | 2873 | USA - California - SPCS - 4 | 35.78 | -122.01 | 37.58 | -115.62 |
| NAD_1983_HARN_StatePlane_California_ V_FIPS_0405 | 2770 | USA - California - SPCS83 - 5 | 32.76 | -121.42 | 35.81 | -114.12 |
| NAD_1983_HARN_StatePlane_California_ V_FIPS_0405_Feet | 2874 | USA - California - SPCS83 - 5 | 32.76 | -121.42 | 35.81 | -114.12 |
| NAD_1983_HARN_StatePlane_California_ VI_FIPS_0406 | 2771 | USA - California - SPCS - 6 | 32.53 | -118.15 | 34.08 | -114.42 |
| NAD_1983_HARN_StatePlane_California_ VI_FIPS_0406_Feet | 2875 | USA - California - SPCS - 6 | 32.53 | -118.15 | 34.08 | -114.42 |
| NAD_1983_HARN_StatePlane_Colorado_ Central_FIPS_0502 | 2773 | USA - Colorado - SPCS - C | 38.14 | -109.06 | 40.09 | -102.04 |
| NAD_1983_HARN_StatePlane_Colorado_ Central_FIPS_0502_Feet | 2877 | USA - Colorado - SPCS - C | 38.14 | -109.06 | 40.09 | -102.04 |
| NAD_1983_HARN_StatePlane_Colorado_ North_FIPS_0501 | 2772 | USA - Colorado - SPCS - N | 39.56 | -109.06 | 41.01 | -102.04 |
| NAD_1983_HARN_StatePlane_Colorado_ North_FIPS_0501_Feet | 2876 | USA - Colorado - SPCS - N | 39.56 | -109.06 | 41.01 | -102.04 |
| NAD_1983_HARN_StatePlane_Colorado_ South_FIPS_0503 | 2774 | USA - Colorado - SPCS - S | 36.98 | -109.06 | 38.68 | -102.04 |
| NAD_1983_HARN_StatePlane_Colorado_ South_FIPS_0503_Feet | 2878 | USA - Colorado - SPCS - S | 36.98 | -109.06 | 38.68 | -102.04 |
| NAD_1983_HARN_StatePlane_Connectic ut_FIPS_0600 | 2775 | USA - Connecticut | 40.98 | -73.73 | 42.05 | -71.78 |
| NAD_1983_HARN_StatePlane_ Connecticut_FIPS_0600_Feet | 2879 | USA - Connecticut | 40.98 | -73.73 | 42.05 | -71.78 |
| NAD_1983_HARN_StatePlane_Delaware_ FIPS_0700 | 2776 | USA - Delaware | 38.44 | -75.8 | 39.85 | -74.97 |
| NAD_1983_HARN_StatePlane_Delaware_ FIPS_0700_Feet | 2880 | USA - Delaware | 38.44 | -75.8 | 39.85 | -74.97 |
| NAD_1983_HARN_StatePlane_Florida_ East_FIPS_0901 | 2777 | USA - Florida - SPCS - E | 24.41 | -82.33 | 30.83 | -79.97 |
| NAD_1983_HARN_StatePlane_Florida_ East_FIPS_0901_Feet | 2881 | USA - Florida - SPCS - E | 24.41 | -82.33 | 30.83 | -79.97 |
| NAD_1983_HARN_StatePlane_Florida_ North_FIPS_0903 | 2779 | USA - Florida - SPCS - N | 29.21 | -87.63 | 31.01 | -82.04 |
| NAD_1983_HARN_StatePlane_Florida_ North_FIPS_0903_Feet | 2883 | USA - Florida - SPCS - N | 29.21 | -87.63 | 31.01 | -82.04 |
| NAD_1983_HARN_StatePlane_Florida_ West_FIPS_0902 | 2778 | USA - Florida - SPCS - W | 26.27 | -83.34 | 29.6 | -81.13 |
| NAD_1983_HARN_StatePlane_Florida_ West_FIPS_0902_Feet | 2882 | USA - Florida - SPCS - W | 26.27 | -83.34 | 29.6 | -81.13 |
| NAD_1983_HARN_StatePlane_Georgia_ East_FIPS_1001 | 2780 | USA - Georgia - SPCS - E | 30.36 | -83.47 | 34.68 | -80.77 |
| NAD_1983_HARN_StatePlane_Georgia_ East_FIPS_1001_Feet | 2884 | USA - Georgia - SPCS - E | 30.36 | -83.47 | 34.68 | -80.77 |
| NAD_1983_HARN_StatePlane_Georgia_ West_FIPS_1002 | 2781 | USA - Georgia - SPCS - W | 30.62 | -85.61 | 35.01 | -82.99 |
| NAD_1983_HARN_StatePlane_Georgia_ West_FIPS_1002_Feet | 2885 | USA - Georgia - SPCS - W | 30.62 | -85.61 | 35.01 | -82.99 |
| NAD_1983_HARN_StatePlane_Hawaii_1_ FIPS_5101 | 2782 | USA - Hawaii - island of Hawaii - onshore | 18.87 | -156.1 | 20.33 | -154.74 |
| NAD_1983_HARN_StatePlane_Hawaii_1_ FIPS_5101_Feet | 102461 | USA - Hawaii - island of Hawaii - onshore | 18.87 | -156.1 | 20.33 | -154.74 |
| NAD_1983_HARN_StatePlane_Hawaii_2_ FIPS_5102 | 2783 | USA - Hawaii - Maui; Kahoolawe; Lanai; Molokai - onshore | 20.45 | -157.36 | 21.26 | -155.93 |
| NAD_1983_HARN_StatePlane_Hawaii_2_ FIPS_5102_Feet | 102462 | USA - Hawaii - Maui; Kahoolawe; Lanai; Molokai - onshore | 20.45 | -157.36 | 21.26 | -155.93 |
| NAD_1983_HARN_StatePlane_Hawaii_3_ FIPS_5103 | 2784 | USA - Hawaii - Oahu - onshore | 21.2 | -158.33 | 21.75 | -157.61 |
| NAD_1983_HARN_StatePlane_Hawaii_3_ FIPS_5103_Feet | 3760 | USA - Hawaii - Oahu - onshore | 21.2 | -158.33 | 21.75 | -157.61 |
| NAD_1983_HARN_StatePlane_Hawaii_4_ FIPS_5104 | 2785 | USA - Hawaii - Kauai - onshore | 21.81 | -159.85 | 22.29 | -159.23 |
| NAD_1983_HARN_StatePlane_Hawaii_4_ FIPS_5104_Feet | 102464 | USA - Hawaii - Kauai - onshore | 21.81 | -159.85 | 22.29 | -159.23 |
| NAD_1983_HARN_StatePlane_Hawaii_5_ FIPS_5105 | 2786 | USA - Hawaii - Niihau - onshore | 21.73 | -160.3 | 22.07 | -159.99 |
| NAD_1983_HARN_StatePlane_Hawaii_5_ FIPS_5105_Feet | 102465 | USA - Hawaii - Niihau - onshore | 21.73 | -160.3 | 22.07 | -159.99 |
| NAD_1983_HARN_StatePlane_Idaho_ Central_FIPS_1102 | 2788 | USA - Idaho - SPCS - C | 41.99 | -115.3 | 45.7 | -112.68 |
| NAD_1983_HARN_StatePlane_Idaho_ Central_FIPS_1102_Feet | 2887 | USA - Idaho - SPCS - C | 41.99 | -115.3 | 45.7 | -112.68 |
| NAD_1983_HARN_StatePlane_Idaho_East _FIPS_1101 | 2787 | USA - Idaho - SPCS - E | 41.99 | -113.24 | 44.75 | -111.04 |
| NAD_1983_HARN_StatePlane_Idaho_East _FIPS_1101_Feet | 2886 | USA - Idaho - SPCS - E | 41.99 | -113.24 | 44.75 | -111.04 |
| NAD_1983_HARN_StatePlane_Idaho_ West_FIPS_1103 | 2789 | USA - Idaho - SPCS - W | 41.99 | -117.24 | 49.01 | -114.32 |
| NAD_1983_HARN_StatePlane_Idaho_ West_FIPS_1103_Feet | 2888 | USA - Idaho - SPCS - W | 41.99 | -117.24 | 49.01 | -114.32 |
| NAD_1983_HARN_StatePlane_Illinois_ East_FIPS_1201 | 2790 | USA - Illinois - SPCS - E | 37.06 | -89.28 | 42.5 | -87.02 |
| NAD_1983_HARN_StatePlane_Illinois_ East_FIPS_1201_Feet | 3443 | USA - Illinois - SPCS - E | 37.06 | -89.28 | 42.5 | -87.02 |
| NAD_1983_HARN_StatePlane_Illinois_ West_FIPS_1202 | 2791 | USA - Illinois - SPCS - W | 36.98 | -91.52 | 42.51 | -88.93 |
| NAD_1983_HARN_StatePlane_Illinois_ West_FIPS_1202_Feet | 3444 | USA - Illinois - SPCS - W | 36.98 | -91.52 | 42.51 | -88.93 |
| NAD_1983_HARN_StatePlane_Indiana_ East_FIPS_1301 | 2792 | USA - Indiana - SPCS - E | 37.95 | -86.59 | 41.77 | -84.78 |
| NAD_1983_HARN_StatePlane_Indiana_ East_FIPS_1301_Feet | 2967 | USA - Indiana - SPCS - E | 37.95 | -86.59 | 41.77 | -84.78 |
| NAD_1983_HARN_StatePlane_Indiana_ West_FIPS_1302 | 2793 | USA - Indiana - SPCS - W | 37.77 | -88.06 | 41.77 | -86.24 |
| NAD_1983_HARN_StatePlane_Indiana_ West_FIPS_1302_Feet | 2968 | USA - Indiana - SPCS - W | 37.77 | -88.06 | 41.77 | -86.24 |
| NAD_1983_HARN_StatePlane_Iowa_ North_FIPS_1401 | 2794 | USA - Iowa - SPCS - N | 41.85 | -96.65 | 43.51 | -90.15 |
| NAD_1983_HARN_StatePlane_Iowa_ North_FIPS_1401_Feet | 3425 | USA - Iowa - SPCS - N | 41.85 | -96.65 | 43.51 | -90.15 |
| NAD_1983_HARN_StatePlane_Iowa_ South_FIPS_1402 | 2795 | USA - Iowa - SPCS - S | 40.37 | -96.14 | 42.04 | -90.14 |
| NAD_1983_HARN_StatePlane_Iowa_ South_FIPS_1402_Feet | 3426 | USA - Iowa - SPCS - S | 40.37 | -96.14 | 42.04 | -90.14 |
| NAD_1983_HARN_StatePlane_Kansas_ North_FIPS_1501 | 2796 | USA - Kansas - SPCS - N | 38.52 | -102.06 | 40.01 | -94.58 |
| NAD_1983_HARN_StatePlane_Kansas_ North_FIPS_1501_Feet | 3427 | USA - Kansas - SPCS - N | 38.52 | -102.06 | 40.01 | -94.58 |
| NAD_1983_HARN_StatePlane_Kansas_ South_FIPS_1502 | 2797 | USA - Kansas - SPCS - S | 36.99 | -102.05 | 38.88 | -94.6 |
| NAD_1983_HARN_StatePlane_Kansas_ South_FIPS_1502_Feet | 3428 | USA - Kansas - SPCS - S | 36.99 | -102.05 | 38.88 | -94.6 |
| NAD_1983_HARN_StatePlane_Kentucky_ FIPS_1600 | 3090 | USA - Kentucky | 36.49 | -89.57 | 39.15 | -81.95 |
| NAD_1983_HARN_StatePlane_Kentucky_ FIPS_1600_Feet | 3091 | USA - Kentucky | 36.49 | -89.57 | 39.15 | -81.95 |
| NAD_1983_HARN_StatePlane_Kentucky_ North_FIPS_1601 | 2798 | USA - Kentucky - SPCS - N | 37.71 | -85.96 | 39.15 | -82.47 |
| NAD_1983_HARN_StatePlane_Kentucky_ North_FIPS_1601_Feet | 2891 | USA - Kentucky - SPCS - N | 37.71 | -85.96 | 39.15 | -82.47 |
| NAD_1983_HARN_StatePlane_Kentucky_ South_FIPS_1602 | 2799 | USA - Kentucky - SPCS - S | 36.49 | -89.57 | 38.17 | -81.95 |
| NAD_1983_HARN_StatePlane_Kentucky_ South_FIPS_1602_Feet | 2892 | USA - Kentucky - SPCS - S | 36.49 | -89.57 | 38.17 | -81.95 |
| NAD_1983_HARN_StatePlane_Louisiana_ North_FIPS_1701 | 2800 | USA - Louisiana - SPCS - N | 30.85 | -94.05 | 33.03 | -90.86 |
| NAD_1983_HARN_StatePlane_Louisiana_ North_FIPS_1701_Feet | 3456 | USA - Louisiana - SPCS - N | 30.85 | -94.05 | 33.03 | -90.86 |
| NAD_1983_HARN_StatePlane_Louisiana_ South_FIPS_1702 | 2801 | USA - Louisiana - SPCS83 - S | 28.85 | -93.94 | 31.07 | -88.75 |
| NAD_1983_HARN_StatePlane_Louisiana_ South_FIPS_1702_Feet | 3457 | USA - Louisiana - SPCS83 - S | 28.85 | -93.94 | 31.07 | -88.75 |
| NAD_1983_HARN_StatePlane_Maine_ East_FIPS_1801 | 2802 | USA - Maine - SPCS - E | 43.88 | -70.03 | 47.47 | -66.91 |
| NAD_1983_HARN_StatePlane_Maine_ East_FIPS_1801_Feet | 26855 | USA - Maine - SPCS - E | 43.88 | -70.03 | 47.47 | -66.91 |
| NAD_1983_HARN_StatePlane_Maine_ West_FIPS_1802 | 2803 | USA - Maine - SPCS - W | 43.04 | -71.09 | 46.58 | -69.26 |
| NAD_1983_HARN_StatePlane_Maine_ West_FIPS_1802_Feet | 26856 | USA - Maine - SPCS - W | 43.04 | -71.09 | 46.58 | -69.26 |
| NAD_1983_HARN_StatePlane_Maryland_ FIPS_1900 | 2804 | USA - Maryland | 37.97 | -79.49 | 39.73 | -74.97 |
| NAD_1983_HARN_StatePlane_Maryland_ FIPS_1900_Feet | 2893 | USA - Maryland | 37.97 | -79.49 | 39.73 | -74.97 |
| NAD_1983_HARN_StatePlane_ Massachusetts_Island_FIPS_2002 | 2806 | USA - Massachusetts - SPCS - islands | 41.19 | -70.91 | 41.51 | -69.89 |
| NAD_1983_HARN_StatePlane_ Massachusetts_Island_FIPS_2002_Feet | 2895 | USA - Massachusetts - SPCS - islands | 41.19 | -70.91 | 41.51 | -69.89 |
| NAD_1983_HARN_StatePlane_ Massachusetts_Mainland_FIPS_2001 | 2805 | USA - Massachusetts - SPCS - mainland | 41.46 | -73.5 | 42.89 | -69.86 |
| NAD_1983_HARN_StatePlane_Mass- achusetts_Mainland_FIPS_2001_Feet | 2894 | USA - Massachusetts - SPCS - mainland | 41.46 | -73.5 | 42.89 | -69.86 |
| NAD_1983_HARN_StatePlane_Michigan_ Central_FIPS_2112 | 2808 | USA - Michigan - SPCS - C | 43.8 | -87.06 | 45.92 | -82.27 |
| NAD_1983_HARN_StatePlane_Michigan_ Central_FIPS_2112_Feet_Intl | 2897 | USA - Michigan - SPCS - C | 43.8 | -87.06 | 45.92 | -82.27 |
| NAD_1983_HARN_StatePlane_Michigan_ North_FIPS_2111 | 2807 | USA - Michigan - SPCS - N | 45.08 | -90.42 | 48.32 | -83.44 |
| NAD_1983_HARN_StatePlane_Michigan_ North_FIPS_2111_Feet_Intl | 2896 | USA - Michigan - SPCS - N | 45.08 | -90.42 | 48.32 | -83.44 |
| NAD_1983_HARN_StatePlane_Michigan_ South_FIPS_2113 | 2809 | USA - Michigan - SPCS - S | 41.69 | -87.2 | 44.22 | -82.13 |
| NAD_1983_HARN_StatePlane_Michigan_ South_FIPS_2113_Feet_Intl | 2898 | USA - Michigan - SPCS - S | 41.69 | -87.2 | 44.22 | -82.13 |
| NAD_1983_HARN_StatePlane_Minnesota _Central_FIPS_2202 | 2811 | USA - Minnesota - SPCS - C | 45.28 | -96.86 | 47.48 | -92.29 |
| NAD_1983_HARN_StatePlane_Minnesota _Central_FIPS_2202_Feet | 26858 | USA - Minnesota - SPCS - C | 45.28 | -96.86 | 47.48 | -92.29 |
| NAD_1983_HARN_StatePlane_Minnesota _North_FIPS_2201 | 2810 | USA - Minnesota - SPCS - N | 46.64 | -97.22 | 49.38 | -89.49 |
| NAD_1983_HARN_StatePlane_Minnesota _North_FIPS_2201_Feet | 26857 | USA - Minnesota - SPCS - N | 46.64 | -97.22 | 49.38 | -89.49 |
| NAD_1983_HARN_StatePlane_Minnesota _South_FIPS_2203 | 2812 | USA - Minnesota - SPCS - S | 43.49 | -96.85 | 45.59 | -91.21 |
| NAD_1983_HARN_StatePlane_Minnesota _South_FIPS_2203_Feet | 26859 | USA - Minnesota - SPCS - S | 43.49 | -96.85 | 45.59 | -91.21 |
| NAD_1983_HARN_StatePlane_Mississippi _East_FIPS_2301 | 2813 | USA - Mississippi - SPCS - E | 30.01 | -89.97 | 35.01 | -88.09 |
| NAD_1983_HARN_StatePlane_Mississippi _East_FIPS_2301_Feet | 2899 | USA - Mississippi - SPCS - E | 30.01 | -89.97 | 35.01 | -88.09 |
| NAD_1983_HARN_StatePlane_Mississippi _West_FIPS_2302 | 2814 | USA - Mississippi - SPCS - W | 31 | -91.65 | 35.01 | -89.37 |
| NAD_1983_HARN_StatePlane_Mississippi _West_FIPS_2302_Feet | 2900 | USA - Mississippi - SPCS - W | 31 | -91.65 | 35.01 | -89.37 |
| NAD_1983_HARN_StatePlane_Missouri_ Central_FIPS_2402 | 2816 | USA - Missouri - SPCS - C | 36.48 | -93.79 | 40.61 | -91.41 |
| NAD_1983_HARN_StatePlane_Missouri_ East_FIPS_2401 | 2815 | USA - Missouri - SPCS - E | 35.98 | -91.97 | 40.61 | -89.1 |
| NAD_1983_HARN_StatePlane_Missouri_ West_FIPS_2403 | 2817 | USA - Missouri - SPCS - W | 36.48 | -95.77 | 40.59 | -93.48 |
| NAD_1983_HARN_StatePlane_Montana_ FIPS_2500 | 2818 | USA - Montana | 44.35 | -116.07 | 49.01 | -104.04 |
| NAD_1983_HARN_StatePlane_Montana_ FIPS_2500_Feet_Intl | 2901 | USA - Montana | 44.35 | -116.07 | 49.01 | -104.04 |
| NAD_1983_HARN_StatePlane_Nebraska_ FIPS_2600 | 2819 | USA - Nebraska | 39.99 | -104.06 | 43.01 | -95.3 |
| NAD_1983_HARN_StatePlane_Nebraska_ FIPS_2600_Feet | 26860 | USA - Nebraska | 39.99 | -104.06 | 43.01 | -95.3 |
| NAD_1983_HARN_StatePlane_Nevada_ Central_FIPS_2702 | 2821 | USA - Nevada - SPCS - C | 36 | -118.19 | 41 | -114.99 |
| NAD_1983_HARN_StatePlane_Nevada_ Central_FIPS_2702_Feet | 3430 | USA - Nevada - SPCS - C | 36 | -118.19 | 41 | -114.99 |
| NAD_1983_HARN_StatePlane_Nevada_ East_FIPS_2701 | 2820 | USA - Nevada - SPCS - E | 34.99 | -117.01 | 42 | -114.03 |
| NAD_1983_HARN_StatePlane_Nevada_ East_FIPS_2701_Feet | 3429 | USA - Nevada - SPCS - E | 34.99 | -117.01 | 42 | -114.03 |
| NAD_1983_HARN_StatePlane_Nevada_ West_FIPS_2703 | 2822 | USA - Nevada - SPCS - W | 36.95 | -120 | 42 | -116.99 |
| NAD_1983_HARN_StatePlane_Nevada_ West_FIPS_2703_Feet | 3431 | USA - Nevada - SPCS - W | 36.95 | -120 | 42 | -116.99 |
| NAD_1983_HARN_StatePlane_New_ Hampshire_FIPS_2800 | 2823 | USA - New Hampshire | 42.69 | -72.56 | 45.31 | -70.63 |
| NAD_1983_HARN_StatePlane_New_ Hampshire_FIPS_2800_Feet | 3445 | USA - New Hampshire | 42.69 | -72.56 | 45.31 | -70.63 |
| NAD_1983_HARN_StatePlane_New_ Jersey_FIPS_2900 | 2824 | USA - New Jersey | 38.87 | -75.6 | 41.36 | -73.88 |
| NAD_1983_HARN_StatePlane_New_ Jersey_FIPS_2900_Feet | 3432 | USA - New Jersey | 38.87 | -75.6 | 41.36 | -73.88 |
| NAD_1983_HARN_StatePlane_New_ Mexico_Central_FIPS_3002 | 2826 | USA - New Mexico - SPCS83 - C | 31.78 | -107.73 | 37 | -104.84 |
| NAD_1983_HARN_StatePlane_New_ Mexico_Central_FIPS_3002_Feet | 2903 | USA - New Mexico - SPCS83 - C | 31.78 | -107.73 | 37 | -104.84 |
| NAD_1983_HARN_StatePlane_New_ Mexico_East_FIPS_3001 | 2825 | USA - New Mexico - SPCS - E | 32 | -105.72 | 37 | -102.99 |
| NAD_1983_HARN_StatePlane_New_ Mexico_East_FIPS_3001_Feet | 2902 | USA - New Mexico - SPCS - E | 32 | -105.72 | 37 | -102.99 |
| NAD_1983_HARN_StatePlane_New_ Mexico_West_FIPS_3003 | 2827 | USA - New Mexico - SPCS83 - W | 31.33 | -109.06 | 37 | -106.32 |
| NAD_1983_HARN_StatePlane_New_ Mexico_West_FIPS_3003_Feet | 2904 | USA - New Mexico - SPCS83 - W | 31.33 | -109.06 | 37 | -106.32 |
| NAD_1983_HARN_StatePlane_New_York _Central_FIPS_3102 | 2829 | USA - New York - SPCS - C | 41.99 | -77.75 | 44.41 | -75.04 |
| NAD_1983_HARN_StatePlane_New_York _Central_FIPS_3102_Feet | 2906 | USA - New York - SPCS - C | 41.99 | -77.75 | 44.41 | -75.04 |
| NAD_1983_HARN_StatePlane_New_York _East_FIPS_3101 | 2828 | USA - New York - SPCS - E | 40.88 | -75.87 | 45.02 | -73.23 |
| NAD_1983_HARN_StatePlane_New_York _East_FIPS_3101_Feet | 2905 | USA - New York - SPCS - E | 40.88 | -75.87 | 45.02 | -73.23 |
| NAD_1983_HARN_StatePlane_New_York _Long_Island_FIPS_3104 | 2831 | USA - New York - SPCS - Long Island | 40.47 | -74.26 | 41.3 | -71.8 |
| NAD_1983_HARN_StatePlane_New_York _Long_Island_FIPS_3104_Feet | 2908 | USA - New York - SPCS - Long Island | 40.47 | -74.26 | 41.3 | -71.8 |
| NAD_1983_HARN_StatePlane_New_York _West_FIPS_3103 | 2830 | USA - New York - SPCS - W | 41.99 | -79.77 | 43.64 | -77.36 |
| NAD_1983_HARN_StatePlane_New_York _West_FIPS_3103_Feet | 2907 | USA - New York - SPCS - W | 41.99 | -79.77 | 43.64 | -77.36 |
| NAD_1983_HARN_StatePlane_North_ Carolina_FIPS_3200 | 3358 | USA - North Carolina | 33.83 | -84.33 | 36.59 | -75.38 |
| NAD_1983_HARN_StatePlane_North_ Carolina_FIPS_3200_Feet | 3404 | USA - North Carolina | 33.83 | -84.33 | 36.59 | -75.38 |
| NAD_1983_HARN_StatePlane_North_ Dakota_North_FIPS_3301 | 2832 | USA - North Dakota - SPCS - N | 47.15 | -104.07 | 49.01 | -96.83 |
| NAD_1983_HARN_StatePlane_North_ Dakota_North_FIPS_3301_Feet_Intl | 2909 | USA - North Dakota - SPCS - N | 47.15 | -104.07 | 49.01 | -96.83 |
| NAD_1983_HARN_StatePlane_North_ Dakota_South_FIPS_3302 | 2833 | USA - North Dakota - SPCS - S | 45.93 | -104.05 | 47.83 | -96.55 |
| NAD_1983_HARN_StatePlane_North_ Dakota_South_FIPS_3302_Feet_Intl | 2910 | USA - North Dakota - SPCS - S | 45.93 | -104.05 | 47.83 | -96.55 |
| NAD_1983_HARN_StatePlane_Ohio_ North_FIPS_3401 | 2834 | USA - Ohio - SPCS - N | 40.1 | -84.81 | 42.33 | -80.51 |
| NAD_1983_HARN_StatePlane_Ohio_ North_FIPS_3401_Feet | 3753 | USA - Ohio - SPCS - N | 40.1 | -84.81 | 42.33 | -80.51 |
| NAD_1983_HARN_StatePlane_Ohio_ South_FIPS_3402 | 2835 | USA - Ohio - SPCS - S | 38.4 | -84.83 | 40.36 | -80.7 |
| NAD_1983_HARN_StatePlane_Ohio_ South_FIPS_3402_Feet | 3754 | USA - Ohio - SPCS - S | 38.4 | -84.83 | 40.36 | -80.7 |
| NAD_1983_HARN_StatePlane_Oklahoma _North_FIPS_3501 | 2836 | USA - Oklahoma - SPCS - N | 35.27 | -103 | 37.01 | -94.42 |
| NAD_1983_HARN_StatePlane_Oklahoma _North_FIPS_3501_Feet | 2911 | USA - Oklahoma - SPCS - N | 35.27 | -103 | 37.01 | -94.42 |
| NAD_1983_HARN_StatePlane_Oklahoma _South_FIPS_3502 | 2837 | USA - Oklahoma - SPCS - S | 33.62 | -100 | 35.57 | -94.42 |
| NAD_1983_HARN_StatePlane_Oklahoma _South_FIPS_3502_Feet | 2912 | USA - Oklahoma - SPCS - S | 33.62 | -100 | 35.57 | -94.42 |
| NAD_1983_HARN_StatePlane_Oregon_ North_FIPS_3601 | 2838 | USA - Oregon - SPCS - N | 43.95 | -124.17 | 46.26 | -116.47 |
| NAD_1983_HARN_StatePlane_Oregon_ North_FIPS_3601_Feet_Intl | 2913 | USA - Oregon - SPCS - N | 43.95 | -124.17 | 46.26 | -116.47 |
| NAD_1983_HARN_StatePlane_Oregon_ South_FIPS_3602 | 2839 | USA - Oregon - SPCS - S | 41.98 | -124.6 | 44.56 | -116.9 |
| NAD_1983_HARN_StatePlane_Oregon_ South_FIPS_3602_Feet_Intl | 2914 | USA - Oregon - SPCS - S | 41.98 | -124.6 | 44.56 | -116.9 |
| NAD_1983_HARN_StatePlane_ Pennsylvania_North_FIPS_3701 | 3362 | USA - Pennsylvania - SPCS - N | 40.6 | -80.53 | 42.53 | -74.7 |
| NAD_1983_HARN_StatePlane_ Pennsylvania_North_FIPS_3701_Feet | 3363 | USA - Pennsylvania - SPCS - N | 40.6 | -80.53 | 42.53 | -74.7 |
| NAD_1983_HARN_StatePlane_ Pennsylvania_South_FIPS_3702 | 3364 | USA - Pennsylvania - SPCS - S | 39.71 | -80.53 | 41.18 | -74.72 |
| NAD_1983_HARN_StatePlane_ Pennsylvania_South_FIPS_3702_Feet | 3365 | USA - Pennsylvania - SPCS - S | 39.71 | -80.53 | 41.18 | -74.72 |
| NAD_1983_HARN_StatePlane_Puerto_ Rico_Virgin_Islands_FIPS_5200 | 2866 | Caribbean - Puerto Rico and US Virgin Islands - onshore | 17.62 | -67.97 | 18.57 | -64.51 |
| NAD_1983_HARN_StatePlane_Rhode_ Island_FIPS_3800 | 2840 | USA - Rhode Island | 41.13 | -71.85 | 42.02 | -71.08 |
| NAD_1983_HARN_StatePlane_Rhode_ Island_FIPS_3800_Feet | 3446 | USA - Rhode Island | 41.13 | -71.85 | 42.02 | -71.08 |
| NAD_1983_HARN_StatePlane_South_ Carolina_FIPS_3900 | 3360 | USA - South Carolina | 32.05 | -83.36 | 35.21 | -78.52 |
| NAD_1983_HARN_StatePlane_South_ Carolina_FIPS_3900_Feet_Intl | 3361 | USA - South Carolina | 32.05 | -83.36 | 35.21 | -78.52 |
| NAD_1983_HARN_StatePlane_South_ Dakota_North_FIPS_4001 | 2841 | USA - South Dakota - SPCS - N | 44.14 | -104.07 | 45.95 | -96.45 |
| NAD_1983_HARN_StatePlane_South_ Dakota_North_FIPS_4001_Feet | 3458 | USA - South Dakota - SPCS - N | 44.14 | -104.07 | 45.95 | -96.45 |
| NAD_1983_HARN_StatePlane_South_ Dakota_South_FIPS_4002 | 2842 | USA - South Dakota - SPCS - S | 42.48 | -104.06 | 44.79 | -96.43 |
| NAD_1983_HARN_StatePlane_South_ Dakota_South_FIPS_4002_Feet | 3459 | USA - South Dakota - SPCS - S | 42.48 | -104.06 | 44.79 | -96.43 |
| NAD_1983_HARN_StatePlane_Tennessee _FIPS_4100 | 2843 | USA - Tennessee | 34.98 | -90.31 | 36.68 | -81.65 |
| NAD_1983_HARN_StatePlane_Tennessee _FIPS_4100_Feet | 2915 | USA - Tennessee | 34.98 | -90.31 | 36.68 | -81.65 |
| NAD_1983_HARN_StatePlane_Texas_ Central_FIPS_4203 | 2846 | USA - Texas - SPCS - C | 29.78 | -106.66 | 32.27 | -93.5 |
| NAD_1983_HARN_StatePlane_Texas_ Central_FIPS_4203_Feet | 2918 | USA - Texas - SPCS - C | 29.78 | -106.66 | 32.27 | -93.5 |
| NAD_1983_HARN_StatePlane_Texas_ North_Central_FIPS_4202 | 2845 | USA - Texas - SPCS - NC | 31.72 | -103.07 | 34.58 | -94 |
| NAD_1983_HARN_StatePlane_Texas_ North_Central_FIPS_4202_Feet | 2917 | USA - Texas - SPCS - NC | 31.72 | -103.07 | 34.58 | -94 |
| NAD_1983_HARN_StatePlane_Texas_ North_FIPS_4201 | 2844 | USA - Texas - SPCS - N | 34.3 | -103.03 | 36.5 | -99.99 |
| NAD_1983_HARN_StatePlane_Texas_ North_FIPS_4201_Feet | 2916 | USA - Texas - SPCS - N | 34.3 | -103.03 | 36.5 | -99.99 |
| NAD_1983_HARN_StatePlane_Texas_ South_Central_FIPS_4204 | 2847 | USA - Texas - SPCS83 - SC | 27.78 | -105 | 30.67 | -93.76 |
| NAD_1983_HARN_StatePlane_Texas_ South_Central_FIPS_4204_Feet | 2919 | USA - Texas - SPCS83 - SC | 27.78 | -105 | 30.67 | -93.76 |
| NAD_1983_HARN_StatePlane_Texas_ South_FIPS_4205 | 2848 | USA - Texas - SPCS83 - S | 25.83 | -100.2 | 28.21 | -96.85 |
| NAD_1983_HARN_StatePlane_Texas_ South_FIPS_4205_Feet | 2920 | USA - Texas - SPCS83 - S | 25.83 | -100.2 | 28.21 | -96.85 |
| NAD_1983_HARN_StatePlane_Utah_ Central_FIPS_4302 | 2850 | USA - Utah - SPCS - C | 38.49 | -114.05 | 41.08 | -109.04 |
| NAD_1983_HARN_StatePlane_Utah_ Central_FIPS_4302_Feet | 3569 | USA - Utah - SPCS - C | 38.49 | -114.05 | 41.08 | -109.04 |
| NAD_1983_HARN_StatePlane_Utah_ Central_FIPS_4302_Feet_Intl | 2922 | USA - Utah - SPCS - C | 38.49 | -114.05 | 41.08 | -109.04 |
| NAD_1983_HARN_StatePlane_Utah_ North_FIPS_4301 | 2849 | USA - Utah - SPCS - N | 40.55 | -114.04 | 42.01 | -109.04 |
| NAD_1983_HARN_StatePlane_Utah_ North_FIPS_4301_Feet | 3568 | USA - Utah - SPCS - N | 40.55 | -114.04 | 42.01 | -109.04 |
| NAD_1983_HARN_StatePlane_Utah_ North_FIPS_4301_Feet_Intl | 2921 | USA - Utah - SPCS - N | 40.55 | -114.04 | 42.01 | -109.04 |
| NAD_1983_HARN_StatePlane_Utah_ South_FIPS_4303 | 2851 | USA - Utah - SPCS - S | 36.99 | -114.05 | 38.58 | -109.04 |
| NAD_1983_HARN_StatePlane_Utah_ South_FIPS_4303_Feet | 3570 | USA - Utah - SPCS - S | 36.99 | -114.05 | 38.58 | -109.04 |
| NAD_1983_HARN_StatePlane_Utah_ South_FIPS_4303_Feet_Intl | 2923 | USA - Utah - SPCS - S | 36.99 | -114.05 | 38.58 | -109.04 |
| NAD_1983_HARN_StatePlane_Vermont_ FIPS_4400 | 2852 | USA - Vermont | 42.72 | -73.44 | 45.03 | -71.5 |
| NAD_1983_HARN_StatePlane_Vermont_ FIPS_4400_Ft_US | 5654 | USA - Vermont | 42.72 | -73.44 | 45.03 | -71.5 |
| NAD_1983_HARN_StatePlane_Virginia_ North_FIPS_4501 | 2853 | USA - Virginia - SPCS - N | 37.77 | -80.06 | 39.46 | -76.51 |
| NAD_1983_HARN_StatePlane_Virginia_ North_FIPS_4501_Feet | 2924 | USA - Virginia - SPCS - N | 37.77 | -80.06 | 39.46 | -76.51 |
| NAD_1983_HARN_StatePlane_Virginia_ South_FIPS_4502 | 2854 | USA - Virginia - SPCS - S | 36.54 | -83.68 | 38.28 | -75.31 |
| NAD_1983_HARN_StatePlane_Virginia_ South_FIPS_4502_Feet | 2925 | USA - Virginia - SPCS - S | 36.54 | -83.68 | 38.28 | -75.31 |
| NAD_1983_HARN_StatePlane_ Washington_North_FIPS_4601 | 2855 | USA - Washington - SPCS83 - N | 47.08 | -124.79 | 49.05 | -117.02 |
| NAD_1983_HARN_StatePlane_ Washington_North_FIPS_4601_Feet | 2926 | USA - Washington - SPCS83 - N | 47.08 | -124.79 | 49.05 | -117.02 |
| NAD_1983_HARN_StatePlane_ Washington_South_FIPS_4602 | 2856 | USA - Washington - SPCS83 - S | 45.54 | -124.4 | 47.61 | -116.91 |
| NAD_1983_HARN_StatePlane_ Washington_South_FIPS_4602_Feet | 2927 | USA - Washington - SPCS83 - S | 45.54 | -124.4 | 47.61 | -116.91 |
| NAD_1983_HARN_StatePlane_West_ Virginia_North_FIPS_4701 | 2857 | USA - West Virginia - SPCS - N | 38.76 | -81.76 | 40.64 | -77.72 |
| NAD_1983_HARN_StatePlane_West_ Virginia_North_FIPS_4701_Feet | 26861 | USA - West Virginia - SPCS - N | 38.76 | -81.76 | 40.64 | -77.72 |
| NAD_1983_HARN_StatePlane_West_ Virginia_South_FIPS_4702 | 2858 | USA - West Virginia - SPCS - S | 37.2 | -82.65 | 39.17 | -79.05 |
| NAD_1983_HARN_StatePlane_West_ Virginia_South_FIPS_4702_Feet | 26862 | USA - West Virginia - SPCS - S | 37.2 | -82.65 | 39.17 | -79.05 |
| NAD_1983_HARN_StatePlane_Wisconsin _Central_FIPS_4802 | 2860 | USA - Wisconsin - SPCS - C | 43.98 | -92.89 | 45.8 | -86.25 |
| NAD_1983_HARN_StatePlane_Wisconsin _Central_FIPS_4802_Feet | 2929 | USA - Wisconsin - SPCS - C | 43.98 | -92.89 | 45.8 | -86.25 |
| NAD_1983_HARN_StatePlane_Wisconsin _North_FIPS_4801 | 2859 | USA - Wisconsin - SPCS - N | 45.37 | -92.89 | 47.31 | -88.05 |
| NAD_1983_HARN_StatePlane_Wisconsin _North_FIPS_4801_Feet | 2928 | USA - Wisconsin - SPCS - N | 45.37 | -92.89 | 47.31 | -88.05 |
| NAD_1983_HARN_StatePlane_Wisconsin _South_FIPS_4803 | 2861 | USA - Wisconsin - SPCS - S | 42.48 | -91.43 | 44.33 | -86.95 |
| NAD_1983_HARN_StatePlane_Wisconsin _South_FIPS_4803_Feet | 2930 | USA - Wisconsin - SPCS - S | 42.48 | -91.43 | 44.33 | -86.95 |
| NAD_1983_HARN_StatePlane_Wyoming_ East_Central_FIPS_4902 | 2863 | USA - Wyoming - SPCS - EC | 40.99 | -108.63 | 45.01 | -106 |
| NAD_1983_HARN_StatePlane_Wyoming_ East_Central_FIPS_4902_Feet | 3756 | USA - Wyoming - SPCS - EC | 40.99 | -108.63 | 45.01 | -106 |
| NAD_1983_HARN_StatePlane_Wyoming_ East_FIPS_4901 | 2862 | USA - Wyoming - SPCS - E | 40.99 | -106.33 | 45.01 | -104.05 |
| NAD_1983_HARN_StatePlane_Wyoming_ East_FIPS_4901_Feet | 3755 | USA - Wyoming - SPCS - E | 40.99 | -106.33 | 45.01 | -104.05 |
| NAD_1983_HARN_StatePlane_Wyoming_ West_Central_FIPS_4903 | 2864 | USA - Wyoming - SPCS - WC | 40.99 | -111.06 | 45.01 | -107.5 |
| NAD_1983_HARN_StatePlane_Wyoming_ West_Central_FIPS_4903_Feet | 3757 | USA - Wyoming - SPCS - WC | 40.99 | -111.06 | 45.01 | -107.5 |
| NAD_1983_HARN_StatePlane_Wyoming_ West_FIPS_4904 | 2865 | USA - Wyoming - SPCS - W | 40.99 | -111.06 | 44.67 | -109.04 |
| NAD_1983_HARN_StatePlane_Wyoming_ West_FIPS_4904_Feet | 3758 | USA - Wyoming - SPCS - W | 40.99 | -111.06 | 44.67 | -109.04 |
| NAD_1983_HARN_Texas_Centric_ Mapping_System_Albers | 3085 | USA - Texas | 25.83 | -106.66 | 36.5 | -93.5 |
| NAD_1983_HARN_Texas_Centric_ Mapping_System_Lambert | 3084 | USA - Texas | 25.83 | -106.66 | 36.5 | -93.5 |
| NAD_1983_HARN_UTM_Zone_10N | 3740 | USA - 126°W to 120°W onshore | 33.85 | -124.79 | 49.05 | -119.99 |
| NAD_1983_HARN_UTM_Zone_11N | 3741 | USA - 120°W to 114°W onshore | 32.26 | -120 | 49.01 | -114 |
| NAD_1983_HARN_UTM_Zone_12N | 3742 | USA - 114°W to 108°W | 31.33 | -114 | 49.01 | -108 |
| NAD_1983_HARN_UTM_Zone_13N | 3743 | USA - 108°W to 102°W | 28.98 | -108 | 49.01 | -102 |
| NAD_1983_HARN_UTM_Zone_14N | 3744 | USA - 102°W to 96°W onshore | 25.83 | -102 | 49.01 | -95.99 |
| NAD_1983_HARN_UTM_Zone_15N | 3745 | USA - 96°W to 90°W onshore | 28.42 | -96 | 49.38 | -89.99 |
| NAD_1983_HARN_UTM_Zone_16N | 3746 | USA - 90°W to 84°W onshore | 28.85 | -90 | 48.32 | -83.99 |
| NAD_1983_HARN_UTM_Zone_17N | 3747 | USA - 84°W to 78°W onshore | 24.41 | -84.01 | 46.13 | -78 |
| NAD_1983_HARN_UTM_Zone_18N | 3748 | USA - 78°W to 72°W onshore | 33.84 | -78 | 45.03 | -72 |
| NAD_1983_HARN_UTM_Zone_19N | 3749 | USA - 72°W to 66°W onshore | 40.96 | -72 | 47.47 | -66.91 |
| NAD_1983_HARN_UTM_Zone_2S | 2195 | American Samoa - 2 main island groups and Rose Island | -14.59 | -170.88 | -14.11 | -168.09 |
| NAD_1983_HARN_UTM_Zone_4N | 3750 | USA - 162°W to 156°W onshore - HI | 19.51 | -160.3 | 22.29 | -156 |
| NAD_1983_HARN_UTM_Zone_5N | 3751 | USA - 156°W to 150°W onshore - HI | 18.87 | -156 | 20.86 | -154.74 |
| NAD_1983_HARN_Virginia_Lambert | 3969 | USA - Virginia | 36.54 | -83.68 | 39.46 | -75.31 |
| NAD_1983_HARN_Wisconsin_TM | 3071 | USA - Wisconsin | 42.48 | -92.89 | 47.31 | -86.25 |
| NAD_1983_HARN_Wisconsin_TM_US_Ft | 102220 | USA - Wisconsin | 42.48 | -92.89 | 47.31 | -86.25 |
| NAD_1983_HARN_WISCRS_Adams_ County_Feet | 103400 | USA - Wisconsin | 42.48 | -92.89 | 47.31 | -86.25 |
| NAD_1983_HARN_WISCRS_Adams_ County_Meters | 103300 | USA - Wisconsin | 42.48 | -92.89 | 47.31 | -86.25 |
| NAD_1983_HARN_WISCRS_Adams_and_J uneau_Feet | 8226 | USA - Wisconsin - Adams and Juneau | 43.64 | -90.32 | 44.25 | -89.59 |
| NAD_1983_HARN_WISCRS_Adams_and_J uneau_Meters | 8225 | USA - Wisconsin - Adams and Juneau | 43.64 | -90.32 | 44.25 | -89.59 |
| NAD_1983_HARN_WISCRS_Ashland_ County_Feet | 8224 | USA - Wisconsin | 42.48 | -92.89 | 47.31 | -86.25 |
| NAD_1983_HARN_WISCRS_Ashland_ County_Meters | 8222 | USA - Wisconsin | 42.48 | -92.89 | 47.31 | -86.25 |
| NAD_1983_HARN_WISCRS_Barron_ County_Feet | 8220 | USA - Wisconsin | 42.48 | -92.89 | 47.31 | -86.25 |
| NAD_1983_HARN_WISCRS_Barron_ County_Meters | 8218 | USA - Wisconsin | 42.48 | -92.89 | 47.31 | -86.25 |
| NAD_1983_HARN_WISCRS_Bayfield_ County_Feet | 8216 | USA - Wisconsin | 42.48 | -92.89 | 47.31 | -86.25 |
| NAD_1983_HARN_WISCRS_Bayfield_ County_Meters | 8214 | USA - Wisconsin | 42.48 | -92.89 | 47.31 | -86.25 |
| NAD_1983_HARN_WISCRS_Brown_ County_Feet | 8213 | USA - Wisconsin | 42.48 | -92.89 | 47.31 | -86.25 |
| NAD_1983_HARN_WISCRS_Brown_ County_Meters | 8212 | USA - Wisconsin | 42.48 | -92.89 | 47.31 | -86.25 |
| NAD_1983_HARN_WISCRS_Buffalo_ County_Feet | 8210 | USA - Wisconsin | 42.48 | -92.89 | 47.31 | -86.25 |
| NAD_1983_HARN_WISCRS_Buffalo_ County_Meters | 8209 | USA - Wisconsin | 42.48 | -92.89 | 47.31 | -86.25 |
| NAD_1983_HARN_WISCRS_Burnett_ County_Feet | 8208 | USA - Wisconsin | 42.48 | -92.89 | 47.31 | -86.25 |
| NAD_1983_HARN_WISCRS_Burnett_ County_Meters | 8207 | USA - Wisconsin | 42.48 | -92.89 | 47.31 | -86.25 |
| NAD_1983_HARN_WISCRS_Calumet_ County_Feet | 103407 | USA - Wisconsin | 42.48 | -92.89 | 47.31 | -86.25 |
| NAD_1983_HARN_WISCRS_Calumet_ County_Meters | 103307 | USA - Wisconsin | 42.48 | -92.89 | 47.31 | -86.25 |
| NAD_1983_HARN_WISCRS_Calumet_Fon d_du_Lac_Outagamie_and_Winnebago_ Feet | 8206 | USA - Wisconsin - Calumet, Fond du Lac, Outagamie and Winnebago | 43.54 | -88.89 | 44.6 | -88.04 |
| NAD_1983_HARN_WISCRS_Calumet_Fon d_du_Lac_Outagamie_and_Winnebago_ Meters | 8205 | USA - Wisconsin - Calumet, Fond du Lac, Outagamie and Winnebago | 43.54 | -88.89 | 44.6 | -88.04 |
| NAD_1983_HARN_WISCRS_Chippewa_ County_Feet | 8204 | USA - Wisconsin | 42.48 | -92.89 | 47.31 | -86.25 |
| NAD_1983_HARN_WISCRS_Chippewa_ County_Meters | 8203 | USA - Wisconsin | 42.48 | -92.89 | 47.31 | -86.25 |
| NAD_1983_HARN_WISCRS_Clark_County _Feet | 8202 | USA - Wisconsin | 42.48 | -92.89 | 47.31 | -86.25 |
| NAD_1983_HARN_WISCRS_Clark_County _Meters | 8201 | USA - Wisconsin | 42.48 | -92.89 | 47.31 | -86.25 |
| NAD_1983_HARN_WISCRS_Columbia_ County_Feet | 8200 | USA - Wisconsin | 42.48 | -92.89 | 47.31 | -86.25 |
| NAD_1983_HARN_WISCRS_Columbia_ County_Meters | 8198 | USA - Wisconsin | 42.48 | -92.89 | 47.31 | -86.25 |
| NAD_1983_HARN_WISCRS_Crawford_ County_Feet | 8197 | USA - Wisconsin | 42.48 | -92.89 | 47.31 | -86.25 |
| NAD_1983_HARN_WISCRS_Crawford_ County_Meters | 8196 | USA - Wisconsin | 42.48 | -92.89 | 47.31 | -86.25 |
| NAD_1983_HARN_WISCRS_Dane_County _Feet | 8193 | USA - Wisconsin | 42.48 | -92.89 | 47.31 | -86.25 |
| NAD_1983_HARN_WISCRS_Dane_County _Meters | 8191 | USA - Wisconsin | 42.48 | -92.89 | 47.31 | -86.25 |
| NAD_1983_HARN_WISCRS_Dodge_ County_Feet | 103413 | USA - Wisconsin | 42.48 | -92.89 | 47.31 | -86.25 |
| NAD_1983_HARN_WISCRS_Dodge_ County_Meters | 103313 | USA - Wisconsin | 42.48 | -92.89 | 47.31 | -86.25 |
| NAD_1983_HARN_WISCRS_Dodge_and_ Jefferson_Feet | 8189 | USA - Wisconsin - Dodge and Jefferson | 42.84 | -89.02 | 43.64 | -88.4 |
| NAD_1983_HARN_WISCRS_Dodge_and_ Jefferson_Meters | 8187 | USA - Wisconsin - Dodge and Jefferson | 42.84 | -89.02 | 43.64 | -88.4 |
| NAD_1983_HARN_WISCRS_Door_County _Feet | 8185 | USA - Wisconsin | 42.48 | -92.89 | 47.31 | -86.25 |
| NAD_1983_HARN_WISCRS_Door_County _Meters | 8184 | USA - Wisconsin | 42.48 | -92.89 | 47.31 | -86.25 |
| NAD_1983_HARN_WISCRS_Douglas_ County_Feet | 8182 | USA - Wisconsin | 42.48 | -92.89 | 47.31 | -86.25 |
| NAD_1983_HARN_WISCRS_Douglas_ County_Meters | 8181 | USA - Wisconsin | 42.48 | -92.89 | 47.31 | -86.25 |
| NAD_1983_HARN_WISCRS_Dunn_County _Feet | 8180 | USA - Wisconsin | 42.48 | -92.89 | 47.31 | -86.25 |
| NAD_1983_HARN_WISCRS_Dunn_County _Meters | 8179 | USA - Wisconsin | 42.48 | -92.89 | 47.31 | -86.25 |
| NAD_1983_HARN_WISCRS_EauClaire_ County_Feet | 8093 | USA - Wisconsin | 42.48 | -92.89 | 47.31 | -86.25 |
| NAD_1983_HARN_WISCRS_EauClaire_ County_Meters | 8092 | USA - Wisconsin | 42.48 | -92.89 | 47.31 | -86.25 |
| NAD_1983_HARN_WISCRS_Florence_ County_Feet | 8091 | USA - Wisconsin | 42.48 | -92.89 | 47.31 | -86.25 |
| NAD_1983_HARN_WISCRS_Florence_ County_Meters | 8090 | USA - Wisconsin | 42.48 | -92.89 | 47.31 | -86.25 |
| NAD_1983_HARN_WISCRS_Fond_du_Lac _County_Feet | 103419 | USA - Wisconsin | 42.48 | -92.89 | 47.31 | -86.25 |
| NAD_1983_HARN_WISCRS_Fond_du_Lac _County_Meters | 103319 | USA - Wisconsin | 42.48 | -92.89 | 47.31 | -86.25 |
| NAD_1983_HARN_WISCRS_Forest_ County_Feet | 8177 | USA - Wisconsin | 42.48 | -92.89 | 47.31 | -86.25 |
| NAD_1983_HARN_WISCRS_Forest_ County_Meters | 8173 | USA - Wisconsin | 42.48 | -92.89 | 47.31 | -86.25 |
| NAD_1983_HARN_WISCRS_Grant_County _Feet | 103421 | USA - Wisconsin | 42.48 | -92.89 | 47.31 | -86.25 |
| NAD_1983_HARN_WISCRS_Grant_County _Meters | 103321 | USA - Wisconsin | 42.48 | -92.89 | 47.31 | -86.25 |
| NAD_1983_HARN_WISCRS_Green_ County_Feet | 103422 | USA - Wisconsin | 42.48 | -92.89 | 47.31 | -86.25 |
| NAD_1983_HARN_WISCRS_Green_ County_Meters | 103322 | USA - Wisconsin | 42.48 | -92.89 | 47.31 | -86.25 |
| NAD_1983_HARN_WISCRS_Green_and_L afayette_Feet | 8170 | USA - Wisconsin - Green and Lafayette | 42.5 | -90.43 | 42.86 | -89.36 |
| NAD_1983_HARN_WISCRS_Green_and_L afayette_Meters | 8169 | USA - Wisconsin - Green and Lafayette | 42.5 | -90.43 | 42.86 | -89.36 |
| NAD_1983_HARN_WISCRS_GreenLake_ County_Feet | 103423 | USA - Wisconsin | 42.48 | -92.89 | 47.31 | -86.25 |
| NAD_1983_HARN_WISCRS_GreenLake_ County_Meters | 103323 | USA - Wisconsin | 42.48 | -92.89 | 47.31 | -86.25 |
| NAD_1983_HARN_WISCRS_Green_Lake_ and_Marquette_Feet | 8168 | USA - Wisconsin - Green Lake and Marquette | 43.63 | -89.6 | 43.99 | -88.88 |
| NAD_1983_HARN_WISCRS_Green_Lake_ and_Marquette_Meters | 8167 | USA - Wisconsin - Green Lake and Marquette | 43.63 | -89.6 | 43.99 | -88.88 |
| NAD_1983_HARN_WISCRS_Iowa_County _Feet | 8166 | USA - Wisconsin | 42.48 | -92.89 | 47.31 | -86.25 |
| NAD_1983_HARN_WISCRS_Iowa_County _Meters | 8165 | USA - Wisconsin | 42.48 | -92.89 | 47.31 | -86.25 |
| NAD_1983_HARN_WISCRS_Iron_County_ Feet | 8164 | USA - Wisconsin | 42.48 | -92.89 | 47.31 | -86.25 |
| NAD_1983_HARN_WISCRS_Iron_County_ Meters | 8163 | USA - Wisconsin | 42.48 | -92.89 | 47.31 | -86.25 |
| NAD_1983_HARN_WISCRS_Jackson_ County_Feet | 8162 | USA - Wisconsin | 42.48 | -92.89 | 47.31 | -86.25 |
| NAD_1983_HARN_WISCRS_Jackson_ County_Meters | 8161 | USA - Wisconsin | 42.48 | -92.89 | 47.31 | -86.25 |
| NAD_1983_HARN_WISCRS_Jefferson_ County_Feet | 103427 | USA - Wisconsin | 42.48 | -92.89 | 47.31 | -86.25 |
| NAD_1983_HARN_WISCRS_Jefferson_ County_Meters | 103327 | USA - Wisconsin | 42.48 | -92.89 | 47.31 | -86.25 |
| NAD_1983_HARN_WISCRS_Juneau_ County_Feet | 103428 | USA - Wisconsin | 42.48 | -92.89 | 47.31 | -86.25 |
| NAD_1983_HARN_WISCRS_Juneau_ County_Meters | 103328 | USA - Wisconsin | 42.48 | -92.89 | 47.31 | -86.25 |
| NAD_1983_HARN_WISCRS_Kenosha_ County_Feet | 103429 | USA - Wisconsin | 42.48 | -92.89 | 47.31 | -86.25 |
| NAD_1983_HARN_WISCRS_Kenosha_ County_Meters | 103329 | USA - Wisconsin | 42.48 | -92.89 | 47.31 | -86.25 |
| NAD_1983_HARN_WISCRS_Kenosha_Mil waukee_Ozaukee_and_Racine_Feet | 8160 | USA - Wisconsin - Kenosha, Milwaukee, Ozaukee and Racine | 42.49 | -88.31 | 43.55 | -87.75 |
| NAD_1983_HARN_WISCRS_Kenosha_Mil waukee_Ozaukee_and_Racine_Meters | 8159 | USA - Wisconsin - Kenosha, Milwaukee, Ozaukee and Racine | 42.49 | -88.31 | 43.55 | -87.75 |
| NAD_1983_HARN_WISCRS_Kewaunee_ County_Feet | 103430 | USA - Wisconsin | 42.48 | -92.89 | 47.31 | -86.25 |
| NAD_1983_HARN_WISCRS_Kewaunee_ County_Meters | 103330 | USA - Wisconsin | 42.48 | -92.89 | 47.31 | -86.25 |
| NAD_1983_HARN_WISCRS_Kewaunee_M anitowoc_and_Sheboygan_Feet | 8158 | USA - Wisconsin - Kewaunee, Manitowoc and Sheboygan | 43.54 | -88.17 | 44.68 | -87.37 |
| NAD_1983_HARN_WISCRS_Kewaunee_M anitowoc_and_Sheboygan_Meters | 8157 | USA - Wisconsin - Kewaunee, Manitowoc and Sheboygan | 43.54 | -88.17 | 44.68 | -87.37 |
| NAD_1983_HARN_WISCRS_LaCrosse_ County_Feet | 8156 | USA - Wisconsin | 42.48 | -92.89 | 47.31 | -86.25 |
| NAD_1983_HARN_WISCRS_LaCrosse_ County_Meters | 8155 | USA - Wisconsin | 42.48 | -92.89 | 47.31 | -86.25 |
| NAD_1983_HARN_WISCRS_Lafayette_ County_Feet | 103432 | USA - Wisconsin | 42.48 | -92.89 | 47.31 | -86.25 |
| NAD_1983_HARN_WISCRS_Lafayette_ County_Meters | 103332 | USA - Wisconsin | 42.48 | -92.89 | 47.31 | -86.25 |
| NAD_1983_HARN_WISCRS_Langlade_ County_Feet | 8154 | USA - Wisconsin | 42.48 | -92.89 | 47.31 | -86.25 |
| NAD_1983_HARN_WISCRS_Langlade_ County_Meters | 8153 | USA - Wisconsin | 42.48 | -92.89 | 47.31 | -86.25 |
| NAD_1983_HARN_WISCRS_Lincoln_ County_Feet | 8152 | USA - Wisconsin | 42.48 | -92.89 | 47.31 | -86.25 |
| NAD_1983_HARN_WISCRS_Lincoln_ County_Meters | 8151 | USA - Wisconsin | 42.48 | -92.89 | 47.31 | -86.25 |
| NAD_1983_HARN_WISCRS_Manitowoc_ County_Feet | 103435 | USA - Wisconsin | 42.48 | -92.89 | 47.31 | -86.25 |
| NAD_1983_HARN_WISCRS_Manitowoc_ County_Meters | 103335 | USA - Wisconsin | 42.48 | -92.89 | 47.31 | -86.25 |
| NAD_1983_HARN_WISCRS_Marathon_ County_Feet | 8150 | USA - Wisconsin | 42.48 | -92.89 | 47.31 | -86.25 |
| NAD_1983_HARN_WISCRS_Marathon_ County_Meters | 8149 | USA - Wisconsin | 42.48 | -92.89 | 47.31 | -86.25 |
| NAD_1983_HARN_WISCRS_Marinette_ County_Feet | 8148 | USA - Wisconsin | 42.48 | -92.89 | 47.31 | -86.25 |
| NAD_1983_HARN_WISCRS_Marinette_ County_Meters | 8147 | USA - Wisconsin | 42.48 | -92.89 | 47.31 | -86.25 |
| NAD_1983_HARN_WISCRS_Marquette_ County_Feet | 103438 | USA - Wisconsin | 42.48 | -92.89 | 47.31 | -86.25 |
| NAD_1983_HARN_WISCRS_Marquette_ County_Meters | 103338 | USA - Wisconsin | 42.48 | -92.89 | 47.31 | -86.25 |
| NAD_1983_HARN_WISCRS_Menominee_ County_Feet | 8146 | USA - Wisconsin | 42.48 | -92.89 | 47.31 | -86.25 |
| NAD_1983_HARN_WISCRS_Menominee_ County_Meters | 8145 | USA - Wisconsin | 42.48 | -92.89 | 47.31 | -86.25 |
| NAD_1983_HARN_WISCRS_Milwaukee_ County_Feet | 103440 | USA - Wisconsin | 42.48 | -92.89 | 47.31 | -86.25 |
| NAD_1983_HARN_WISCRS_Milwaukee_ County_Meters | 103340 | USA - Wisconsin | 42.48 | -92.89 | 47.31 | -86.25 |
| NAD_1983_HARN_WISCRS_Monroe_ County_Feet | 8144 | USA - Wisconsin | 42.48 | -92.89 | 47.31 | -86.25 |
| NAD_1983_HARN_WISCRS_Monroe_ County_Meters | 8143 | USA - Wisconsin | 42.48 | -92.89 | 47.31 | -86.25 |
| NAD_1983_HARN_WISCRS_Oconto_ County_Feet | 8142 | USA - Wisconsin | 42.48 | -92.89 | 47.31 | -86.25 |
| NAD_1983_HARN_WISCRS_Oconto_ County_Meters | 8141 | USA - Wisconsin | 42.48 | -92.89 | 47.31 | -86.25 |
| NAD_1983_HARN_WISCRS_Oneida_ County_Feet | 8140 | USA - Wisconsin | 42.48 | -92.89 | 47.31 | -86.25 |
| NAD_1983_HARN_WISCRS_Oneida_ County_Meters | 8139 | USA - Wisconsin | 42.48 | -92.89 | 47.31 | -86.25 |
| NAD_1983_HARN_WISCRS_Outagamie_ County_Feet | 103444 | USA - Wisconsin | 42.48 | -92.89 | 47.31 | -86.25 |
| NAD_1983_HARN_WISCRS_Outagamie_ County_Meters | 103344 | USA - Wisconsin | 42.48 | -92.89 | 47.31 | -86.25 |
| NAD_1983_HARN_WISCRS_Ozaukee_ County_Feet | 103445 | USA - Wisconsin | 42.48 | -92.89 | 47.31 | -86.25 |
| NAD_1983_HARN_WISCRS_Ozaukee_ County_Meters | 103345 | USA - Wisconsin | 42.48 | -92.89 | 47.31 | -86.25 |
| NAD_1983_HARN_WISCRS_Pepin_County _Feet | 103446 | USA - Wisconsin | 42.48 | -92.89 | 47.31 | -86.25 |
| NAD_1983_HARN_WISCRS_Pepin_County _Meters | 103346 | USA - Wisconsin | 42.48 | -92.89 | 47.31 | -86.25 |
| NAD_1983_HARN_WISCRS_Pepin_and_ Pierce_Feet | 8138 | USA - Wisconsin - Pepin and Pierce | 44.4 | -92.81 | 44.87 | -91.65 |
| NAD_1983_HARN_WISCRS_Pepin_and_ Pierce_Meters | 8137 | USA - Wisconsin - Pepin and Pierce | 44.4 | -92.81 | 44.87 | -91.65 |
| NAD_1983_HARN_WISCRS_Pierce_ County_Feet | 103447 | USA - Wisconsin | 42.48 | -92.89 | 47.31 | -86.25 |
| NAD_1983_HARN_WISCRS_Pierce_ County_Meters | 103347 | USA - Wisconsin | 42.48 | -92.89 | 47.31 | -86.25 |
| NAD_1983_HARN_WISCRS_Polk_County_ Feet | 8136 | USA - Wisconsin | 42.48 | -92.89 | 47.31 | -86.25 |
| NAD_1983_HARN_WISCRS_Polk_County_ Meters | 8135 | USA - Wisconsin | 42.48 | -92.89 | 47.31 | -86.25 |
| NAD_1983_HARN_WISCRS_Portage_ County_Feet | 8134 | USA - Wisconsin | 42.48 | -92.89 | 47.31 | -86.25 |
| NAD_1983_HARN_WISCRS_Portage_ County_Meters | 8133 | USA - Wisconsin | 42.48 | -92.89 | 47.31 | -86.25 |
| NAD_1983_HARN_WISCRS_Price_County _Feet | 8132 | USA - Wisconsin | 42.48 | -92.89 | 47.31 | -86.25 |
| NAD_1983_HARN_WISCRS_Price_County _Meters | 8131 | USA - Wisconsin | 42.48 | -92.89 | 47.31 | -86.25 |
| NAD_1983_HARN_WISCRS_Racine_ County_Feet | 103451 | USA - Wisconsin | 42.48 | -92.89 | 47.31 | -86.25 |
| NAD_1983_HARN_WISCRS_Racine_ County_Meters | 103351 | USA - Wisconsin | 42.48 | -92.89 | 47.31 | -86.25 |
| NAD_1983_HARN_WISCRS_Richland_ County_Feet | 8130 | USA - Wisconsin | 42.48 | -92.89 | 47.31 | -86.25 |
| NAD_1983_HARN_WISCRS_Richland_ County_Meters | 8129 | USA - Wisconsin | 42.48 | -92.89 | 47.31 | -86.25 |
| NAD_1983_HARN_WISCRS_Rock_County _Feet | 8128 | USA - Wisconsin | 42.48 | -92.89 | 47.31 | -86.25 |
| NAD_1983_HARN_WISCRS_Rock_County _Meters | 8127 | USA - Wisconsin | 42.48 | -92.89 | 47.31 | -86.25 |
| NAD_1983_HARN_WISCRS_Rusk_County _Feet | 8126 | USA - Wisconsin | 42.48 | -92.89 | 47.31 | -86.25 |
| NAD_1983_HARN_WISCRS_Rusk_County _Meters | 8125 | USA - Wisconsin | 42.48 | -92.89 | 47.31 | -86.25 |
| NAD_1983_HARN_WISCRS_Sauk_County _Feet | 8124 | USA - Wisconsin | 42.48 | -92.89 | 47.31 | -86.25 |
| NAD_1983_HARN_WISCRS_Sauk_County _Meters | 8123 | USA - Wisconsin | 42.48 | -92.89 | 47.31 | -86.25 |
| NAD_1983_HARN_WISCRS_Sawyer_ County_Feet | 8122 | USA - Wisconsin | 42.48 | -92.89 | 47.31 | -86.25 |
| NAD_1983_HARN_WISCRS_Sawyer_ County_Meters | 8121 | USA - Wisconsin | 42.48 | -92.89 | 47.31 | -86.25 |
| NAD_1983_HARN_WISCRS_Shawano_ County_Feet | 8120 | USA - Wisconsin | 42.48 | -92.89 | 47.31 | -86.25 |
| NAD_1983_HARN_WISCRS_Shawano_ County_Meters | 8119 | USA - Wisconsin | 42.48 | -92.89 | 47.31 | -86.25 |
| NAD_1983_HARN_WISCRS_Sheboygan_ County_Feet | 103458 | USA - Wisconsin | 42.48 | -92.89 | 47.31 | -86.25 |
| NAD_1983_HARN_WISCRS_Sheboygan_ County_Meters | 103358 | USA - Wisconsin | 42.48 | -92.89 | 47.31 | -86.25 |
| NAD_1983_HARN_WISCRS_St_Croix_ County_Feet | 8118 | USA - Wisconsin | 42.48 | -92.89 | 47.31 | -86.25 |
| NAD_1983_HARN_WISCRS_St_Croix_ County_Meters | 8117 | USA - Wisconsin | 42.48 | -92.89 | 47.31 | -86.25 |
| NAD_1983_HARN_WISCRS_Taylor_ County_Feet | 8116 | USA - Wisconsin | 42.48 | -92.89 | 47.31 | -86.25 |
| NAD_1983_HARN_WISCRS_Taylor_ County_Meters | 8115 | USA - Wisconsin | 42.48 | -92.89 | 47.31 | -86.25 |
| NAD_1983_HARN_WISCRS_Trempealeau _County_Feet | 8114 | USA - Wisconsin | 42.48 | -92.89 | 47.31 | -86.25 |
| NAD_1983_HARN_WISCRS_Trempealeau _County_Meters | 8113 | USA - Wisconsin | 42.48 | -92.89 | 47.31 | -86.25 |
| NAD_1983_HARN_WISCRS_Vernon_ County_Feet | 8112 | USA - Wisconsin | 42.48 | -92.89 | 47.31 | -86.25 |
| NAD_1983_HARN_WISCRS_Vernon_ County_Meters | 8111 | USA - Wisconsin | 42.48 | -92.89 | 47.31 | -86.25 |
| NAD_1983_HARN_WISCRS_Vilas_County _Feet | 8110 | USA - Wisconsin | 42.48 | -92.89 | 47.31 | -86.25 |
| NAD_1983_HARN_WISCRS_Vilas_County _Meters | 8109 | USA - Wisconsin | 42.48 | -92.89 | 47.31 | -86.25 |
| NAD_1983_HARN_WISCRS_Walworth_ County_Feet | 8108 | USA - Wisconsin | 42.48 | -92.89 | 47.31 | -86.25 |
| NAD_1983_HARN_WISCRS_Walworth_ County_Meters | 8107 | USA - Wisconsin | 42.48 | -92.89 | 47.31 | -86.25 |
| NAD_1983_HARN_WISCRS_Washburn_ County_Feet | 8106 | USA - Wisconsin | 42.48 | -92.89 | 47.31 | -86.25 |
| NAD_1983_HARN_WISCRS_Washburn_ County_Meters | 8105 | USA - Wisconsin | 42.48 | -92.89 | 47.31 | -86.25 |
| NAD_1983_HARN_WISCRS_Washington_ County_Feet | 8104 | USA - Wisconsin | 42.48 | -92.89 | 47.31 | -86.25 |
| NAD_1983_HARN_WISCRS_Washington_ County_Meters | 8103 | USA - Wisconsin | 42.48 | -92.89 | 47.31 | -86.25 |
| NAD_1983_HARN_WISCRS_Waukesha_ County_Feet | 8102 | USA - Wisconsin | 42.48 | -92.89 | 47.31 | -86.25 |
| NAD_1983_HARN_WISCRS_Waukesha_ County_Meters | 8101 | USA - Wisconsin | 42.48 | -92.89 | 47.31 | -86.25 |
| NAD_1983_HARN_WISCRS_Waupaca_ County_Feet | 8100 | USA - Wisconsin | 42.48 | -92.89 | 47.31 | -86.25 |
| NAD_1983_HARN_WISCRS_Waupaca_ County_Meters | 8099 | USA - Wisconsin | 42.48 | -92.89 | 47.31 | -86.25 |
| NAD_1983_HARN_WISCRS_Waushara_ County_Feet | 8098 | USA - Wisconsin | 42.48 | -92.89 | 47.31 | -86.25 |
| NAD_1983_HARN_WISCRS_Waushara_ County_Meters | 8097 | USA - Wisconsin | 42.48 | -92.89 | 47.31 | -86.25 |
| NAD_1983_HARN_WISCRS_Winnebago_ County_Feet | 103470 | USA - Wisconsin | 42.48 | -92.89 | 47.31 | -86.25 |
| NAD_1983_HARN_WISCRS_Winnebago_ County_Meters | 103370 | USA - Wisconsin | 42.48 | -92.89 | 47.31 | -86.25 |
| NAD_1983_HARN_WISCRS_Wood_ County_Feet | 8096 | USA - Wisconsin | 42.48 | -92.89 | 47.31 | -86.25 |
| NAD_1983_HARN_WISCRS_Wood_ County_Meters | 8095 | USA - Wisconsin | 42.48 | -92.89 | 47.31 | -86.25 |
| NAD_1983_Idaho-Ada_County | 102459 | Idaho - Ada County | 43 | -116.6 | 43.85 | -115.94 |
| NAD_1983_Idaho_TM | 8826 | USA - Idaho | 41.98 | -117.3 | 49.02 | -111 |
| NAD_1983_2011_ICS_Aurora_(US_Feet) | 102901 | Illinois - Aurora | 41.45 | -88.95 | 42.5 | -88.19 |
| NAD_1983_2011_ICS_Belleville_(US_ Feet) | 102929 | Illinois - Belleville | 38.08 | -90.38 | 39.01 | -89.59 |
| NAD_1983_2011_ICS_Bloomington_(US_ Feet) | 102914 | Illinois - Bloomington | 40.28 | -89.27 | 40.76 | -88.45 |
| NAD_1983_2011_ICS_Carbondale_(US_ Feet) | 102932 | Illinois - Carbondale | 37.56 | -90.21 | 38.26 | -87.91 |
| NAD_1983_2011_ICS_Carlinville_(US_ Feet) | 102925 | Illinois - Carlinville | 38.99 | -90.63 | 39.53 | -89.69 |
| NAD_1983_2011_ICS_Champaign_(US_ Feet) | 102916 | Illinois - Champaign | 39.86 | -88.47 | 40.5 | -87.52 |
| NAD_1983_2011_ICS_Charleston_(US_ Feet) | 102924 | Illinois - Charleston | 39.37 | -88.48 | 39.89 | -87.53 |
| NAD_1983_2011_ICS_Chicago_(US_Feet) | 102903 | Illinois - Chicago | 41.46 | -88.27 | 42.5 | -87.52 |
| NAD_1983_2011_ICS_Decatur_(US_Feet) | 102917 | Illinois - Decatur | 39.21 | -89.22 | 40.29 | -88.46 |
| NAD_1983_2011_ICS_Effingham_(US_ Feet) | 102928 | Illinois - Effingham | 38.73 | -89.64 | 39.22 | -88.36 |
| NAD_1983_2011_ICS_Eureka_(US_Feet) | 102909 | Illinois - Eureka | 40.59 | -89.64 | 41.15 | -88.92 |
| NAD_1983_2011_ICS_Freeport_(US_ Feet) | 102902 | Illinois - Freeport | 41.92 | -90.66 | 42.51 | -89.39 |
| NAD_1983_2011_ICS_Galesburg_(US_ Feet) | 102915 | Illinois - Galesburg | 40.18 | -90.46 | 41.24 | -89.63 |
| NAD_1983_2011_ICS_Jacksonville_(US_ Feet) | 102922 | Illinois - Jacksonville | 39.39 | -91.38 | 39.88 | -89.92 |
| NAD_1983_2011_ICS_Jerseyville_(US_ Feet) | 102927 | Illinois - Jerseyville | 38.86 | -90.94 | 39.41 | -90.14 |
| NAD_1983_2011_ICS_Joliet_(US_Feet) | 102908 | Illinois - Joliet | 40.99 | -88.27 | 41.73 | -87.52 |
| NAD_1983_2011_ICS_Lincoln_(US_Feet) | 102919 | Illinois - Lincoln | 39.87 | -90.59 | 40.44 | -89.14 |
| NAD_1983_2011_ICS_Macomb_(US_ Feet) | 102920 | Illinois - Macomb | 39.83 | -90.92 | 40.64 | -90.18 |
| NAD_1983_2011_ICS_Metropolis_(US_ Feet) | 102933 | Illinois - Metropolis | 36.97 | -89.53 | 37.61 | -88.05 |
| NAD_1983_2011_ICS_Moline_(US_Feet) | 102905 | Illinois - Moline | 41.32 | -91.08 | 41.79 | -90.15 |
| NAD_1983_2011_ICS_Monmouth_(US_ Feet) | 102911 | Illinois - Monmouth | 40.62 | -91.19 | 41.34 | -90.43 |
| NAD_1983_2011_ICS_Mount_Vernon_ (US_Feet) | 102931 | Illinois - Mount Vernon | 38.12 | -89.71 | 38.83 | -88.69 |
| NAD_1983_2011_ICS_Olney_(US_Feet) | 102930 | Illinois - Olney | 38.23 | -88.71 | 38.92 | -87.49 |
| NAD_1983_2011_ICS_Ottawa_(US_Feet) | 102906 | Illinois - Ottawa | 40.92 | -89.87 | 41.64 | -88.24 |
| NAD_1983_2011_ICS_Peoria_(US_Feet) | 102913 | Illinois - Peoria | 40.31 | -90.01 | 40.98 | -89.26 |
| NAD_1983_2011_ICS_Pontiac_(US_Feet) | 102910 | Illinois - Pontiac | 40.61 | -88.94 | 41.12 | -88.23 |
| NAD_1983_2011_ICS_Quincy_(US_Feet) | 102918 | Illinois - Quincy | 39.75 | -91.52 | 40.64 | -90.9 |
| NAD_1983_2011_ICS_Robinson_(US_ Feet) | 102926 | Illinois - Robinson | 38.84 | -88.48 | 39.49 | -87.51 |
| NAD_1983_2011_ICS_Rockford_(US_ Feet) | 102904 | Illinois - Rockford | 41.58 | -89.69 | 42.51 | -88.93 |
| NAD_1983_2011_ICS_Springfield_(US_ Feet) | 102921 | Illinois - Springfield | 39.52 | -90.01 | 39.98 | -89.21 |
| NAD_1983_2011_ICS_Sterling _(US_Feet) | 102907 | Illinois - Sterling | 41.14 | -90.44 | 41.94 | -89.62 |
| NAD_1983_2011_ICS_Taylorville_(US_ Feet) | 102923 | Illinois - Taylorville | 38.99 | -89.71 | 39.83 | -89.02 |
| NAD_1983_2011_ICS_Watseka_(US_ Feet) | 102912 | Illinois - Watseka | 40.39 | -88.47 | 41.02 | -87.52 |
| NAD_1983_Kansas_LCC | 6922 | USA - Kansas | 36.99 | -102.06 | 40.01 | -94.58 |
| NAD_1983_Kansas_LCC_ftUS | 6923 | USA - Kansas | 36.99 | -102.06 | 40.01 | -94.58 |
| NAD_1983_MA11_Guam_Map_Grid | 6637 | Guam - onshore | 13.18 | 144.58 | 13.7 | 145.01 |
| NAD_1983_MA11_UTM_Zone_54N | 8692 | Pacific - Guam and NMI west of 144°E | 10.95 | 141.19 | 23.9 | 144.01 |
| NAD_1983_MA11_UTM_Zone_55N | 8693 | Pacific - Guam and NMI east of 144°E | 11.05 | 144 | 23.9 | 149.55 |
| NAD_1983_Maine_2000_Central_Zone | 3463 | USA - Maine - CS2000 - C | 43.75 | -70.03 | 47.47 | -68.33 |
| NAD_1983_Maine_2000_East_Zone | 3072 | USA - Maine - CS2000 - E | 44.18 | -68.58 | 47.37 | -66.91 |
| NAD_1983_Maine_2000_West_Zone | 3074 | USA - Maine - CS2000 - W | 43.07 | -71.09 | 46.58 | -69.61 |
| NAD_1983_Michigan_GeoRef_Feet_US | 102121 | USA - Michigan | 41.69 | -90.42 | 48.32 | -82.13 |
| NAD_1983_Michigan_GeoRef_Meters | 3078 | USA - Michigan | 41.69 | -90.42 | 48.32 | -82.13 |
| NAD_1983_Mississippi_TM | 3814 | USA - Mississippi | 30.01 | -91.65 | 35.01 | -88.09 |
| NAD_1983_MTM_1 | 32181 | Canada - Newfoundland - east of 54.5°W | 46.56 | -54.5 | 49.89 | -52.54 |
| NAD_1983_MTM_10 | 32190 | Canada - Quebec and Ontario - MTM zone 10 | 42.26 | -81 | 62.45 | -78 |
| NAD_1983_MTM_11 | 32191 | Canada - Ontario - MTM zone 11 | 41.67 | -83.6 | 46 | -81 |
| NAD_1983_MTM_12 | 32192 | Canada - Ontario - MTM zone 12 | 46 | -82.5 | 55.21 | -79.5 |
| NAD_1983_MTM_13 | 32193 | Canada - Ontario - MTM zone 13 | 46 | -85.5 | 55.59 | -82.5 |
| NAD_1983_MTM_14 | 32194 | Canada - Ontario - 88.5°W to 85.5°W | 47.17 | -88.5 | 56.7 | -85.5 |
| NAD_1983_MTM_15 | 32195 | Canada - Ontario - 91.5°W to 88.5°W | 47.97 | -91.5 | 56.9 | -88.5 |
| NAD_1983_MTM_16 | 32196 | Canada - Ontario - 94.5°W to 91.5°W | 48.06 | -94.5 | 55.2 | -91.5 |
| NAD_1983_MTM_17 | 32197 | Canada - Ontario - west of 94.5°W | 48.69 | -95.16 | 53.24 | -94.5 |
| NAD_1983_MTM_2 | 32182 | Canada - Newfoundland and Labrador - 57.5°W to 54.5°W | 46.81 | -57.5 | 54.71 | -54.5 |
| NAD_1983_MTM_2_SCoPQ | 32180 | Canada - Quebec - east of 57°W | 46.6 | -57 | 53.76 | -54 |
| NAD_1983_MTM_3 | 32183 | Canada - Quebec, Newfoundland and Labrador - MTM zone 3 | 47.5 | -60 | 55.38 | -57.1 |
| NAD_1983_MTM_4 | 32184 | Canada - Quebec and Labrador - 63°W to 60°W | 47.16 | -63 | 58.92 | -60 |
| NAD_1983_MTM_5 | 32185 | Canada - Quebec and Labrador - 66°W to 63°W | 47.95 | -66 | 60.52 | -63 |
| NAD_1983_MTM_6 | 32186 | Canada - Quebec and Labrador - 69°W to 66°W | 47.31 | -69 | 59 | -66 |
| NAD_1983_MTM_7 | 32187 | Canada - Quebec - 72°W to 69°W | 45.01 | -72 | 61.8 | -69 |
| NAD_1983_MTM_8 | 32188 | Canada - Quebec and Ontario - 75°W to 72°W | 44.98 | -75 | 62.53 | -72 |
| NAD_1983_MTM_9 | 32189 | Canada - Quebec and Ontario - 78°W to 75°W | 43.63 | -78 | 62.65 | -75 |
| NAD_1983_MTQ_Lambert | 3798 | Canada - Quebec | 44.99 | -79.85 | 62.62 | -57.1 |
| NAD_1983_NCRS_Las_Vegas_(ftUS) | 8380 | USA - Nevada - Las Vegas | 35.89 | -115.5 | 36.43 | -114.72 |
| NAD_1983_NCRS_Las_Vegas_high_(ftUS) | 8382 | USA - Nevada - Las Vegas high elevation | 35.89 | -115.5 | 36.43 | -114.72 |
| NAD_1983_NCRS_Las_Vegas_high_(m) | 8381 | USA - Nevada - Las Vegas high elevation | 35.89 | -115.5 | 36.43 | -114.72 |
| NAD_1983_NCRS_Las_Vegas_(m) | 8379 | USA - Nevada - Las Vegas | 35.89 | -115.5 | 36.43 | -114.72 |
| NAD_1983_Nebraska_Lancaster_County_ FtUS | 102705 | US - Nebraska - Lancaster County | 40.5 | -96.93 | 41.07 | -96.43 |
| NAD_1983_Northwest_Territories_ Lambert | 3580 | Canada - NWT | 59.98 | -136.46 | 78.81 | -102 |
| NAD_1983_NSRS2007_Alaska_Albers | 3467 | USA - Alaska | 51.3 | 172.42 | 71.4 | -129.99 |
| NAD_1983_NSRS2007_California_Teale_ Albers | 3488 | USA - California | 32.53 | -124.45 | 42.01 | -114.12 |
| NAD_1983_NSRS2007_Contiguous_USA_ Albers | 5072 | USA - CONUS - onshore | 24.41 | -124.79 | 49.38 | -66.91 |
| NAD_1983_NSRS2007_EPSG_Arctic_zone _5-29 | 6094 | Arctic - 74°30'N to 69°30'N, 173°W to 153°W | 69.5 | -173 | 74.51 | -153 |
| NAD_1983_NSRS2007_EPSG_Arctic_zone _5-31 | 6095 | Arctic - 74°30'N to 69°30'N, 157°W to 137°W | 69.5 | -157 | 74.51 | -137 |
| NAD_1983_NSRS2007_EPSG_Arctic_zone _6-14 | 6096 | Arctic - 71°10'N to 66°10'N, 174°W to 156°W | 66.16 | -174 | 71.17 | -156 |
| NAD_1983_NSRS2007_EPSG_Arctic_zone _6-16 | 6097 | Arctic - 71°10'N to 66°10'N, 156°W to 138°W | 66.16 | -156 | 71.17 | -138 |
| NAD_1983_NSRS2007_Florida_GDL_ Albers | 3513 | USA - Florida | 24.41 | -87.63 | 31.01 | -79.97 |
| NAD_1983_NSRS2007_Maine_2000_ Central_Zone | 3554 | USA - Maine - CS2000 - C | 43.75 | -70.03 | 47.47 | -68.33 |
| NAD_1983_NSRS2007_Maine_2000_ East_Zone | 3555 | USA - Maine - CS2000 - E | 44.18 | -68.58 | 47.37 | -66.91 |
| NAD_1983_NSRS2007_Maine_2000_ West_Zone | 3556 | USA - Maine - CS2000 - W | 43.07 | -71.09 | 46.58 | -69.61 |
| NAD_1983_NSRS2007_Michigan_GeoRef _Meters | 3591 | USA - Michigan | 41.69 | -90.42 | 48.32 | -82.13 |
| NAD_1983_NSRS2007_Mississippi_TM | 3816 | USA - Mississippi | 30.01 | -91.65 | 35.01 | -88.09 |
| NAD_1983_ NSRS2007_Navajo_Nation_ Coordinate_System_Meters | 103589 | Navajo Nation | 32.8 | -114.04 | 37.75 | -106.17 |
| NAD_1983_ NSRS2007_Navajo_Nation_ Coordinate_System_US_Feet | 103590 | Navajo Nation | 32.8 | -114.04 | 37.75 | -106.17 |
| NAD_1983_ NSRS2007_Navajo_Nation_ Coordinate_System_Intl_Feet | 103591 | Navajo Nation | 32.8 | -114.04 | 37.75 | -106.17 |
| NAD_1983_NSRS2007_Oregon_Statewide _Lambert | 3643 | USA - Oregon | 41.98 | -124.6 | 46.26 | -116.47 |
| NAD_1983_NSRS2007_Oregon_Statewide _Lambert_Ft_Intl | 3644 | USA - Oregon | 41.98 | -124.6 | 46.26 | -116.47 |
| NAD_1983_NSRS2007_StatePlane_ Alabama_East_FIPS_0101 | 3465 | USA - Alabama - SPCS - E | 30.99 | -86.79 | 35 | -84.89 |
| NAD_1983_NSRS2007_StatePlane_ Alabama_West_FIPS_0102 | 3466 | USA - Alabama - SPCS - W | 30.14 | -88.48 | 35.02 | -86.3 |
| NAD_1983_NSRS2007_StatePlane_Alaska _10_FIPS_5010 | 3477 | USA - Alaska - Aleutian Islands | 51.3 | 172.42 | 54.34 | -164.84 |
| NAD_1983_NSRS2007_StatePlane_Alaska _1_FIPS_5001 | 3468 | USA - Alaska - Panhandle | 54.61 | -141 | 60.35 | -129.99 |
| NAD_1983_NSRS2007_StatePlane_Alaska _2_FIPS_5002 | 3469 | USA - Alaska - 144°W to 141°W | 59.72 | -144.01 | 70.16 | -140.98 |
| NAD_1983_NSRS2007_StatePlane_Alaska _3_FIPS_5003 | 3470 | USA - Alaska - 148°W to 144°W | 59.72 | -148 | 70.38 | -144 |
| NAD_1983_NSRS2007_StatePlane_Alaska _4_FIPS_5004 | 3471 | USA - Alaska - 152°W to 148°W | 59.11 | -152.01 | 70.63 | -147.99 |
| NAD_1983_NSRS2007_StatePlane_Alaska _5_FIPS_5005 | 3472 | USA - Alaska - 156°W to 152°W | 55.72 | -156 | 71.28 | -151.86 |
| NAD_1983_NSRS2007_StatePlane_Alaska _6_FIPS_5006 | 3473 | USA - Alaska - 160°W to 156°W | 54.89 | -160 | 71.4 | -155.99 |
| NAD_1983_NSRS2007_StatePlane_Alaska _7_FIPS_5007 | 3474 | USA - Alaska - 164°W to 160°W | 54.32 | -164.01 | 70.74 | -160 |
| NAD_1983_NSRS2007_StatePlane_Alaska _8_FIPS_5008 | 3475 | USA - Alaska - north of 54.5°N; 168°W to 164°W | 54.34 | -168.26 | 69.05 | -164 |
| NAD_1983_NSRS2007_StatePlane_Alaska _9_FIPS_5009 | 3476 | USA - Alaska - north of 54.5°N; west of 168°W | 56.49 | -173.16 | 65.82 | -168 |
| NAD_1983_NSRS2007_StatePlane_ Arizona_Central_FIPS_0202 | 3478 | USA - Arizona - SPCS - C | 31.33 | -113.35 | 37.01 | -110.44 |
| NAD_1983_NSRS2007_StatePlane_ Arizona_Central_FIPS_0202_Ft_Intl | 3479 | USA - Arizona - SPCS - C | 31.33 | -113.35 | 37.01 | -110.44 |
| NAD_1983_NSRS2007_StatePlane_ Arizona_East_FIPS_0201 | 3480 | USA - Arizona - SPCS - E | 31.33 | -111.71 | 37.01 | -109.04 |
| NAD_1983_NSRS2007_StatePlane_ Arizona_East_FIPS_0201_Ft_Intl | 3481 | USA - Arizona - SPCS - E | 31.33 | -111.71 | 37.01 | -109.04 |
| NAD_1983_NSRS2007_StatePlane_ Arizona_West_FIPS_0203 | 3482 | USA - Arizona - SPCS - W | 32.05 | -114.81 | 37 | -112.52 |
| NAD_1983_NSRS2007_StatePlane_ Arizona_West_FIPS_0203_Ft_Intl | 3483 | USA - Arizona - SPCS - W | 32.05 | -114.81 | 37 | -112.52 |
| NAD_1983_NSRS2007_StatePlane_ Arkansas_North_FIPS_0301 | 3484 | USA - Arkansas - SPCS - N | 34.67 | -94.62 | 36.5 | -89.64 |
| NAD_1983_NSRS2007_StatePlane_ Arkansas_North_FIPS_0301_Ft_US | 3485 | USA - Arkansas - SPCS - N | 34.67 | -94.62 | 36.5 | -89.64 |
| NAD_1983_NSRS2007_StatePlane_ Arkansas_South_FIPS_0302 | 3486 | USA - Arkansas - SPCS - S | 33.01 | -94.48 | 35.1 | -90.4 |
| NAD_1983_NSRS2007_StatePlane_ Arkansas_South_FIPS_0302_Ft_US | 3487 | USA - Arkansas - SPCS - S | 33.01 | -94.48 | 35.1 | -90.4 |
| NAD_1983_NSRS2007_StatePlane_ California_I_FIPS_0401 | 3489 | USA - California - SPCS - 1 | 39.59 | -124.45 | 42.01 | -119.99 |
| NAD_1983_NSRS2007_StatePlane_ California_I_FIPS_0401_Ft_US | 3490 | USA - California - SPCS - 1 | 39.59 | -124.45 | 42.01 | -119.99 |
| NAD_1983_NSRS2007_StatePlane_ California_II_FIPS_0402 | 3491 | USA - California - SPCS - 2 | 38.02 | -124.06 | 40.16 | -119.54 |
| NAD_1983_NSRS2007_StatePlane_ California_II_FIPS_0402_Ft_US | 3492 | USA - California - SPCS - 2 | 38.02 | -124.06 | 40.16 | -119.54 |
| NAD_1983_NSRS2007_StatePlane_ California_III_FIPS_0403 | 3493 | USA - California - SPCS - 3 | 36.73 | -123.02 | 38.71 | -117.83 |
| NAD_1983_NSRS2007_StatePlane_ California_III_FIPS_0403_Ft_US | 3494 | USA - California - SPCS - 3 | 36.73 | -123.02 | 38.71 | -117.83 |
| NAD_1983_NSRS2007_StatePlane_ California_IV_FIPS_0404 | 3495 | USA - California - SPCS - 4 | 35.78 | -122.01 | 37.58 | -115.62 |
| NAD_1983_NSRS2007_StatePlane_ California_IV_FIPS_0404_Ft_US | 3496 | USA - California - SPCS - 4 | 35.78 | -122.01 | 37.58 | -115.62 |
| NAD_1983_NSRS2007_StatePlane_ California_V_FIPS_0405 | 3497 | USA - California - SPCS83 - 5 | 32.76 | -121.42 | 35.81 | -114.12 |
| NAD_1983_NSRS2007_StatePlane_ California_V_FIPS_0405_Ft_US | 3498 | USA - California - SPCS83 - 5 | 32.76 | -121.42 | 35.81 | -114.12 |
| NAD_1983_NSRS2007_StatePlane_ California_VI_FIPS_0406 | 3499 | USA - California - SPCS - 6 | 32.53 | -118.15 | 34.08 | -114.42 |
| NAD_1983_NSRS2007_StatePlane_ California_VI_FIPS_0406_Ft_US | 3500 | USA - California - SPCS - 6 | 32.53 | -118.15 | 34.08 | -114.42 |
| NAD_1983_NSRS2007_StatePlane_ Colorado_Central_FIPS_0502 | 3501 | USA - Colorado - SPCS - C | 38.14 | -109.06 | 40.09 | -102.04 |
| NAD_1983_NSRS2007_StatePlane_ Colorado_Central_FIPS_0502_Ft_US | 3502 | USA - Colorado - SPCS - C | 38.14 | -109.06 | 40.09 | -102.04 |
| NAD_1983_NSRS2007_StatePlane_ Colorado_North_FIPS_0501 | 3503 | USA - Colorado - SPCS - N | 39.56 | -109.06 | 41.01 | -102.04 |
| NAD_1983_NSRS2007_StatePlane_ Colorado_North_FIPS_0501_Ft_US | 3504 | USA - Colorado - SPCS - N | 39.56 | -109.06 | 41.01 | -102.04 |
| NAD_1983_NSRS2007_StatePlane_ Colorado_South_FIPS_0503 | 3505 | USA - Colorado - SPCS - S | 36.98 | -109.06 | 38.68 | -102.04 |
| NAD_1983_NSRS2007_StatePlane_ Colorado_South_FIPS_0503_Ft_US | 3506 | USA - Colorado - SPCS - S | 36.98 | -109.06 | 38.68 | -102.04 |
| NAD_1983_NSRS2007_StatePlane_ Connecticut_FIPS_0600 | 3507 | USA - Connecticut | 40.98 | -73.73 | 42.05 | -71.78 |
| NAD_1983_NSRS2007_StatePlane_ Connecticut_FIPS_0600_Ft_US | 3508 | USA - Connecticut | 40.98 | -73.73 | 42.05 | -71.78 |
| NAD_1983_NSRS2007_StatePlane_ Delaware_FIPS_0700 | 3509 | USA - Delaware | 38.44 | -75.8 | 39.85 | -74.97 |
| NAD_1983_NSRS2007_StatePlane_ Delaware_FIPS_0700_Ft_US | 3510 | USA - Delaware | 38.44 | -75.8 | 39.85 | -74.97 |
| NAD_1983_NSRS2007_StatePlane_ Florida_East_FIPS_0901 | 3511 | USA - Florida - SPCS - E | 24.41 | -82.33 | 30.83 | -79.97 |
| NAD_1983_NSRS2007_StatePlane_ Florida_East_FIPS_0901_Ft_US | 3512 | USA - Florida - SPCS - E | 24.41 | -82.33 | 30.83 | -79.97 |
| NAD_1983_NSRS2007_StatePlane_ Florida_North_FIPS_0903 | 3514 | USA - Florida - SPCS - N | 29.21 | -87.63 | 31.01 | -82.04 |
| NAD_1983_NSRS2007_StatePlane_ Florida_North_FIPS_0903_Ft_US | 3515 | USA - Florida - SPCS - N | 29.21 | -87.63 | 31.01 | -82.04 |
| NAD_1983_NSRS2007_StatePlane_ Florida_West_FIPS_0902 | 3516 | USA - Florida - SPCS - W | 26.27 | -83.34 | 29.6 | -81.13 |
| NAD_1983_NSRS2007_StatePlane_ Florida_West_FIPS_0902_Ft_US | 3517 | USA - Florida - SPCS - W | 26.27 | -83.34 | 29.6 | -81.13 |
| NAD_1983_NSRS2007_StatePlane_ Georgia_East_FIPS_1001 | 3518 | USA - Georgia - SPCS - E | 30.36 | -83.47 | 34.68 | -80.77 |
| NAD_1983_NSRS2007_StatePlane_ Georgia_East_FIPS_1001_Ft_US | 3519 | USA - Georgia - SPCS - E | 30.36 | -83.47 | 34.68 | -80.77 |
| NAD_1983_NSRS2007_StatePlane_ Georgia_West_FIPS_1002 | 3520 | USA - Georgia - SPCS - W | 30.62 | -85.61 | 35.01 | -82.99 |
| NAD_1983_NSRS2007_StatePlane_ Georgia_West_FIPS_1002_Ft_US | 3521 | USA - Georgia - SPCS - W | 30.62 | -85.61 | 35.01 | -82.99 |
| NAD_1983_NSRS2007_StatePlane_Idaho _Central_FIPS_1102 | 3522 | USA - Idaho - SPCS - C | 41.99 | -115.3 | 45.7 | -112.68 |
| NAD_1983_NSRS2007_StatePlane_Idaho _Central_FIPS_1102_Ft_US | 3523 | USA - Idaho - SPCS - C | 41.99 | -115.3 | 45.7 | -112.68 |
| NAD_1983_NSRS2007_StatePlane_Idaho _East_FIPS_1101 | 3524 | USA - Idaho - SPCS - E | 41.99 | -113.24 | 44.75 | -111.04 |
| NAD_1983_NSRS2007_StatePlane_Idaho _East_FIPS_1101_Ft_US | 3525 | USA - Idaho - SPCS - E | 41.99 | -113.24 | 44.75 | -111.04 |
| NAD_1983_NSRS2007_StatePlane_Idaho _West_FIPS_1103 | 3526 | USA - Idaho - SPCS - W | 41.99 | -117.24 | 49.01 | -114.32 |
| NAD_1983_NSRS2007_StatePlane_Idaho _West_FIPS_1103_Ft_US | 3527 | USA - Idaho - SPCS - W | 41.99 | -117.24 | 49.01 | -114.32 |
| NAD_1983_NSRS2007_StatePlane_Illinois _East_FIPS_1201 | 3528 | USA - Illinois - SPCS - E | 37.06 | -89.28 | 42.5 | -87.02 |
| NAD_1983_NSRS2007_StatePlane_Illinois _East_FIPS_1201_Ft_US | 3529 | USA - Illinois - SPCS - E | 37.06 | -89.28 | 42.5 | -87.02 |
| NAD_1983_NSRS2007_StatePlane_Illinois _West_FIPS_1202 | 3530 | USA - Illinois - SPCS - W | 36.98 | -91.52 | 42.51 | -88.93 |
| NAD_1983_NSRS2007_StatePlane_Illinois _West_FIPS_1202_Ft_US | 3531 | USA - Illinois - SPCS - W | 36.98 | -91.52 | 42.51 | -88.93 |
| NAD_1983_NSRS2007_StatePlane_ Indiana_East_FIPS_1301 | 3532 | USA - Indiana - SPCS - E | 37.95 | -86.59 | 41.77 | -84.78 |
| NAD_1983_NSRS2007_StatePlane_ Indiana_East_FIPS_1301_Ft_US | 3533 | USA - Indiana - SPCS - E | 37.95 | -86.59 | 41.77 | -84.78 |
| NAD_1983_NSRS2007_StatePlane_ Indiana_West_FIPS_1302 | 3534 | USA - Indiana - SPCS - W | 37.77 | -88.06 | 41.77 | -86.24 |
| NAD_1983_NSRS2007_StatePlane_ Indiana_West_FIPS_1302_Ft_US | 3535 | USA - Indiana - SPCS - W | 37.77 | -88.06 | 41.77 | -86.24 |
| NAD_1983_NSRS2007_StatePlane_Iowa_ North_FIPS_1401 | 3536 | USA - Iowa - SPCS - N | 41.85 | -96.65 | 43.51 | -90.15 |
| NAD_1983_NSRS2007_StatePlane_Iowa_ North_FIPS_1401_Ft_US | 3537 | USA - Iowa - SPCS - N | 41.85 | -96.65 | 43.51 | -90.15 |
| NAD_1983_NSRS2007_StatePlane_Iowa_ South_FIPS_1402 | 3538 | USA - Iowa - SPCS - S | 40.37 | -96.14 | 42.04 | -90.14 |
| NAD_1983_NSRS2007_StatePlane_Iowa_ South_FIPS_1402_Ft_US | 3539 | USA - Iowa - SPCS - S | 40.37 | -96.14 | 42.04 | -90.14 |
| NAD_1983_NSRS2007_StatePlane_Kansas _North_FIPS_1501 | 3540 | USA - Kansas - SPCS - N | 38.52 | -102.06 | 40.01 | -94.58 |
| NAD_1983_NSRS2007_StatePlane_Kansas _North_FIPS_1501_Ft_US | 3541 | USA - Kansas - SPCS - N | 38.52 | -102.06 | 40.01 | -94.58 |
| NAD_1983_NSRS2007_StatePlane_Kansas _South_FIPS_1502 | 3542 | USA - Kansas - SPCS - S | 36.99 | -102.05 | 38.88 | -94.6 |
| NAD_1983_NSRS2007_StatePlane_Kansas _South_FIPS_1502_Ft_US | 3543 | USA - Kansas - SPCS - S | 36.99 | -102.05 | 38.88 | -94.6 |
| NAD_1983_NSRS2007_StatePlane_ Kentucky_FIPS_1600 | 3546 | USA - Kentucky | 36.49 | -89.57 | 39.15 | -81.95 |
| NAD_1983_NSRS2007_StatePlane_ Kentucky_FIPS_1600_Ft_US | 3547 | USA - Kentucky | 36.49 | -89.57 | 39.15 | -81.95 |
| NAD_1983_NSRS2007_StatePlane_ Kentucky_North_FIPS_1601 | 3544 | USA - Kentucky - SPCS - N | 37.71 | -85.96 | 39.15 | -82.47 |
| NAD_1983_NSRS2007_StatePlane_ Kentucky_North_FIPS_1601_Ft_US | 3545 | USA - Kentucky - SPCS - N | 37.71 | -85.96 | 39.15 | -82.47 |
| NAD_1983_NSRS2007_StatePlane_ Kentucky_South_FIPS_1602 | 3548 | USA - Kentucky - SPCS - S | 36.49 | -89.57 | 38.17 | -81.95 |
| NAD_1983_NSRS2007_StatePlane_ Kentucky_South_FIPS_1602_Ft_US | 3549 | USA - Kentucky - SPCS - S | 36.49 | -89.57 | 38.17 | -81.95 |
| NAD_1983_NSRS2007_StatePlane_ Louisiana_North_FIPS_1701 | 3550 | USA - Louisiana - SPCS - N | 30.85 | -94.05 | 33.03 | -90.86 |
| NAD_1983_NSRS2007_StatePlane_ Louisiana_North_FIPS_1701_Ft_US | 3551 | USA - Louisiana - SPCS - N | 30.85 | -94.05 | 33.03 | -90.86 |
| NAD_1983_NSRS2007_StatePlane_ Louisiana_South_FIPS_1702 | 3552 | USA - Louisiana - SPCS83 - S | 28.85 | -93.94 | 31.07 | -88.75 |
| NAD_1983_NSRS2007_StatePlane_ Louisiana_South_FIPS_1702_Ft_US | 3553 | USA - Louisiana - SPCS83 - S | 28.85 | -93.94 | 31.07 | -88.75 |
| NAD_1983_NSRS2007_StatePlane_Maine _East_FIPS_1801 | 3557 | USA - Maine - SPCS - E | 43.88 | -70.03 | 47.47 | -66.91 |
| NAD_1983_NSRS2007_StatePlane_Maine _East_FIPS_1801_Ft_US | 26863 | USA - Maine - SPCS - E | 43.88 | -70.03 | 47.47 | -66.91 |
| NAD_1983_NSRS2007_StatePlane_Maine _West_FIPS_1802 | 3558 | USA - Maine - SPCS - W | 43.04 | -71.09 | 46.58 | -69.26 |
| NAD_1983_NSRS2007_StatePlane_Maine _West_FIPS_1802_Ft_US | 26864 | USA - Maine - SPCS - W | 43.04 | -71.09 | 46.58 | -69.26 |
| NAD_1983_NSRS2007_StatePlane_ Maryland_FIPS_1900 | 3559 | USA - Maryland | 37.97 | -79.49 | 39.73 | -74.97 |
| NAD_1983_NSRS2007_StatePlane_ Maryland_FIPS_1900_Ft_US | 3582 | USA - Maryland | 37.97 | -79.49 | 39.73 | -74.97 |
| NAD_1983_NSRS2007_StatePlane_ Massachusetts_Island_FIPS_2002 | 3583 | USA - Massachusetts - SPCS - islands | 41.19 | -70.91 | 41.51 | -69.89 |
| NAD_1983_NSRS2007_StatePlane_ Massachusetts_Isl_FIPS_2002_FtUS | 3584 | USA - Massachusetts - SPCS - islands | 41.19 | -70.91 | 41.51 | -69.89 |
| NAD_1983_NSRS2007_StatePlane_ Massachusetts_Mainland_FIPS_2001 | 3585 | USA - Massachusetts - SPCS - mainland | 41.46 | -73.5 | 42.89 | -69.86 |
| NAD_1983_NSRS2007_StatePlane_ Massachusetts_Mnld_FIPS_2001_FtUS | 3586 | USA - Massachusetts - SPCS - mainland | 41.46 | -73.5 | 42.89 | -69.86 |
| NAD_1983_NSRS2007_StatePlane_ Michigan_Central_FIPS_2112 | 3587 | USA - Michigan - SPCS - C | 43.8 | -87.06 | 45.92 | -82.27 |
| NAD_1983_NSRS2007_StatePlane_ Michigan_Central_FIPS_2112_Ft_Intl | 3588 | USA - Michigan - SPCS - C | 43.8 | -87.06 | 45.92 | -82.27 |
| NAD_1983_NSRS2007_StatePlane_ Michigan_North_FIPS_2111 | 3589 | USA - Michigan - SPCS - N | 45.08 | -90.42 | 48.32 | -83.44 |
| NAD_1983_NSRS2007_StatePlane_ Michigan_North_FIPS_2111_Ft_Intl | 3590 | USA - Michigan - SPCS - N | 45.08 | -90.42 | 48.32 | -83.44 |
| NAD_1983_NSRS2007_StatePlane_ Michigan_South_FIPS_2113 | 3592 | USA - Michigan - SPCS - S | 41.69 | -87.2 | 44.22 | -82.13 |
| NAD_1983_NSRS2007_StatePlane_ Michigan_South_FIPS_2113_Ft_Intl | 3593 | USA - Michigan - SPCS - S | 41.69 | -87.2 | 44.22 | -82.13 |
| NAD_1983_NSRS2007_StatePlane_ Minnesota_Central_FIPS_2202 | 3594 | USA - Minnesota - SPCS - C | 45.28 | -96.86 | 47.48 | -92.29 |
| NAD_1983_NSRS2007_StatePlane_ Minnesota_Central_FIPS_2202_Ft_US | 26866 | USA - Minnesota - SPCS - C | 45.28 | -96.86 | 47.48 | -92.29 |
| NAD_1983_NSRS2007_StatePlane_ Minnesota_North_FIPS_2201 | 3595 | USA - Minnesota - SPCS - N | 46.64 | -97.22 | 49.38 | -89.49 |
| NAD_1983_NSRS2007_StatePlane_ Minnesota_North_FIPS_2201_Ft_US | 26865 | USA - Minnesota - SPCS - N | 46.64 | -97.22 | 49.38 | -89.49 |
| NAD_1983_NSRS2007_StatePlane_ Minnesota_South_FIPS_2203 | 3596 | USA - Minnesota - SPCS - S | 43.49 | -96.85 | 45.59 | -91.21 |
| NAD_1983_NSRS2007_StatePlane_ Minnesota_South_FIPS_2203_Ft_US | 26867 | USA - Minnesota - SPCS - S | 43.49 | -96.85 | 45.59 | -91.21 |
| NAD_1983_NSRS2007_StatePlane_ Mississippi_East_FIPS_2301 | 3597 | USA - Mississippi - SPCS - E | 30.01 | -89.97 | 35.01 | -88.09 |
| NAD_1983_NSRS2007_StatePlane_ Mississippi_East_FIPS_2301_Ft_US | 3598 | USA - Mississippi - SPCS - E | 30.01 | -89.97 | 35.01 | -88.09 |
| NAD_1983_NSRS2007_StatePlane_ Mississippi_West_FIPS_2302 | 3599 | USA - Mississippi - SPCS - W | 31 | -91.65 | 35.01 | -89.37 |
| NAD_1983_NSRS2007_StatePlane_ Mississippi_West_FIPS_2302_Ft_US | 3600 | USA - Mississippi - SPCS - W | 31 | -91.65 | 35.01 | -89.37 |
| NAD_1983_NSRS2007_StatePlane_ Missouri_Central_FIPS_2402 | 3601 | USA - Missouri - SPCS - C | 36.48 | -93.79 | 40.61 | -91.41 |
| NAD_1983_NSRS2007_StatePlane_ Missouri_East_FIPS_2401 | 3602 | USA - Missouri - SPCS - E | 35.98 | -91.97 | 40.61 | -89.1 |
| NAD_1983_NSRS2007_StatePlane_ Missouri_West_FIPS_2403 | 3603 | USA - Missouri - SPCS - W | 36.48 | -95.77 | 40.59 | -93.48 |
| NAD_1983_NSRS2007_StatePlane_ Montana_FIPS_2500 | 3604 | USA - Montana | 44.35 | -116.07 | 49.01 | -104.04 |
| NAD_1983_NSRS2007_StatePlane_ Montana_FIPS_2500_Ft_Intl | 3605 | USA - Montana | 44.35 | -116.07 | 49.01 | -104.04 |
| NAD_1983_NSRS2007_StatePlane_ Nebraska_FIPS_2600 | 3606 | USA - Nebraska | 39.99 | -104.06 | 43.01 | -95.3 |
| NAD_1983_NSRS2007_StatePlane_ Nebraska_FIPS_2600_Ft_US | 26868 | USA - Nebraska | 39.99 | -104.06 | 43.01 | -95.3 |
| NAD_1983_NSRS2007_StatePlane_ Nevada_Central_FIPS_2702 | 3607 | USA - Nevada - SPCS - C | 36 | -118.19 | 41 | -114.99 |
| NAD_1983_NSRS2007_StatePlane_ Nevada_Central_FIPS_2702_Ft_US | 3608 | USA - Nevada - SPCS - C | 36 | -118.19 | 41 | -114.99 |
| NAD_1983_NSRS2007_StatePlane_ Nevada_East_FIPS_2701 | 3609 | USA - Nevada - SPCS - E | 34.99 | -117.01 | 42 | -114.03 |
| NAD_1983_NSRS2007_StatePlane_ Nevada_East_FIPS_2701_Ft_US | 3610 | USA - Nevada - SPCS - E | 34.99 | -117.01 | 42 | -114.03 |
| NAD_1983_NSRS2007_StatePlane_ Nevada_West_FIPS_2703 | 3611 | USA - Nevada - SPCS - W | 36.95 | -120 | 42 | -116.99 |
| NAD_1983_NSRS2007_StatePlane_ Nevada_West_FIPS_2703_Ft_US | 3612 | USA - Nevada - SPCS - W | 36.95 | -120 | 42 | -116.99 |
| NAD_1983_NSRS2007_StatePlane_New_ Hampshire_FIPS_2800 | 3613 | USA - New Hampshire | 42.69 | -72.56 | 45.31 | -70.63 |
| NAD_1983_NSRS2007_StatePlane_New_ Hampshire_FIPS_2800_Ft_US | 3614 | USA - New Hampshire | 42.69 | -72.56 | 45.31 | -70.63 |
| NAD_1983_NSRS2007_StatePlane_New_ Jersey_FIPS_2900 | 3615 | USA - New Jersey | 38.87 | -75.6 | 41.36 | -73.88 |
| NAD_1983_NSRS2007_StatePlane_New_ Jersey_FIPS_2900_Ft_US | 3616 | USA - New Jersey | 38.87 | -75.6 | 41.36 | -73.88 |
| NAD_1983_NSRS2007_StatePlane_New_ Mexico_Central_FIPS_3002 | 3617 | USA - New Mexico - SPCS83 - C | 31.78 | -107.73 | 37 | -104.84 |
| NAD_1983_NSRS2007_StatePlane_New_ Mexico_Central_FIPS_3002_Ft_US | 3618 | USA - New Mexico - SPCS83 - C | 31.78 | -107.73 | 37 | -104.84 |
| NAD_1983_NSRS2007_StatePlane_New_ Mexico_East_FIPS_3001 | 3619 | USA - New Mexico - SPCS - E | 32 | -105.72 | 37 | -102.99 |
| NAD_1983_NSRS2007_StatePlane_New_ Mexico_East_FIPS_3001_Ft_US | 3620 | USA - New Mexico - SPCS - E | 32 | -105.72 | 37 | -102.99 |
| NAD_1983_NSRS2007_StatePlane_New_ Mexico_West_FIPS_3003 | 3621 | USA - New Mexico - SPCS83 - W | 31.33 | -109.06 | 37 | -106.32 |
| NAD_1983_NSRS2007_StatePlane_New_ Mexico_West_FIPS_3003_Ft_US | 3622 | USA - New Mexico - SPCS83 - W | 31.33 | -109.06 | 37 | -106.32 |
| NAD_1983_NSRS2007_StatePlane_New_ York_Central_FIPS_3102 | 3623 | USA - New York - SPCS - C | 41.99 | -77.75 | 44.41 | -75.04 |
| NAD_1983_NSRS2007_StatePlane_New_ York_Central_FIPS_3102_Ft_US | 3624 | USA - New York - SPCS - C | 41.99 | -77.75 | 44.41 | -75.04 |
| NAD_1983_NSRS2007_StatePlane_New_ York_East_FIPS_3101 | 3625 | USA - New York - SPCS - E | 40.88 | -75.87 | 45.02 | -73.23 |
| NAD_1983_NSRS2007_StatePlane_New_ York_East_FIPS_3101_Ft_US | 3626 | USA - New York - SPCS - E | 40.88 | -75.87 | 45.02 | -73.23 |
| NAD_1983_NSRS2007_StatePlane_New_ York_Long_Island_FIPS_3104 | 3627 | USA - New York - SPCS - Long Island | 40.47 | -74.26 | 41.3 | -71.8 |
| NAD_1983_NSRS2007_StatePlane_New_ York_Long_Isl_FIPS_3104_Ft_US | 3628 | USA - New York - SPCS - Long Island | 40.47 | -74.26 | 41.3 | -71.8 |
| NAD_1983_NSRS2007_StatePlane_New_ York_West_FIPS_3103 | 3629 | USA - New York - SPCS - W | 41.99 | -79.77 | 43.64 | -77.36 |
| NAD_1983_NSRS2007_StatePlane_New_ York_West_FIPS_3103_Ft_US | 3630 | USA - New York - SPCS - W | 41.99 | -79.77 | 43.64 | -77.36 |
| NAD_1983_NSRS2007_StatePlane_North _Carolina_FIPS_3200 | 3631 | USA - North Carolina | 33.83 | -84.33 | 36.59 | -75.38 |
| NAD_1983_NSRS2007_StatePlane_North _Carolina_FIPS_3200_Ft_US | 3632 | USA - North Carolina | 33.83 | -84.33 | 36.59 | -75.38 |
| NAD_1983_NSRS2007_StatePlane_North _Dakota_North_FIPS_3301 | 3633 | USA - North Dakota - SPCS - N | 47.15 | -104.07 | 49.01 | -96.83 |
| NAD_1983_NSRS2007_StatePlane_North _Dakota_North_FIPS_3301_FtI | 3634 | USA - North Dakota - SPCS - N | 47.15 | -104.07 | 49.01 | -96.83 |
| NAD_1983_NSRS2007_StatePlane_North _Dakota_South_FIPS_3302 | 3635 | USA - North Dakota - SPCS - S | 45.93 | -104.05 | 47.83 | -96.55 |
| NAD_1983_NSRS2007_StatePlane_North _Dakota_South_FIPS_3302_FtI | 3636 | USA - North Dakota - SPCS - S | 45.93 | -104.05 | 47.83 | -96.55 |
| NAD_1983_NSRS2007_StatePlane_Ohio_ North_FIPS_3401 | 3637 | USA - Ohio - SPCS - N | 40.1 | -84.81 | 42.33 | -80.51 |
| NAD_1983_NSRS2007_StatePlane_Ohio_ North_FIPS_3401_Ft_US | 3728 | USA - Ohio - SPCS - N | 40.1 | -84.81 | 42.33 | -80.51 |
| NAD_1983_NSRS2007_StatePlane_Ohio_ South_FIPS_3402 | 3638 | USA - Ohio - SPCS - S | 38.4 | -84.83 | 40.36 | -80.7 |
| NAD_1983_NSRS2007_StatePlane_Ohio_ South_FIPS_3402_Ft_US | 3729 | USA - Ohio - SPCS - S | 38.4 | -84.83 | 40.36 | -80.7 |
| NAD_1983_NSRS2007_StatePlane_ Oklahoma_North_FIPS_3501 | 3639 | USA - Oklahoma - SPCS - N | 35.27 | -103 | 37.01 | -94.42 |
| NAD_1983_NSRS2007_StatePlane_ Oklahoma_North_FIPS_3501_Ft_US | 3640 | USA - Oklahoma - SPCS - N | 35.27 | -103 | 37.01 | -94.42 |
| NAD_1983_NSRS2007_StatePlane_ Oklahoma_South_FIPS_3502 | 3641 | USA - Oklahoma - SPCS - S | 33.62 | -100 | 35.57 | -94.42 |
| NAD_1983_NSRS2007_StatePlane_ Oklahoma_South_FIPS_3502_Ft_US | 3642 | USA - Oklahoma - SPCS - S | 33.62 | -100 | 35.57 | -94.42 |
| NAD_1983_NSRS2007_StatePlane_ Oregon_North_FIPS_3601 | 3645 | USA - Oregon - SPCS - N | 43.95 | -124.17 | 46.26 | -116.47 |
| NAD_1983_NSRS2007_StatePlane_ Oregon_North_FIPS_3601_Ft_Intl | 3646 | USA - Oregon - SPCS - N | 43.95 | -124.17 | 46.26 | -116.47 |
| NAD_1983_NSRS2007_StatePlane_ Oregon_South_FIPS_3602 | 3647 | USA - Oregon - SPCS - S | 41.98 | -124.6 | 44.56 | -116.9 |
| NAD_1983_NSRS2007_StatePlane_ Oregon_South_FIPS_3602_Ft_Intl | 3648 | USA - Oregon - SPCS - S | 41.98 | -124.6 | 44.56 | -116.9 |
| NAD_1983_NSRS2007_StatePlane_ Pennsylvania_North_FIPS_3701 | 3649 | USA - Pennsylvania - SPCS - N | 40.6 | -80.53 | 42.53 | -74.7 |
| NAD_1983_NSRS2007_StatePlane_ Pennsylvania_North_FIPS_3701_Ft_US | 3650 | USA - Pennsylvania - SPCS - N | 40.6 | -80.53 | 42.53 | -74.7 |
| NAD_1983_NSRS2007_StatePlane_ Pennsylvania_South_FIPS_3702 | 3651 | USA - Pennsylvania - SPCS - S | 39.71 | -80.53 | 41.18 | -74.72 |
| NAD_1983_NSRS2007_StatePlane_ Pennsylvania_South_FIPS_3702_Ft_US | 3652 | USA - Pennsylvania - SPCS - S | 39.71 | -80.53 | 41.18 | -74.72 |
| NAD_1983_NSRS2007_StatePlane_Puerto _Rico_Virgin_Isls_FIPS_5200 | 4437 | Caribbean - Puerto Rico and US Virgin Islands - onshore | 17.62 | -67.97 | 18.57 | -64.51 |
| NAD_1983_NSRS2007_StatePlane_Rhode _Island_FIPS_3800 | 3653 | USA - Rhode Island | 41.13 | -71.85 | 42.02 | -71.08 |
| NAD_1983_NSRS2007_StatePlane_Rhode _Island_FIPS_3800_Ft_US | 3654 | USA - Rhode Island | 41.13 | -71.85 | 42.02 | -71.08 |
| NAD_1983_NSRS2007_StatePlane_South _Carolina_FIPS_3900 | 3655 | USA - South Carolina | 32.05 | -83.36 | 35.21 | -78.52 |
| NAD_1983_NSRS2007_StatePlane_South _Carolina_FIPS_3900_Ft_Intl | 3656 | USA - South Carolina | 32.05 | -83.36 | 35.21 | -78.52 |
| NAD_1983_NSRS2007_StatePlane_South _Dakota_North_FIPS_4001 | 3657 | USA - South Dakota - SPCS - N | 44.14 | -104.07 | 45.95 | -96.45 |
| NAD_1983_NSRS2007_StatePlane_South _Dakota_North_FIPS_4001_Ft_US | 3658 | USA - South Dakota - SPCS - N | 44.14 | -104.07 | 45.95 | -96.45 |
| NAD_1983_NSRS2007_StatePlane_South _Dakota_South_FIPS_4002 | 3659 | USA - South Dakota - SPCS - S | 42.48 | -104.06 | 44.79 | -96.43 |
| NAD_1983_NSRS2007_StatePlane_South _Dakota_South_FIPS_4002_Ft_US | 3660 | USA - South Dakota - SPCS - S | 42.48 | -104.06 | 44.79 | -96.43 |
| NAD_1983_NSRS2007_StatePlane_ Tennessee_FIPS_4100 | 3661 | USA - Tennessee | 34.98 | -90.31 | 36.68 | -81.65 |
| NAD_1983_NSRS2007_StatePlane_ Tennessee_FIPS_4100_Ft_US | 3662 | USA - Tennessee | 34.98 | -90.31 | 36.68 | -81.65 |
| NAD_1983_NSRS2007_StatePlane_Texas_ Central_FIPS_4203 | 3663 | USA - Texas - SPCS - C | 29.78 | -106.66 | 32.27 | -93.5 |
| NAD_1983_NSRS2007_StatePlane_Texas_ Central_FIPS_4203_Ft_US | 3664 | USA - Texas - SPCS - C | 29.78 | -106.66 | 32.27 | -93.5 |
| NAD_1983_NSRS2007_StatePlane_Texas_ North_Central_FIPS_4202 | 3669 | USA - Texas - SPCS - NC | 31.72 | -103.07 | 34.58 | -94 |
| NAD_1983_NSRS2007_StatePlane_Texas_ North_Central_FIPS_4202_FtUS | 3670 | USA - Texas - SPCS - NC | 31.72 | -103.07 | 34.58 | -94 |
| NAD_1983_NSRS2007_StatePlane_Texas_ North_FIPS_4201 | 3667 | USA - Texas - SPCS - N | 34.3 | -103.03 | 36.5 | -99.99 |
| NAD_1983_NSRS2007_StatePlane_Texas_ North_FIPS_4201_Ft_US | 3668 | USA - Texas - SPCS - N | 34.3 | -103.03 | 36.5 | -99.99 |
| NAD_1983_NSRS2007_StatePlane_Texas_ South_Central_FIPS_4204 | 3673 | USA - Texas - SPCS83 - SC | 27.78 | -105 | 30.67 | -93.76 |
| NAD_1983_NSRS2007_StatePlane_Texas_ South_Central_FIPS_4204_FtUS | 3674 | USA - Texas - SPCS83 - SC | 27.78 | -105 | 30.67 | -93.76 |
| NAD_1983_NSRS2007_StatePlane_Texas_ South_FIPS_4205 | 3671 | USA - Texas - SPCS83 - S | 25.83 | -100.2 | 28.21 | -96.85 |
| NAD_1983_NSRS2007_StatePlane_Texas_ South_FIPS_4205_Ft_US | 3672 | USA - Texas - SPCS83 - S | 25.83 | -100.2 | 28.21 | -96.85 |
| NAD_1983_NSRS2007_StatePlane_Utah_ Central_FIPS_4302 | 3675 | USA - Utah - SPCS - C | 38.49 | -114.05 | 41.08 | -109.04 |
| NAD_1983_NSRS2007_StatePlane_Utah_ Central_FIPS_4302_Ft_Intl | 3676 | USA - Utah - SPCS - C | 38.49 | -114.05 | 41.08 | -109.04 |
| NAD_1983_NSRS2007_StatePlane_Utah_ Central_FIPS_4302_Ft_US | 3677 | USA - Utah - SPCS - C | 38.49 | -114.05 | 41.08 | -109.04 |
| NAD_1983_NSRS2007_StatePlane_Utah_ North_FIPS_4301 | 3678 | USA - Utah - SPCS - N | 40.55 | -114.04 | 42.01 | -109.04 |
| NAD_1983_NSRS2007_StatePlane_Utah_ North_FIPS_4301_Ft_Intl | 3679 | USA - Utah - SPCS - N | 40.55 | -114.04 | 42.01 | -109.04 |
| NAD_1983_NSRS2007_StatePlane_Utah_ North_FIPS_4301_Ft_US | 3680 | USA - Utah - SPCS - N | 40.55 | -114.04 | 42.01 | -109.04 |
| NAD_1983_NSRS2007_StatePlane_Utah_ South_FIPS_4303 | 3681 | USA - Utah - SPCS - S | 36.99 | -114.05 | 38.58 | -109.04 |
| NAD_1983_NSRS2007_StatePlane_Utah_ South_FIPS_4303_Ft_Intl | 3682 | USA - Utah - SPCS - S | 36.99 | -114.05 | 38.58 | -109.04 |
| NAD_1983_NSRS2007_StatePlane_Utah_ South_FIPS_4303_Ft_US | 3683 | USA - Utah - SPCS - S | 36.99 | -114.05 | 38.58 | -109.04 |
| NAD_1983_NSRS2007_StatePlane_ Vermont_FIPS_4400 | 3684 | USA - Vermont | 42.72 | -73.44 | 45.03 | -71.5 |
| NAD_1983_NSRS2007_StatePlane_ Vermont_FIPS_4400_Ft_US | 5655 | USA - Vermont | 42.72 | -73.44 | 45.03 | -71.5 |
| NAD_1983_NSRS2007_StatePlane_ Virginia_North_FIPS_4501 | 3685 | USA - Virginia - SPCS - N | 37.77 | -80.06 | 39.46 | -76.51 |
| NAD_1983_NSRS2007_StatePlane_ Virginia_North_FIPS_4501_Ft_US | 3686 | USA - Virginia - SPCS - N | 37.77 | -80.06 | 39.46 | -76.51 |
| NAD_1983_NSRS2007_StatePlane_ Virginia_South_FIPS_4502 | 3687 | USA - Virginia - SPCS - S | 36.54 | -83.68 | 38.28 | -75.31 |
| NAD_1983_NSRS2007_StatePlane_ Virginia_South_FIPS_4502_Ft_US | 3688 | USA - Virginia - SPCS - S | 36.54 | -83.68 | 38.28 | -75.31 |
| NAD_1983_NSRS2007_StatePlane_ Washington_North_FIPS_4601 | 3689 | USA - Washington - SPCS83 - N | 47.08 | -124.79 | 49.05 | -117.02 |
| NAD_1983_NSRS2007_StatePlane_ Washington_North_FIPS_4601_Ft_US | 3690 | USA - Washington - SPCS83 - N | 47.08 | -124.79 | 49.05 | -117.02 |
| NAD_1983_NSRS2007_StatePlane_ Washington_South_FIPS_4602 | 3691 | USA - Washington - SPCS83 - S | 45.54 | -124.4 | 47.61 | -116.91 |
| NAD_1983_NSRS2007_StatePlane_ Washington_South_FIPS_4602_Ft_US | 3692 | USA - Washington - SPCS83 - S | 45.54 | -124.4 | 47.61 | -116.91 |
| NAD_1983_NSRS2007_StatePlane_West_ Virginia_North_FIPS_4701 | 3693 | USA - West Virginia - SPCS - N | 38.76 | -81.76 | 40.64 | -77.72 |
| NAD_1983_NSRS2007_StatePlane_West_ Virginia_North_FIPS_4701_FtUS | 26869 | USA - West Virginia - SPCS - N | 38.76 | -81.76 | 40.64 | -77.72 |
| NAD_1983_NSRS2007_StatePlane_West_ Virginia_South_FIPS_4702 | 3694 | USA - West Virginia - SPCS - S | 37.2 | -82.65 | 39.17 | -79.05 |
| NAD_1983_NSRS2007_StatePlane_West_ Virginia_South_FIPS_4702_FtUS | 26870 | USA - West Virginia - SPCS - S | 37.2 | -82.65 | 39.17 | -79.05 |
| NAD_1983_NSRS2007_StatePlane_ Wisconsin_Central_FIPS_4802 | 3695 | USA - Wisconsin - SPCS - C | 43.98 | -92.89 | 45.8 | -86.25 |
| NAD_1983_NSRS2007_StatePlane_ Wisconsin_Central_FIPS_4802_Ft_US | 3696 | USA - Wisconsin - SPCS - C | 43.98 | -92.89 | 45.8 | -86.25 |
| NAD_1983_NSRS2007_StatePlane_ Wisconsin_North_FIPS_4801 | 3697 | USA - Wisconsin - SPCS - N | 45.37 | -92.89 | 47.31 | -88.05 |
| NAD_1983_NSRS2007_StatePlane_ Wisconsin_North_FIPS_4801_Ft_US | 3698 | USA - Wisconsin - SPCS - N | 45.37 | -92.89 | 47.31 | -88.05 |
| NAD_1983_NSRS2007_StatePlane_ Wisconsin_South_FIPS_4803 | 3699 | USA - Wisconsin - SPCS - S | 42.48 | -91.43 | 44.33 | -86.95 |
| NAD_1983_NSRS2007_StatePlane_ Wisconsin_South_FIPS_4803_Ft_US | 3700 | USA - Wisconsin - SPCS - S | 42.48 | -91.43 | 44.33 | -86.95 |
| NAD_1983_NSRS2007_StatePlane_ Wyoming_East_Central_FIPS_4902 | 3703 | USA - Wyoming - SPCS - EC | 40.99 | -108.63 | 45.01 | -106 |
| NAD_1983_NSRS2007_StatePlane_ Wyoming_East_FIPS_4901 | 3702 | USA - Wyoming - SPCS - E | 40.99 | -106.33 | 45.01 | -104.05 |
| NAD_1983_NSRS2007_StatePlane_ Wyoming_East_FIPS_4901_Ft_US | 3730 | USA - Wyoming - SPCS - E | 40.99 | -106.33 | 45.01 | -104.05 |
| NAD_1983_NSRS2007_StatePlane_ Wyoming_E_Central_FIPS_4902_Ft_US | 3731 | USA - Wyoming - SPCS - EC | 40.99 | -108.63 | 45.01 | -106 |
| NAD_1983_NSRS2007_StatePlane_ Wyoming_W_Central_FIPS_4903_Ft_US | 3732 | USA - Wyoming - SPCS - WC | 40.99 | -111.06 | 45.01 | -107.5 |
| NAD_1983_NSRS2007_StatePlane_ Wyoming_West_Central_FIPS_4903 | 3704 | USA - Wyoming - SPCS - WC | 40.99 | -111.06 | 45.01 | -107.5 |
| NAD_1983_NSRS2007_StatePlane_ Wyoming_West_FIPS_4904 | 3705 | USA - Wyoming - SPCS - W | 40.99 | -111.06 | 44.67 | -109.04 |
| NAD_1983_NSRS2007_StatePlane_ Wyoming_West_FIPS_4904_Ft_US | 3733 | USA - Wyoming - SPCS - W | 40.99 | -111.06 | 44.67 | -109.04 |
| NAD_1983_NSRS2007_Texas_Centric_ Mapping_System_Albers | 3665 | USA - Texas | 25.83 | -106.66 | 36.5 | -93.5 |
| NAD_1983_NSRS2007_Texas_Centric_ Mapping_System_Lambert | 3666 | USA - Texas | 25.83 | -106.66 | 36.5 | -93.5 |
| NAD_1983_NSRS2007_UTM_Zone_10N | 3717 | USA - 126°W to 120°W | 30.54 | -126 | 49.09 | -119.99 |
| NAD_1983_NSRS2007_UTM_Zone_11N | 3718 | USA - 120°W to 114°W | 30.88 | -120 | 49.01 | -114 |
| NAD_1983_NSRS2007_UTM_Zone_12N | 3719 | USA - 114°W to 108°W | 31.33 | -114 | 49.01 | -108 |
| NAD_1983_NSRS2007_UTM_Zone_13N | 3720 | USA - 108°W to 102°W | 28.98 | -108 | 49.01 | -102 |
| NAD_1983_NSRS2007_UTM_Zone_14N | 3721 | USA - 102°W to 96°W | 25.83 | -102 | 49.01 | -96 |
| NAD_1983_NSRS2007_UTM_Zone_15N | 3722 | USA - 96°W to 90°W | 25.61 | -96.01 | 49.38 | -90 |
| NAD_1983_NSRS2007_UTM_Zone_16N | 3723 | USA - 90°W to 84°W | 23.97 | -90 | 48.32 | -84 |
| NAD_1983_NSRS2007_UTM_Zone_17N | 3724 | USA - 84°W to 78°W | 23.81 | -84 | 46.13 | -78 |
| NAD_1983_NSRS2007_UTM_Zone_18N | 3725 | USA - 78°W to 72°W | 28.28 | -78 | 45.03 | -72 |
| NAD_1983_NSRS2007_UTM_Zone_19N | 3726 | USA - 72°W to 66°W | 33.61 | -72 | 47.47 | -65.99 |
| NAD_1983_NSRS2007_UTM_Zone_1N | 3708 | USA - 180°W to 174°W - AK, OCS | 47.88 | -180 | 63.21 | -173.99 |
| NAD_1983_NSRS2007_UTM_Zone_20N | 102044 | Caribbean - Puerto Rico and US Virgin Islands | 14.92 | -68.49 | 21.86 | -63.88 |
| NAD_1983_NSRS2007_UTM_Zone_2N | 3709 | USA - 174°W to 168°W - AK, OCS | 48.66 | -174 | 73.05 | -167.99 |
| NAD_1983_NSRS2007_UTM_Zone_3N | 3710 | USA - 168°W to 162°W - AK, OCS | 49.52 | -168 | 74.29 | -161.99 |
| NAD_1983_NSRS2007_UTM_Zone_4N | 3711 | USA - 162°W to 156°W - AK, OCS | 50.98 | -162 | 74.71 | -155.99 |
| NAD_1983_NSRS2007_UTM_Zone_59N | 3706 | USA - west of 174°E - AK, OCS | 49.01 | 167.65 | 56.28 | 174.01 |
| NAD_1983_NSRS2007_UTM_Zone_5N | 3712 | USA - 156°W to 150°W - AK, OCS | 52.15 | -156 | 74.71 | -149.99 |
| NAD_1983_NSRS2007_UTM_Zone_60N | 3707 | USA - 174°E to 180°E - AK, OCS | 47.92 | 174 | 56.67 | 180 |
| NAD_1983_NSRS2007_UTM_Zone_6N | 3713 | USA - 150°W to 144°W - AK, OCS | 54.05 | -150 | 74.13 | -143.99 |
| NAD_1983_NSRS2007_UTM_Zone_7N | 3714 | USA - 144°W to 138°W | 53.47 | -144 | 73.59 | -137.99 |
| NAD_1983_NSRS2007_UTM_Zone_8N | 3715 | USA - 138°W to 132°W | 53.6 | -138 | 73.04 | -131.99 |
| NAD_1983_NSRS2007_UTM_Zone_9N | 3716 | USA - 132°W to 126°W | 35.38 | -132 | 56.84 | -126 |
| NAD_1983_NSRS2007_Virginia_Lambert | 3970 | USA - Virginia | 36.54 | -83.68 | 39.46 | -75.31 |
| NAD_1983_NSRS2007_Wisconsin_TM | 3701 | USA - Wisconsin | 42.48 | -92.89 | 47.31 | -86.25 |
| NAD_1983_NSRS2007_Wisconsin_TM_US _Ft | 102217 | USA - Wisconsin | 42.48 | -92.89 | 47.31 | -86.25 |
| NAD_1983_Ontario_MNR_Lambert | 3161 | Canada - Ontario | 41.67 | -95.16 | 56.9 | -74.35 |
| NAD_1983_Oregon_Statewide_Lambert | 2991 | USA - Oregon | 41.98 | -124.6 | 46.26 | -116.47 |
| NAD_1983_Oregon_Statewide_Lambert_ Feet_Intl | 2992 | USA - Oregon | 41.98 | -124.6 | 46.26 | -116.47 |
| NAD_1983_PA11_StatePlane_Hawaii_1_ FIPS_5101 | 6628 | USA - Hawaii - island of Hawaii - onshore | 18.87 | -156.1 | 20.33 | -154.74 |
| NAD_1983_PA11_StatePlane_Hawaii_1_ FIPS_5101_Feet | 102525 | USA - Hawaii - island of Hawaii - onshore | 18.87 | -156.1 | 20.33 | -154.74 |
| NAD_1983_PA11_StatePlane_Hawaii_2_ FIPS_5102 | 6629 | USA - Hawaii - Maui; Kahoolawe; Lanai; Molokai - onshore | 20.45 | -157.36 | 21.26 | -155.93 |
| NAD_1983_PA11_StatePlane_Hawaii_2_ FIPS_5102_Feet | 102526 | USA - Hawaii - Maui; Kahoolawe; Lanai; Molokai - onshore | 20.45 | -157.36 | 21.26 | -155.93 |
| NAD_1983_PA11_StatePlane_Hawaii_3_ FIPS_5103 | 6630 | USA - Hawaii - Oahu - onshore | 21.2 | -158.33 | 21.75 | -157.61 |
| NAD_1983_PA11_StatePlane_Hawaii_3_ FIPS_5103_Feet | 6633 | USA - Hawaii - Oahu - onshore | 21.2 | -158.33 | 21.75 | -157.61 |
| NAD_1983_PA11_StatePlane_Hawaii_4_ FIPS_5104 | 6631 | USA - Hawaii - Kauai - onshore | 21.81 | -159.85 | 22.29 | -159.23 |
| NAD_1983_PA11_StatePlane_Hawaii_4_ FIPS_5104_Feet | 102528 | USA - Hawaii - Kauai - onshore | 21.81 | -159.85 | 22.29 | -159.23 |
| NAD_1983_PA11_StatePlane_Hawaii_5_ FIPS_5105 | 6632 | USA - Hawaii - Niihau - onshore | 21.73 | -160.3 | 22.07 | -159.99 |
| NAD_1983_PA11_StatePlane_Hawaii_5_ FIPS_5105_Feet | 102529 | USA - Hawaii - Niihau - onshore | 21.73 | -160.3 | 22.07 | -159.99 |
| NAD_1983_PA11_UTM_Zone_2S | 6636 | American Samoa - 2 main island groups and Rose Island | -14.59 | -170.88 | -14.11 | -168.09 |
| NAD_1983_PA11_UTM_Zone_4N | 6634 | USA - 162°W to 156°W onshore - HI | 19.51 | -160.3 | 22.29 | -156 |
| NAD_1983_PA11_UTM_Zone_5N | 6635 | USA - 156°W to 150°W onshore - HI | 18.87 | -156 | 20.86 | -154.74 |
| NAD_1983_PACP00_UTM_Zone_2S | 102703 | American Samoa - 2 main island groups and Rose Island | -14.59 | -170.88 | -14.11 | -168.09 |
| NAD_1983_PACP00_UTM_Zone_4N | 102701 | USA - 162°W to 156°W onshore - HI | 19.51 | -160.3 | 22.29 | -156 |
| NAD_1983_PACP00_UTM_Zone_5N | 102702 | USA - 156°W to 150°W onshore - HI | 18.87 | -156 | 20.86 | -154.74 |
| NAD_1983_Quebec_Albers | 6623 | Canada - Quebec | 44.99 | -79.85 | 62.62 | -57.1 |
| NAD_1983_Quebec_Lambert | 32198 | Canada - Quebec | 44.99 | -79.85 | 62.62 | -57.1 |
| NAD_1983_StatePlane_Alabama_East_ FIPS_0101 | 26929 | USA - Alabama - SPCS - E | 30.99 | -86.79 | 35 | -84.89 |
| NAD_1983_StatePlane_Alabama_East_ FIPS_0101_Feet | 102629 | USA - Alabama - SPCS - E | 30.99 | -86.79 | 35 | -84.89 |
| NAD_1983_StatePlane_Alabama_West_ FIPS_0102 | 26930 | USA - Alabama - SPCS - W | 30.14 | -88.48 | 35.02 | -86.3 |
| NAD_1983_StatePlane_Alabama_West_ FIPS_0102_Feet | 102630 | USA - Alabama - SPCS - W | 30.14 | -88.48 | 35.02 | -86.3 |
| NAD_1983_StatePlane_Alaska_10_FIPS_ 5010 | 26940 | USA - Alaska - Aleutian Islands | 51.3 | 172.42 | 54.34 | -164.84 |
| NAD_1983_StatePlane_Alaska_10_FIPS_ 5010_Feet | 102640 | USA - Alaska - Aleutian Islands | 51.3 | 172.42 | 54.34 | -164.84 |
| NAD_1983_StatePlane_Alaska_1_FIPS_ 5001 | 26931 | USA - Alaska - Panhandle | 54.61 | -141 | 60.35 | -129.99 |
| NAD_1983_StatePlane_Alaska_1_FIPS_ 5001_Feet | 102631 | USA - Alaska - Panhandle | 54.61 | -141 | 60.35 | -129.99 |
| NAD_1983_StatePlane_Alaska_2_FIPS_ 5002 | 26932 | USA - Alaska - 144°W to 141°W | 59.72 | -144.01 | 70.16 | -140.98 |
| NAD_1983_StatePlane_Alaska_2_FIPS_ 5002_Feet | 102632 | USA - Alaska - 144°W to 141°W | 59.72 | -144.01 | 70.16 | -140.98 |
| NAD_1983_StatePlane_Alaska_3_FIPS_ 5003 | 26933 | USA - Alaska - 148°W to 144°W | 59.72 | -148 | 70.38 | -144 |
| NAD_1983_StatePlane_Alaska_3_FIPS_ 5003_Feet | 102633 | USA - Alaska - 148°W to 144°W | 59.72 | -148 | 70.38 | -144 |
| NAD_1983_StatePlane_Alaska_4_FIPS_ 5004 | 26934 | USA - Alaska - 152°W to 148°W | 59.11 | -152.01 | 70.63 | -147.99 |
| NAD_1983_StatePlane_Alaska_4_FIPS_ 5004_Feet | 102634 | USA - Alaska - 152°W to 148°W | 59.11 | -152.01 | 70.63 | -147.99 |
| NAD_1983_StatePlane_Alaska_5_FIPS_ 5005 | 26935 | USA - Alaska - 156°W to 152°W | 55.72 | -156 | 71.28 | -151.86 |
| NAD_1983_StatePlane_Alaska_5_FIPS_ 5005_Feet | 102635 | USA - Alaska - 156°W to 152°W | 55.72 | -156 | 71.28 | -151.86 |
| NAD_1983_StatePlane_Alaska_6_FIPS_ 5006 | 26936 | USA - Alaska - 160°W to 156°W | 54.89 | -160 | 71.4 | -155.99 |
| NAD_1983_StatePlane_Alaska_6_FIPS_ 5006_Feet | 102636 | USA - Alaska - 160°W to 156°W | 54.89 | -160 | 71.4 | -155.99 |
| NAD_1983_StatePlane_Alaska_7_FIPS_ 5007 | 26937 | USA - Alaska - 164°W to 160°W | 54.32 | -164.01 | 70.74 | -160 |
| NAD_1983_StatePlane_Alaska_7_FIPS_ 5007_Feet | 102637 | USA - Alaska - 164°W to 160°W | 54.32 | -164.01 | 70.74 | -160 |
| NAD_1983_StatePlane_Alaska_8_FIPS_ 5008 | 26938 | USA - Alaska - north of 54.5°N; 168°W to 164°W | 54.34 | -168.26 | 69.05 | -164 |
| NAD_1983_StatePlane_Alaska_8_FIPS_ 5008_Feet | 102638 | USA - Alaska - north of 54.5°N; 168°W to 164°W | 54.34 | -168.26 | 69.05 | -164 |
| NAD_1983_StatePlane_Alaska_9_FIPS_ 5009 | 26939 | USA - Alaska - north of 54.5°N; west of 168°W | 56.49 | -173.16 | 65.82 | -168 |
| NAD_1983_StatePlane_Alaska_9_FIPS_ 5009_Feet | 102639 | USA - Alaska - north of 54.5°N; west of 168°W | 56.49 | -173.16 | 65.82 | -168 |
| NAD_1983_StatePlane_Arizona_Central_ FIPS_0202 | 26949 | USA - Arizona - SPCS - C | 31.33 | -113.35 | 37.01 | -110.44 |
| NAD_1983_StatePlane_Arizona_Central_ FIPS_0202_Feet | 102649 | USA - Arizona - SPCS - C | 31.33 | -113.35 | 37.01 | -110.44 |
| NAD_1983_StatePlane_Arizona_Central_ FIPS_0202_Feet_Intl | 2223 | USA - Arizona - SPCS - C | 31.33 | -113.35 | 37.01 | -110.44 |
| NAD_1983_StatePlane_Arizona_East_ FIPS_0201 | 26948 | USA - Arizona - SPCS - E | 31.33 | -111.71 | 37.01 | -109.04 |
| NAD_1983_StatePlane_Arizona_East_ FIPS_0201_Feet | 102648 | USA - Arizona - SPCS - E | 31.33 | -111.71 | 37.01 | -109.04 |
| NAD_1983_StatePlane_Arizona_East_ FIPS_0201_Feet_Intl | 2222 | USA - Arizona - SPCS - E | 31.33 | -111.71 | 37.01 | -109.04 |
| NAD_1983_StatePlane_Arizona_West_ FIPS_0203 | 26950 | USA - Arizona - SPCS - W | 32.05 | -114.81 | 37 | -112.52 |
| NAD_1983_StatePlane_Arizona_West_ FIPS_0203_Feet | 102650 | USA - Arizona - SPCS - W | 32.05 | -114.81 | 37 | -112.52 |
| NAD_1983_StatePlane_Arizona_West_ FIPS_0203_Feet_Intl | 2224 | USA - Arizona - SPCS - W | 32.05 | -114.81 | 37 | -112.52 |
| NAD_1983_StatePlane_Arkansas_North_ FIPS_0301 | 26951 | USA - Arkansas - SPCS - N | 34.67 | -94.62 | 36.5 | -89.64 |
| NAD_1983_StatePlane_Arkansas_North_ FIPS_0301_Feet | 3433 | USA - Arkansas - SPCS - N | 34.67 | -94.62 | 36.5 | -89.64 |
| NAD_1983_StatePlane_Arkansas_South_ FIPS_0302 | 26952 | USA - Arkansas - SPCS - S | 33.01 | -94.48 | 35.1 | -90.4 |
| NAD_1983_StatePlane_Arkansas_South_ FIPS_0302_Feet | 3434 | USA - Arkansas - SPCS - S | 33.01 | -94.48 | 35.1 | -90.4 |
| NAD_1983_StatePlane_California_I_FIPS_ 0401 | 26941 | USA - California - SPCS - 1 | 39.59 | -124.45 | 42.01 | -119.99 |
| NAD_1983_StatePlane_California_I_FIPS_ 0401_Feet | 2225 | USA - California - SPCS - 1 | 39.59 | -124.45 | 42.01 | -119.99 |
| NAD_1983_StatePlane_California_II_FIPS _0402 | 26942 | USA - California - SPCS - 2 | 38.02 | -124.06 | 40.16 | -119.54 |
| NAD_1983_StatePlane_California_II_FIPS _0402_Feet | 2226 | USA - California - SPCS - 2 | 38.02 | -124.06 | 40.16 | -119.54 |
| NAD_1983_StatePlane_California_III_FIPS _0403 | 26943 | USA - California - SPCS - 3 | 36.73 | -123.02 | 38.71 | -117.83 |
| NAD_1983_StatePlane_California_III_FIPS _0403_Feet | 2227 | USA - California - SPCS - 3 | 36.73 | -123.02 | 38.71 | -117.83 |
| NAD_1983_StatePlane_California_IV_FIPS _0404 | 26944 | USA - California - SPCS - 4 | 35.78 | -122.01 | 37.58 | -115.62 |
| NAD_1983_StatePlane_California_IV_FIPS _0404_Feet | 2228 | USA - California - SPCS - 4 | 35.78 | -122.01 | 37.58 | -115.62 |
| NAD_1983_StatePlane_California_V_FIPS _0405 | 26945 | USA - California - SPCS83 - 5 | 32.76 | -121.42 | 35.81 | -114.12 |
| NAD_1983_StatePlane_California_V_FIPS _0405_Feet | 2229 | USA - California - SPCS83 - 5 | 32.76 | -121.42 | 35.81 | -114.12 |
| NAD_1983_StatePlane_California_VI_FIPS _0406 | 26946 | USA - California - SPCS - 6 | 32.53 | -118.15 | 34.08 | -114.42 |
| NAD_1983_StatePlane_California_VI_FIPS _0406_Feet | 2230 | USA - California - SPCS - 6 | 32.53 | -118.15 | 34.08 | -114.42 |
| NAD_1983_StatePlane_Colorado_Central _FIPS_0502 | 26954 | USA - Colorado - SPCS - C | 38.14 | -109.06 | 40.09 | -102.04 |
| NAD_1983_StatePlane_Colorado_Central _FIPS_0502_Feet | 2232 | USA - Colorado - SPCS - C | 38.14 | -109.06 | 40.09 | -102.04 |
| NAD_1983_StatePlane_Colorado_North_ FIPS_0501 | 26953 | USA - Colorado - SPCS - N | 39.56 | -109.06 | 41.01 | -102.04 |
| NAD_1983_StatePlane_Colorado_North_ FIPS_0501_Feet | 2231 | USA - Colorado - SPCS - N | 39.56 | -109.06 | 41.01 | -102.04 |
| NAD_1983_StatePlane_Colorado_South_ FIPS_0503 | 26955 | USA - Colorado - SPCS - S | 36.98 | -109.06 | 38.68 | -102.04 |
| NAD_1983_StatePlane_Colorado_South_ FIPS_0503_Feet | 2233 | USA - Colorado - SPCS - S | 36.98 | -109.06 | 38.68 | -102.04 |
| NAD_1983_StatePlane_Connecticut_FIPS _0600 | 26956 | USA - Connecticut | 40.98 | -73.73 | 42.05 | -71.78 |
| NAD_1983_StatePlane_Connecticut_FIPS _0600_Feet | 2234 | USA - Connecticut | 40.98 | -73.73 | 42.05 | -71.78 |
| NAD_1983_StatePlane_Delaware_FIPS_ 0700 | 26957 | USA - Delaware | 38.44 | -75.8 | 39.85 | -74.97 |
| NAD_1983_StatePlane_Delaware_FIPS_ 0700_Feet | 2235 | USA - Delaware | 38.44 | -75.8 | 39.85 | -74.97 |
| NAD_1983_StatePlane_Florida_East_FIPS _0901 | 26958 | USA - Florida - SPCS - E | 24.41 | -82.33 | 30.83 | -79.97 |
| NAD_1983_StatePlane_Florida_East_FIPS _0901_Feet | 2236 | USA - Florida - SPCS - E | 24.41 | -82.33 | 30.83 | -79.97 |
| NAD_1983_StatePlane_Florida_North_ FIPS_0903 | 26960 | USA - Florida - SPCS - N | 29.21 | -87.63 | 31.01 | -82.04 |
| NAD_1983_StatePlane_Florida_North_ FIPS_0903_Feet | 2238 | USA - Florida - SPCS - N | 29.21 | -87.63 | 31.01 | -82.04 |
| NAD_1983_StatePlane_Florida_West_ FIPS_0902 | 26959 | USA - Florida - SPCS - W | 26.27 | -83.34 | 29.6 | -81.13 |
| NAD_1983_StatePlane_Florida_West_ FIPS_0902_Feet | 2237 | USA - Florida - SPCS - W | 26.27 | -83.34 | 29.6 | -81.13 |
| NAD_1983_StatePlane_Georgia_East_ FIPS_1001 | 26966 | USA - Georgia - SPCS - E | 30.36 | -83.47 | 34.68 | -80.77 |
| NAD_1983_StatePlane_Georgia_East_ FIPS_1001_Feet | 2239 | USA - Georgia - SPCS - E | 30.36 | -83.47 | 34.68 | -80.77 |
| NAD_1983_StatePlane_Georgia_West_ FIPS_1002 | 26967 | USA - Georgia - SPCS - W | 30.62 | -85.61 | 35.01 | -82.99 |
| NAD_1983_StatePlane_Georgia_West_ FIPS_1002_Feet | 2240 | USA - Georgia - SPCS - W | 30.62 | -85.61 | 35.01 | -82.99 |
| NAD_1983_StatePlane_Guam_FIPS_5400 | 65161 | Guam | 10.95 | 141.19 | 15.91 | 148.18 |
| NAD_1983_StatePlane_Guam_FIPS_5400 _Feet | 102766 | Guam | 10.95 | 141.19 | 15.91 | 148.18 |
| NAD_1983_StatePlane_Hawaii_1_FIPS_ 5101 | 26961 | USA - Hawaii - island of Hawaii - onshore | 18.87 | -156.1 | 20.33 | -154.74 |
| NAD_1983_StatePlane_Hawaii_1_FIPS_ 5101_Feet | 102661 | USA - Hawaii - island of Hawaii - onshore | 18.87 | -156.1 | 20.33 | -154.74 |
| NAD_1983_StatePlane_Hawaii_2_FIPS_ 5102 | 26962 | USA - Hawaii - Maui; Kahoolawe; Lanai; Molokai - onshore | 20.45 | -157.36 | 21.26 | -155.93 |
| NAD_1983_StatePlane_Hawaii_2_FIPS_ 5102_Feet | 102662 | USA - Hawaii - Maui; Kahoolawe; Lanai; Molokai - onshore | 20.45 | -157.36 | 21.26 | -155.93 |
| NAD_1983_StatePlane_Hawaii_3_FIPS_ 5103 | 26963 | USA - Hawaii - Oahu - onshore | 21.2 | -158.33 | 21.75 | -157.61 |
| NAD_1983_StatePlane_Hawaii_3_FIPS_ 5103_Feet | 3759 | USA - Hawaii - Oahu - onshore | 21.2 | -158.33 | 21.75 | -157.61 |
| NAD_1983_StatePlane_Hawaii_4_FIPS_ 5104 | 26964 | USA - Hawaii - Kauai - onshore | 21.81 | -159.85 | 22.29 | -159.23 |
| NAD_1983_StatePlane_Hawaii_4_FIPS_ 5104_Feet | 102664 | USA - Hawaii - Kauai - onshore | 21.81 | -159.85 | 22.29 | -159.23 |
| NAD_1983_StatePlane_Hawaii_5_FIPS_ 5105 | 26965 | USA - Hawaii - Niihau - onshore | 21.73 | -160.3 | 22.07 | -159.99 |
| NAD_1983_StatePlane_Hawaii_5_FIPS_ 5105_Feet | 102665 | USA - Hawaii - Niihau - onshore | 21.73 | -160.3 | 22.07 | -159.99 |
| NAD_1983_StatePlane_Idaho_Central_ FIPS_1102 | 26969 | USA - Idaho - SPCS - C | 41.99 | -115.3 | 45.7 | -112.68 |
| NAD_1983_StatePlane_Idaho_Central_ FIPS_1102_Feet | 2242 | USA - Idaho - SPCS - C | 41.99 | -115.3 | 45.7 | -112.68 |
| NAD_1983_StatePlane_Idaho_East_FIPS_ 1101 | 26968 | USA - Idaho - SPCS - E | 41.99 | -113.24 | 44.75 | -111.04 |
| NAD_1983_StatePlane_Idaho_East_FIPS_ 1101_Feet | 2241 | USA - Idaho - SPCS - E | 41.99 | -113.24 | 44.75 | -111.04 |
| NAD_1983_StatePlane_Idaho_West_FIPS _1103 | 26970 | USA - Idaho - SPCS - W | 41.99 | -117.24 | 49.01 | -114.32 |
| NAD_1983_StatePlane_Idaho_West_FIPS _1103_Feet | 2243 | USA - Idaho - SPCS - W | 41.99 | -117.24 | 49.01 | -114.32 |
| NAD_1983_StatePlane_Illinois_East_FIPS _1201 | 26971 | USA - Illinois - SPCS - E | 37.06 | -89.28 | 42.5 | -87.02 |
| NAD_1983_StatePlane_Illinois_East_FIPS _1201_Feet | 3435 | USA - Illinois - SPCS - E | 37.06 | -89.28 | 42.5 | -87.02 |
| NAD_1983_StatePlane_Illinois_West_FIPS _1202 | 26972 | USA - Illinois - SPCS - W | 36.98 | -91.52 | 42.51 | -88.93 |
| NAD_1983_StatePlane_Illinois_West_FIPS _1202_Feet | 3436 | USA - Illinois - SPCS - W | 36.98 | -91.52 | 42.51 | -88.93 |
| NAD_1983_StatePlane_Indiana_East_FIPS _1301 | 26973 | USA - Indiana - SPCS - E | 37.95 | -86.59 | 41.77 | -84.78 |
| NAD_1983_StatePlane_Indiana_East_FIPS _1301_Feet | 2965 | USA - Indiana - SPCS - E | 37.95 | -86.59 | 41.77 | -84.78 |
| NAD_1983_StatePlane_Indiana_West_ FIPS_1302 | 26974 | USA - Indiana - SPCS - W | 37.77 | -88.06 | 41.77 | -86.24 |
| NAD_1983_StatePlane_Indiana_West_ FIPS_1302_Feet | 2966 | USA - Indiana - SPCS - W | 37.77 | -88.06 | 41.77 | -86.24 |
| NAD_1983_StatePlane_Iowa_North_FIPS _1401 | 26975 | USA - Iowa - SPCS - N | 41.85 | -96.65 | 43.51 | -90.15 |
| NAD_1983_StatePlane_Iowa_North_FIPS _1401_Feet | 3417 | USA - Iowa - SPCS - N | 41.85 | -96.65 | 43.51 | -90.15 |
| NAD_1983_StatePlane_Iowa_South_FIPS _1402 | 26976 | USA - Iowa - SPCS - S | 40.37 | -96.14 | 42.04 | -90.14 |
| NAD_1983_StatePlane_Iowa_South_FIPS _1402_Feet | 3418 | USA - Iowa - SPCS - S | 40.37 | -96.14 | 42.04 | -90.14 |
| NAD_1983_StatePlane_Kansas_North_ FIPS_1501 | 26977 | USA - Kansas - SPCS - N | 38.52 | -102.06 | 40.01 | -94.58 |
| NAD_1983_StatePlane_Kansas_North_ FIPS_1501_Feet | 3419 | USA - Kansas - SPCS - N | 38.52 | -102.06 | 40.01 | -94.58 |
| NAD_1983_StatePlane_Kansas_South_ FIPS_1502 | 26978 | USA - Kansas - SPCS - S | 36.99 | -102.05 | 38.88 | -94.6 |
| NAD_1983_StatePlane_Kansas_South_ FIPS_1502_Feet | 3420 | USA - Kansas - SPCS - S | 36.99 | -102.05 | 38.88 | -94.6 |
| NAD_1983_StatePlane_Kentucky_FIPS_ 1600 | 3088 | USA - Kentucky | 36.49 | -89.57 | 39.15 | -81.95 |
| NAD_1983_StatePlane_Kentucky_FIPS_ 1600_Feet | 3089 | USA - Kentucky | 36.49 | -89.57 | 39.15 | -81.95 |
| NAD_1983_StatePlane_Kentucky_North_ FIPS_1601 | 2205 | USA - Kentucky - SPCS - N | 37.71 | -85.96 | 39.15 | -82.47 |
| NAD_1983_StatePlane_Kentucky_North_ FIPS_1601_Feet | 2246 | USA - Kentucky - SPCS - N | 37.71 | -85.96 | 39.15 | -82.47 |
| NAD_1983_StatePlane_Kentucky_South_ FIPS_1602 | 26980 | USA - Kentucky - SPCS - S | 36.49 | -89.57 | 38.17 | -81.95 |
| NAD_1983_StatePlane_Kentucky_South_ FIPS_1602_Feet | 2247 | USA - Kentucky - SPCS - S | 36.49 | -89.57 | 38.17 | -81.95 |
| NAD_1983_StatePlane_Louisiana_North_ FIPS_1701 | 26981 | USA - Louisiana - SPCS - N | 30.85 | -94.05 | 33.03 | -90.86 |
| NAD_1983_StatePlane_Louisiana_North_ FIPS_1701_Feet | 3451 | USA - Louisiana - SPCS - N | 30.85 | -94.05 | 33.03 | -90.86 |
| NAD_1983_StatePlane_Louisiana_ Offshore_FIPS_1703 | 32199 | USA - Louisiana | 28.85 | -94.05 | 33.03 | -88.75 |
| NAD_1983_StatePlane_Louisiana_ Offshore_FIPS_1703_Feet | 3453 | USA - Louisiana | 28.85 | -94.05 | 33.03 | -88.75 |
| NAD_1983_StatePlane_Louisiana_South_ FIPS_1702 | 26982 | USA - Louisiana - SPCS83 - S | 28.85 | -93.94 | 31.07 | -88.75 |
| NAD_1983_StatePlane_Louisiana_South_ FIPS_1702_Feet | 3452 | USA - Louisiana - SPCS83 - S | 28.85 | -93.94 | 31.07 | -88.75 |
| NAD_1983_StatePlane_Maine_East_FIPS _1801 | 26983 | USA - Maine - SPCS - E | 43.88 | -70.03 | 47.47 | -66.91 |
| NAD_1983_StatePlane_Maine_East_FIPS _1801_Feet | 26847 | USA - Maine - SPCS - E | 43.88 | -70.03 | 47.47 | -66.91 |
| NAD_1983_StatePlane_Maine_West_FIPS _1802 | 26984 | USA - Maine - SPCS - W | 43.04 | -71.09 | 46.58 | -69.26 |
| NAD_1983_StatePlane_Maine_West_FIPS _1802_Feet | 26848 | USA - Maine - SPCS - W | 43.04 | -71.09 | 46.58 | -69.26 |
| NAD_1983_StatePlane_Maryland_FIPS_ 1900 | 26985 | USA - Maryland | 37.97 | -79.49 | 39.73 | -74.97 |
| NAD_1983_StatePlane_Maryland_FIPS_ 1900_Feet | 2248 | USA - Maryland | 37.97 | -79.49 | 39.73 | -74.97 |
| NAD_1983_StatePlane_Massachusetts_ Island_FIPS_2002 | 26987 | USA - Massachusetts - SPCS - islands | 41.19 | -70.91 | 41.51 | -69.89 |
| NAD_1983_StatePlane_Massachusetts_ Island_FIPS_2002_Feet | 2250 | USA - Massachusetts - SPCS - islands | 41.19 | -70.91 | 41.51 | -69.89 |
| NAD_1983_StatePlane_Massachusetts_ Mainland_FIPS_2001 | 26986 | USA - Massachusetts - SPCS - mainland | 41.46 | -73.5 | 42.89 | -69.86 |
| NAD_1983_StatePlane_Massachusetts_ Mainland_FIPS_2001_Feet | 2249 | USA - Massachusetts - SPCS - mainland | 41.46 | -73.5 | 42.89 | -69.86 |
| NAD_1983_StatePlane_Michigan_Central _FIPS_2112 | 26989 | USA - Michigan - SPCS - C | 43.8 | -87.06 | 45.92 | -82.27 |
| NAD_1983_StatePlane_Michigan_Central _FIPS_2112_Feet | 102689 | USA - Michigan - SPCS - C | 43.8 | -87.06 | 45.92 | -82.27 |
| NAD_1983_StatePlane_Michigan_Central _FIPS_2112_Feet_Intl | 2252 | USA - Michigan - SPCS - C | 43.8 | -87.06 | 45.92 | -82.27 |
| NAD_1983_StatePlane_Michigan_North_ FIPS_2111 | 26988 | USA - Michigan - SPCS - N | 45.08 | -90.42 | 48.32 | -83.44 |
| NAD_1983_StatePlane_Michigan_North_ FIPS_2111_Feet | 102688 | USA - Michigan - SPCS - N | 45.08 | -90.42 | 48.32 | -83.44 |
| NAD_1983_StatePlane_Michigan_North_ FIPS_2111_Feet_Intl | 2251 | USA - Michigan - SPCS - N | 45.08 | -90.42 | 48.32 | -83.44 |
| NAD_1983_StatePlane_Michigan_South_ FIPS_2113 | 26990 | USA - Michigan - SPCS - S | 41.69 | -87.2 | 44.22 | -82.13 |
| NAD_1983_StatePlane_Michigan_South_ FIPS_2113_Feet | 102690 | USA - Michigan - SPCS - S | 41.69 | -87.2 | 44.22 | -82.13 |
| NAD_1983_StatePlane_Michigan_South_ FIPS_2113_Feet_Intl | 2253 | USA - Michigan - SPCS - S | 41.69 | -87.2 | 44.22 | -82.13 |
| NAD_1983_StatePlane_Minnesota_ Central_FIPS_2202 | 26992 | USA - Minnesota - SPCS - C | 45.28 | -96.86 | 47.48 | -92.29 |
| NAD_1983_StatePlane_Minnesota_ Central_FIPS_2202_Feet | 26850 | USA - Minnesota - SPCS - C | 45.28 | -96.86 | 47.48 | -92.29 |
| NAD_1983_StatePlane_Minnesota_North _FIPS_2201 | 26991 | USA - Minnesota - SPCS - N | 46.64 | -97.22 | 49.38 | -89.49 |
| NAD_1983_StatePlane_Minnesota_North _FIPS_2201_Feet | 26849 | USA - Minnesota - SPCS - N | 46.64 | -97.22 | 49.38 | -89.49 |
| NAD_1983_StatePlane_Minnesota_South _FIPS_2203 | 26993 | USA - Minnesota - SPCS - S | 43.49 | -96.85 | 45.59 | -91.21 |
| NAD_1983_StatePlane_Minnesota_South _FIPS_2203_Feet | 26851 | USA - Minnesota - SPCS - S | 43.49 | -96.85 | 45.59 | -91.21 |
| NAD_1983_StatePlane_Mississippi_East_ FIPS_2301 | 26994 | USA - Mississippi - SPCS - E | 30.01 | -89.97 | 35.01 | -88.09 |
| NAD_1983_StatePlane_Mississippi_East_ FIPS_2301_Feet | 2254 | USA - Mississippi - SPCS - E | 30.01 | -89.97 | 35.01 | -88.09 |
| NAD_1983_StatePlane_Mississippi_West _FIPS_2302 | 26995 | USA - Mississippi - SPCS - W | 31 | -91.65 | 35.01 | -89.37 |
| NAD_1983_StatePlane_Mississippi_West _FIPS_2302_Feet | 2255 | USA - Mississippi - SPCS - W | 31 | -91.65 | 35.01 | -89.37 |
| NAD_1983_StatePlane_Missouri_Central _FIPS_2402 | 26997 | USA - Missouri - SPCS - C | 36.48 | -93.79 | 40.61 | -91.41 |
| NAD_1983_StatePlane_Missouri_Central _FIPS_2402_Feet | 102697 | USA - Missouri - SPCS - C | 36.48 | -93.79 | 40.61 | -91.41 |
| NAD_1983_StatePlane_Missouri_East_ FIPS_2401 | 26996 | USA - Missouri - SPCS - E | 35.98 | -91.97 | 40.61 | -89.1 |
| NAD_1983_StatePlane_Missouri_East_ FIPS_2401_Feet | 102696 | USA - Missouri - SPCS - E | 35.98 | -91.97 | 40.61 | -89.1 |
| NAD_1983_StatePlane_Missouri_West_ FIPS_2403 | 26998 | USA - Missouri - SPCS - W | 36.48 | -95.77 | 40.59 | -93.48 |
| NAD_1983_StatePlane_Missouri_West_ FIPS_2403_Feet | 102698 | USA - Missouri - SPCS - W | 36.48 | -95.77 | 40.59 | -93.48 |
| NAD_1983_StatePlane_Montana_FIPS_ 2500 | 32100 | USA - Montana | 44.35 | -116.07 | 49.01 | -104.04 |
| NAD_1983_StatePlane_Montana_FIPS_ 2500_Feet | 102700 | USA - Montana | 44.35 | -116.07 | 49.01 | -104.04 |
| NAD_1983_StatePlane_Montana_FIPS_ 2500_Feet_Intl | 2256 | USA - Montana | 44.35 | -116.07 | 49.01 | -104.04 |
| NAD_1983_StatePlane_Nebraska_FIPS_ 2600 | 32104 | USA - Nebraska | 39.99 | -104.06 | 43.01 | -95.3 |
| NAD_1983_StatePlane_Nebraska_FIPS_ 2600_Feet | 26852 | USA - Nebraska | 39.99 | -104.06 | 43.01 | -95.3 |
| NAD_1983_StatePlane_Nevada_Central_ FIPS_2702 | 32108 | USA - Nevada - SPCS - C | 36 | -118.19 | 41 | -114.99 |
| NAD_1983_StatePlane_Nevada_Central_ FIPS_2702_Feet | 3422 | USA - Nevada - SPCS - C | 36 | -118.19 | 41 | -114.99 |
| NAD_1983_StatePlane_Nevada_East_ FIPS_2701 | 32107 | USA - Nevada - SPCS - E | 34.99 | -117.01 | 42 | -114.03 |
| NAD_1983_StatePlane_Nevada_East_ FIPS_2701_Feet | 3421 | USA - Nevada - SPCS - E | 34.99 | -117.01 | 42 | -114.03 |
| NAD_1983_StatePlane_Nevada_West_ FIPS_2703 | 32109 | USA - Nevada - SPCS - W | 36.95 | -120 | 42 | -116.99 |
| NAD_1983_StatePlane_Nevada_West_ FIPS_2703_Feet | 3423 | USA - Nevada - SPCS - W | 36.95 | -120 | 42 | -116.99 |
| NAD_1983_StatePlane_New_Hampshire_ FIPS_2800 | 32110 | USA - New Hampshire | 42.69 | -72.56 | 45.31 | -70.63 |
| NAD_1983_StatePlane_New_Hampshire_ FIPS_2800_Feet | 3437 | USA - New Hampshire | 42.69 | -72.56 | 45.31 | -70.63 |
| NAD_1983_StatePlane_New_Jersey_FIPS _2900 | 32111 | USA - New Jersey | 38.87 | -75.6 | 41.36 | -73.88 |
| NAD_1983_StatePlane_New_Jersey_FIPS _2900_Feet | 3424 | USA - New Jersey | 38.87 | -75.6 | 41.36 | -73.88 |
| NAD_1983_StatePlane_New_Mexico_ Central_FIPS_3002 | 32113 | USA - New Mexico - SPCS83 - C | 31.78 | -107.73 | 37 | -104.84 |
| NAD_1983_StatePlane_New_Mexico_ Central_FIPS_3002_Feet | 2258 | USA - New Mexico - SPCS83 - C | 31.78 | -107.73 | 37 | -104.84 |
| NAD_1983_StatePlane_New_Mexico_ East_FIPS_3001 | 32112 | USA - New Mexico - SPCS - E | 32 | -105.72 | 37 | -102.99 |
| NAD_1983_StatePlane_New_Mexico_ East_FIPS_3001_Feet | 2257 | USA - New Mexico - SPCS - E | 32 | -105.72 | 37 | -102.99 |
| NAD_1983_StatePlane_New_Mexico_ West_FIPS_3003 | 32114 | USA - New Mexico - SPCS83 - W | 31.33 | -109.06 | 37 | -106.32 |
| NAD_1983_StatePlane_New_Mexico_ West_FIPS_3003_Feet | 2259 | USA - New Mexico - SPCS83 - W | 31.33 | -109.06 | 37 | -106.32 |
| NAD_1983_StatePlane_New_York_ Central_FIPS_3102 | 32116 | USA - New York - SPCS - C | 41.99 | -77.75 | 44.41 | -75.04 |
| NAD_1983_StatePlane_New_York_ Central_FIPS_3102_Feet | 2261 | USA - New York - SPCS - C | 41.99 | -77.75 | 44.41 | -75.04 |
| NAD_1983_StatePlane_New_York_East_ FIPS_3101 | 32115 | USA - New York - SPCS - E | 40.88 | -75.87 | 45.02 | -73.23 |
| NAD_1983_StatePlane_New_York_East_ FIPS_3101_Feet | 2260 | USA - New York - SPCS - E | 40.88 | -75.87 | 45.02 | -73.23 |
| NAD_1983_StatePlane_New_York_Long_ Island_FIPS_3104 | 32118 | USA - New York - SPCS - Long Island | 40.47 | -74.26 | 41.3 | -71.8 |
| NAD_1983_StatePlane_New_York_Long_ Island_FIPS_3104_Feet | 2263 | USA - New York - SPCS - Long Island | 40.47 | -74.26 | 41.3 | -71.8 |
| NAD_1983_StatePlane_New_York_West_ FIPS_3103 | 32117 | USA - New York - SPCS - W | 41.99 | -79.77 | 43.64 | -77.36 |
| NAD_1983_StatePlane_New_York_West_ FIPS_3103_Feet | 2262 | USA - New York - SPCS - W | 41.99 | -79.77 | 43.64 | -77.36 |
| NAD_1983_StatePlane_North_Carolina_ FIPS_3200 | 32119 | USA - North Carolina | 33.83 | -84.33 | 36.59 | -75.38 |
| NAD_1983_StatePlane_North_Carolina_ FIPS_3200_Feet | 2264 | USA - North Carolina | 33.83 | -84.33 | 36.59 | -75.38 |
| NAD_1983_StatePlane_North_Dakota_ North_FIPS_3301 | 32120 | USA - North Dakota - SPCS - N | 47.15 | -104.07 | 49.01 | -96.83 |
| NAD_1983_StatePlane_North_Dakota_ North_FIPS_3301_Feet | 102720 | USA - North Dakota - SPCS - N | 47.15 | -104.07 | 49.01 | -96.83 |
| NAD_1983_StatePlane_North_Dakota_ North_FIPS_3301_Feet_Intl | 2265 | USA - North Dakota - SPCS - N | 47.15 | -104.07 | 49.01 | -96.83 |
| NAD_1983_StatePlane_North_Dakota_ South_FIPS_3302 | 32121 | USA - North Dakota - SPCS - S | 45.93 | -104.05 | 47.83 | -96.55 |
| NAD_1983_StatePlane_North_Dakota_ South_FIPS_3302_Feet | 102721 | USA - North Dakota - SPCS - S | 45.93 | -104.05 | 47.83 | -96.55 |
| NAD_1983_StatePlane_North_Dakota_ South_FIPS_3302_Feet_Intl | 2266 | USA - North Dakota - SPCS - S | 45.93 | -104.05 | 47.83 | -96.55 |
| NAD_1983_StatePlane_Ohio_North_FIPS _3401 | 32122 | USA - Ohio - SPCS - N | 40.1 | -84.81 | 42.33 | -80.51 |
| NAD_1983_StatePlane_Ohio_North_FIPS _3401_Feet | 3734 | USA - Ohio - SPCS - N | 40.1 | -84.81 | 42.33 | -80.51 |
| NAD_1983_StatePlane_Ohio_South_FIPS _3402 | 32123 | USA - Ohio - SPCS - S | 38.4 | -84.83 | 40.36 | -80.7 |
| NAD_1983_StatePlane_Ohio_South_FIPS _3402_Feet | 3735 | USA - Ohio - SPCS - S | 38.4 | -84.83 | 40.36 | -80.7 |
| NAD_1983_StatePlane_Oklahoma_North _FIPS_3501 | 32124 | USA - Oklahoma - SPCS - N | 35.27 | -103 | 37.01 | -94.42 |
| NAD_1983_StatePlane_Oklahoma_North _FIPS_3501_Feet | 2267 | USA - Oklahoma - SPCS - N | 35.27 | -103 | 37.01 | -94.42 |
| NAD_1983_StatePlane_Oklahoma_South _FIPS_3502 | 32125 | USA - Oklahoma - SPCS - S | 33.62 | -100 | 35.57 | -94.42 |
| NAD_1983_StatePlane_Oklahoma_South _FIPS_3502_Feet | 2268 | USA - Oklahoma - SPCS - S | 33.62 | -100 | 35.57 | -94.42 |
| NAD_1983_StatePlane_Oregon_North_ FIPS_3601 | 32126 | USA - Oregon - SPCS - N | 43.95 | -124.17 | 46.26 | -116.47 |
| NAD_1983_StatePlane_Oregon_North_ FIPS_3601_Feet | 102726 | USA - Oregon - SPCS - N | 43.95 | -124.17 | 46.26 | -116.47 |
| NAD_1983_StatePlane_Oregon_North_ FIPS_3601_Feet_Intl | 2269 | USA - Oregon - SPCS - N | 43.95 | -124.17 | 46.26 | -116.47 |
| NAD_1983_StatePlane_Oregon_South_ FIPS_3602 | 32127 | USA - Oregon - SPCS - S | 41.98 | -124.6 | 44.56 | -116.9 |
| NAD_1983_StatePlane_Oregon_South_ FIPS_3602_Feet | 102727 | USA - Oregon - SPCS - S | 41.98 | -124.6 | 44.56 | -116.9 |
| NAD_1983_StatePlane_Oregon_South_ FIPS_3602_Feet_Intl | 2270 | USA - Oregon - SPCS - S | 41.98 | -124.6 | 44.56 | -116.9 |
| NAD_1983_StatePlane_Pennsylvania_ North_FIPS_3701 | 32128 | USA - Pennsylvania - SPCS - N | 40.6 | -80.53 | 42.53 | -74.7 |
| NAD_1983_StatePlane_Pennsylvania_ North_FIPS_3701_Feet | 2271 | USA - Pennsylvania - SPCS - N | 40.6 | -80.53 | 42.53 | -74.7 |
| NAD_1983_StatePlane_Pennsylvania_ South_FIPS_3702 | 32129 | USA - Pennsylvania - SPCS - S | 39.71 | -80.53 | 41.18 | -74.72 |
| NAD_1983_StatePlane_Pennsylvania_ South_FIPS_3702_Feet | 2272 | USA - Pennsylvania - SPCS - S | 39.71 | -80.53 | 41.18 | -74.72 |
| NAD_1983_StatePlane_Puerto_Rico_ Virgin_Islands_FIPS_5200 | 32161 | Caribbean - Puerto Rico and US Virgin Islands | 14.92 | -68.49 | 21.86 | -63.88 |
| NAD_1983_StatePlane_Puerto_Rico_ Virgin_Islands_FIPS_5200_Feet | 102761 | Caribbean - Puerto Rico and US Virgin Islands | 14.92 | -68.49 | 21.86 | -63.88 |
| NAD_1983_StatePlane_Rhode_Island_ FIPS_3800 | 32130 | USA - Rhode Island | 41.13 | -71.85 | 42.02 | -71.08 |
| NAD_1983_StatePlane_Rhode_Island_ FIPS_3800_Feet | 3438 | USA - Rhode Island | 41.13 | -71.85 | 42.02 | -71.08 |
| NAD_1983_StatePlane_South_Carolina_ FIPS_3900 | 32133 | USA - South Carolina | 32.05 | -83.36 | 35.21 | -78.52 |
| NAD_1983_StatePlane_South_Carolina_ FIPS_3900_Feet | 102733 | USA - South Carolina | 32.05 | -83.36 | 35.21 | -78.52 |
| NAD_1983_StatePlane_South_Carolina_ FIPS_3900_Feet_Intl | 2273 | USA - South Carolina | 32.05 | -83.36 | 35.21 | -78.52 |
| NAD_1983_StatePlane_South_Dakota_ North_FIPS_4001 | 32134 | USA - South Dakota - SPCS - N | 44.14 | -104.07 | 45.95 | -96.45 |
| NAD_1983_StatePlane_South_Dakota_ North_FIPS_4001_Feet | 4457 | USA - South Dakota - SPCS - N | 44.14 | -104.07 | 45.95 | -96.45 |
| NAD_1983_StatePlane_South_Dakota_ South_FIPS_4002 | 32135 | USA - South Dakota - SPCS - S | 42.48 | -104.06 | 44.79 | -96.43 |
| NAD_1983_StatePlane_South_Dakota_ South_FIPS_4002_Feet | 3455 | USA - South Dakota - SPCS - S | 42.48 | -104.06 | 44.79 | -96.43 |
| NAD_1983_StatePlane_Tennessee_FIPS_ 4100 | 32136 | USA - Tennessee | 34.98 | -90.31 | 36.68 | -81.65 |
| NAD_1983_StatePlane_Tennessee_FIPS_ 4100_Feet | 2274 | USA - Tennessee | 34.98 | -90.31 | 36.68 | -81.65 |
| NAD_1983_StatePlane_Texas_Central_ FIPS_4203 | 32139 | USA - Texas - SPCS - C | 29.78 | -106.66 | 32.27 | -93.5 |
| NAD_1983_StatePlane_Texas_Central_ FIPS_4203_Feet | 2277 | USA - Texas - SPCS - C | 29.78 | -106.66 | 32.27 | -93.5 |
| NAD_1983_StatePlane_Texas_North_ Central_FIPS_4202 | 32138 | USA - Texas - SPCS - NC | 31.72 | -103.07 | 34.58 | -94 |
| NAD_1983_StatePlane_Texas_North_ Central_FIPS_4202_Feet | 2276 | USA - Texas - SPCS - NC | 31.72 | -103.07 | 34.58 | -94 |
| NAD_1983_StatePlane_Texas_North_FIPS _4201 | 32137 | USA - Texas - SPCS - N | 34.3 | -103.03 | 36.5 | -99.99 |
| NAD_1983_StatePlane_Texas_North_FIPS _4201_Feet | 2275 | USA - Texas - SPCS - N | 34.3 | -103.03 | 36.5 | -99.99 |
| NAD_1983_StatePlane_Texas_South_ Central_FIPS_4204 | 32140 | USA - Texas - SPCS83 - SC | 27.78 | -105 | 30.67 | -93.76 |
| NAD_1983_StatePlane_Texas_South_ Central_FIPS_4204_Feet | 2278 | USA - Texas - SPCS83 - SC | 27.78 | -105 | 30.67 | -93.76 |
| NAD_1983_StatePlane_Texas_South_FIPS _4205 | 32141 | USA - Texas - SPCS83 - S | 25.83 | -100.2 | 28.21 | -96.85 |
| NAD_1983_StatePlane_Texas_South_FIPS _4205_Feet | 2279 | USA - Texas - SPCS83 - S | 25.83 | -100.2 | 28.21 | -96.85 |
| NAD_1983_StatePlane_Utah_Central_ FIPS_4302 | 32143 | USA - Utah - SPCS - C | 38.49 | -114.05 | 41.08 | -109.04 |
| NAD_1983_StatePlane_Utah_Central_ FIPS_4302_Feet | 3566 | USA - Utah - SPCS - C | 38.49 | -114.05 | 41.08 | -109.04 |
| NAD_1983_StatePlane_Utah_Central_ FIPS_4302_Feet_Intl | 2281 | USA - Utah - SPCS - C | 38.49 | -114.05 | 41.08 | -109.04 |
| NAD_1983_StatePlane_Utah_North_FIPS _4301 | 32142 | USA - Utah - SPCS - N | 40.55 | -114.04 | 42.01 | -109.04 |
| NAD_1983_StatePlane_Utah_North_FIPS _4301_Feet | 3560 | USA - Utah - SPCS - N | 40.55 | -114.04 | 42.01 | -109.04 |
| NAD_1983_StatePlane_Utah_North_FIPS _4301_Feet_Intl | 2280 | USA - Utah - SPCS - N | 40.55 | -114.04 | 42.01 | -109.04 |
| NAD_1983_StatePlane_Utah_South_FIPS _4303 | 32144 | USA - Utah - SPCS - S | 36.99 | -114.05 | 38.58 | -109.04 |
| NAD_1983_StatePlane_Utah_South_FIPS _4303_Feet | 3567 | USA - Utah - SPCS - S | 36.99 | -114.05 | 38.58 | -109.04 |
| NAD_1983_StatePlane_Utah_South_FIPS _4303_Feet_Intl | 2282 | USA - Utah - SPCS - S | 36.99 | -114.05 | 38.58 | -109.04 |
| NAD_1983_StatePlane_Vermont_FIPS_ 4400 | 32145 | USA - Vermont | 42.72 | -73.44 | 45.03 | -71.5 |
| NAD_1983_StatePlane_Vermont_FIPS_ 4400_Feet | 5646 | USA - Vermont | 42.72 | -73.44 | 45.03 | -71.5 |
| NAD_1983_StatePlane_Virginia_North_ FIPS_4501 | 32146 | USA - Virginia - SPCS - N | 37.77 | -80.06 | 39.46 | -76.51 |
| NAD_1983_StatePlane_Virginia_North_ FIPS_4501_Feet | 2283 | USA - Virginia - SPCS - N | 37.77 | -80.06 | 39.46 | -76.51 |
| NAD_1983_StatePlane_Virginia_South_ FIPS_4502 | 32147 | USA - Virginia - SPCS - S | 36.54 | -83.68 | 38.28 | -75.31 |
| NAD_1983_StatePlane_Virginia_South_ FIPS_4502_Feet | 2284 | USA - Virginia - SPCS - S | 36.54 | -83.68 | 38.28 | -75.31 |
| NAD_1983_StatePlane_Washington_ North_FIPS_4601 | 32148 | USA - Washington - SPCS83 - N | 47.08 | -124.79 | 49.05 | -117.02 |
| NAD_1983_StatePlane_Washington_ North_FIPS_4601_Feet | 2285 | USA - Washington - SPCS83 - N | 47.08 | -124.79 | 49.05 | -117.02 |
| NAD_1983_StatePlane_Washington_ South_FIPS_4602 | 32149 | USA - Washington - SPCS83 - S | 45.54 | -124.4 | 47.61 | -116.91 |
| NAD_1983_StatePlane_Washington_ South_FIPS_4602_Feet | 2286 | USA - Washington - SPCS83 - S | 45.54 | -124.4 | 47.61 | -116.91 |
| NAD_1983_StatePlane_West_Virginia_ North_FIPS_4701 | 32150 | USA - West Virginia - SPCS - N | 38.76 | -81.76 | 40.64 | -77.72 |
| NAD_1983_StatePlane_West_Virginia_ North_FIPS_4701_Feet | 26853 | USA - West Virginia - SPCS - N | 38.76 | -81.76 | 40.64 | -77.72 |
| NAD_1983_StatePlane_West_Virginia_ South_FIPS_4702 | 32151 | USA - West Virginia - SPCS - S | 37.2 | -82.65 | 39.17 | -79.05 |
| NAD_1983_StatePlane_West_Virginia_ South_FIPS_4702_Feet | 26854 | USA - West Virginia - SPCS - S | 37.2 | -82.65 | 39.17 | -79.05 |
| NAD_1983_StatePlane_Wisconsin_ Central_FIPS_4802 | 32153 | USA - Wisconsin - SPCS - C | 43.98 | -92.89 | 45.8 | -86.25 |
| NAD_1983_StatePlane_Wisconsin_ Central_FIPS_4802_Feet | 2288 | USA - Wisconsin - SPCS - C | 43.98 | -92.89 | 45.8 | -86.25 |
| NAD_1983_StatePlane_Wisconsin_North _FIPS_4801 | 32152 | USA - Wisconsin - SPCS - N | 45.37 | -92.89 | 47.31 | -88.05 |
| NAD_1983_StatePlane_Wisconsin_North _FIPS_4801_Feet | 2287 | USA - Wisconsin - SPCS - N | 45.37 | -92.89 | 47.31 | -88.05 |
| NAD_1983_StatePlane_Wisconsin_South _FIPS_4803 | 32154 | USA - Wisconsin - SPCS - S | 42.48 | -91.43 | 44.33 | -86.95 |
| NAD_1983_StatePlane_Wisconsin_South _FIPS_4803_Feet | 2289 | USA - Wisconsin - SPCS - S | 42.48 | -91.43 | 44.33 | -86.95 |
| NAD_1983_StatePlane_Wyoming_East_ Central_FIPS_4902 | 32156 | USA - Wyoming - SPCS - EC | 40.99 | -108.63 | 45.01 | -106 |
| NAD_1983_StatePlane_Wyoming_East_ Central_FIPS_4902_Feet | 3737 | USA - Wyoming - SPCS - EC | 40.99 | -108.63 | 45.01 | -106 |
| NAD_1983_StatePlane_Wyoming_East_ FIPS_4901 | 32155 | USA - Wyoming - SPCS - E | 40.99 | -106.33 | 45.01 | -104.05 |
| NAD_1983_StatePlane_Wyoming_East_ FIPS_4901_Feet | 3736 | USA - Wyoming - SPCS - E | 40.99 | -106.33 | 45.01 | -104.05 |
| NAD_1983_StatePlane_Wyoming_West_ Central_FIPS_4903 | 32157 | USA - Wyoming - SPCS - WC | 40.99 | -111.06 | 45.01 | -107.5 |
| NAD_1983_StatePlane_Wyoming_West_ Central_FIPS_4903_Feet | 3738 | USA - Wyoming - SPCS - WC | 40.99 | -111.06 | 45.01 | -107.5 |
| NAD_1983_StatePlane_Wyoming_West_ FIPS_4904 | 32158 | USA - Wyoming - SPCS - W | 40.99 | -111.06 | 44.67 | -109.04 |
| NAD_1983_StatePlane_Wyoming_West_ FIPS_4904_Feet | 3739 | USA - Wyoming - SPCS - W | 40.99 | -111.06 | 44.67 | -109.04 |
| NAD_1983_Statistics_Canada_Lambert | 3347 | Canada | 38.21 | -141.01 | 86.46 | -40.73 |
| NAD_1983_Teranet_Ontario_Lambert | 5320 | Canada - Ontario | 41.67 | -95.16 | 56.9 | -74.35 |
| NAD_1983_Texas_Centric_Mapping_ System_Albers | 3083 | USA - Texas | 25.83 | -106.66 | 36.5 | -93.5 |
| NAD_1983_Texas_Centric_Mapping_ System_Lambert | 3082 | USA - Texas | 25.83 | -106.66 | 36.5 | -93.5 |
| NAD_1983_Texas_Statewide_Mapping_ System | 3081 | USA - Texas | 25.83 | -106.66 | 36.5 | -93.5 |
| NAD_1983_USFS_R6_Albers | 102218 | USA - Oregon and Washington | 41.98 | -124.79 | 49.05 | -116.47 |
| NAD_1983_USFS_R9_Albers | 102042 | USA - USFS - Eastern Region | 35.9 | -97.3 | 49.5 | -66.8 |
| NAD_1983_UTM_Zone_10N | 26910 | North America - 126°W to 120°W and NAD83 by country | 30.54 | -126 | 81.8 | -119.99 |
| NAD_1983_UTM_Zone_11N | 26911 | North America - 120°W to 114°W and NAD83 by country | 30.88 | -120 | 83.5 | -114 |
| NAD_1983_UTM_Zone_12N | 26912 | North America - 114°W to 108°W and NAD83 by country | 31.33 | -114 | 84 | -108 |
| NAD_1983_UTM_Zone_13N | 26913 | North America - 108°W to 102°W and NAD83 by country | 28.98 | -108 | 84 | -102 |
| NAD_1983_UTM_Zone_14N | 26914 | North America - 102°W to 96°W and NAD83 by country | 25.83 | -102 | 84 | -96 |
| NAD_1983_UTM_Zone_15N | 26915 | North America - 96°W to 90°W and NAD83 by country | 25.61 | -96 | 84 | -90 |
| NAD_1983_UTM_Zone_16N | 26916 | North America - 90°W to 84°W and NAD83 by country | 23.97 | -90 | 84 | -84 |
| NAD_1983_UTM_Zone_17N | 26917 | North America - 84°W to 78°W and NAD83 by country | 23.81 | -84 | 84 | -78 |
| NAD_1983_UTM_Zone_18N | 26918 | North America - 78°W to 72°W and NAD83 by country | 28.28 | -78 | 84 | -72 |
| NAD_1983_UTM_Zone_19N | 26919 | North America - 72°W to 66°W and NAD83 by country | 14.92 | -72 | 84 | -66 |
| NAD_1983_UTM_Zone_1N | 26901 | USA - 180°W to 174°W - AK, OCS | 47.88 | -180 | 63.21 | -173.99 |
| NAD_1983_UTM_Zone_20N | 26920 | North America - 66°W to 60°W and NAD83 by country | 15.63 | -66 | 84 | -60 |
| NAD_1983_UTM_Zone_21N | 26921 | Canada - 60°W to 54°W | 38.56 | -60 | 84 | -54 |
| NAD_1983_UTM_Zone_22N | 26922 | Canada - 54°W to 48°W | 39.5 | -54 | 57.65 | -48 |
| NAD_1983_UTM_Zone_23N | 26923 | Canada - 48°W to 42°W | 39.85 | -48 | 54.47 | -47.74 |
| NAD_1983_UTM_Zone_24N | 9712 | Canada - east of 42°W | 45.53 | -42 | 49.53 | -40.73 |
| NAD_1983_UTM_Zone_2N | 26902 | USA - 174°W to 168°W - AK, OCS | 48.66 | -174 | 73.05 | -167.99 |
| NAD_1983_UTM_Zone_3N | 26903 | USA - 168°W to 162°W - AK, OCS | 49.52 | -168 | 74.29 | -161.99 |
| NAD_1983_UTM_Zone_4N | 26904 | USA - 162°W to 156°W - AK, HI | 15.57 | -162 | 74.71 | -155.99 |
| NAD_1983_UTM_Zone_58N | 102213 | World - N hemisphere - 168°E to 174°E - by country | 0 | 168 | 84 | 174 |
| NAD_1983_UTM_Zone_59N | 3372 | USA - west of 174°E - AK, OCS | 49.01 | 167.65 | 56.28 | 174.01 |
| NAD_1983_UTM_Zone_5N | 26905 | USA - 156°W to 150°W - AK, HI | 15.56 | -156 | 74.71 | -149.99 |
| NAD_1983_UTM_Zone_60N | 3373 | USA - 174°E to 180°E - AK, OCS | 47.92 | 174 | 56.67 | 180 |
| NAD_1983_UTM_Zone_6N | 26906 | USA - 150°W to 144°W - AK, OCS | 54.05 | -150 | 74.13 | -143.99 |
| NAD_1983_UTM_Zone_7N | 26907 | North America - 144°W to 138°W and NAD83 by country | 52.05 | -144 | 73.59 | -137.99 |
| NAD_1983_UTM_Zone_8N | 26908 | North America - 138°W to 132°W and NAD83 by country | 48.06 | -138 | 79.42 | -132 |
| NAD_1983_UTM_Zone_9N | 26909 | North America - 132°W to 126°W and NAD83 by country | 35.38 | -132 | 80.93 | -126 |
| NAD_1983_Virginia_Lambert | 3968 | USA - Virginia | 36.54 | -83.68 | 39.46 | -75.31 |
| NAD_1983_Wisconsin_TM | 3070 | USA - Wisconsin | 42.48 | -92.89 | 47.31 | -86.25 |
| NAD_1983_Wisconsin_TM_US_Ft | 102219 | USA - Wisconsin | 42.48 | -92.89 | 47.31 | -86.25 |
| NAD_1983_WyLAM | 102212 | USA - Wyoming | 40.99 | -111.06 | 45.01 | -104.05 |
| NAD_1983_Yukon_Albers | 3578 | Canada - Yukon | 59.99 | -141.01 | 69.7 | -123.91 |
| Name | WKID | Area of Use | Minimum Latitude | Minimum Longitude | Maximum Latitude | Maximum Longitude |
|---|---|---|---|---|---|---|
| Nahrwan_1934_Iraq_Zone | 3394 | Asia - Middle East -SE Iraq and SW Iran | 29.06 | 44.3 | 33.5 | 51.06 |
| Nahrwan_1934_UTM_zone_37N | 7005 | Iraq - west of 42°E | 31.14 | 38.79 | 36.75 | 42 |
| Nahrwan_1934_UTM_zone_38N | 7006 | Iraq - 42°E to 48°E | 29.06 | 42 | 37.39 | 48 |
| Nahrwan_1934_UTM_zone_39N | 7007 | Iraq - east of 48°E | 29.6 | 48 | 31 | 48.75 |
| Nahrwan_1967_UTM_Zone_37N | 27037 | Iraq - west of 42°E | 31.14 | 38.79 | 36.75 | 42 |
| Nahrwan_1967_UTM_Zone_38N | 27038 | Asia - Middle East - Iraq and Kuwait 42°E to 48°E | 28.53 | 42 | 37.39 | 48 |
| Nahrwan_1967_UTM_Zone_39N | 27039 | Asia - Middle East - Qatar offshore and UAE west of 54°E | 22.76 | 50.55 | 27.05 | 54.01 |
| Nahrwan_1967_UTM_Zone_40N | 27040 | UAE - east of 54°E | 22.63 | 54 | 26.27 | 57.13 |
| Nakhl-e_Ghanem_UTM_Zone_39N | 3307 | Iran - Kangan district | 27.3 | 51.8 | 28.2 | 53.01 |
| Naparima_1955_UTM_Zone_20N | 2067 | Trinidad and Tobago - Trinidad - onshore | 9.99 | -61.98 | 10.9 | -60.85 |
| Naparima_1972_UTM_Zone_20N | 27120 | Trinidad and Tobago - Tobago - onshore | 11.08 | -60.9 | 11.41 | -60.44 |
| NEA74_Noumea_Lambert | 3165 | New Caledonia - Grande Terre - Noumea | -22.37 | 166.35 | -22.19 | 166.54 |
| NEA74_Noumea_Lambert_2 | 3166 | New Caledonia - Grande Terre - Noumea | -22.37 | 166.35 | -22.19 | 166.54 |
| NEA74_Noumea_UTM_58S | 2998 | New Caledonia - Grande Terre - Noumea | -22.37 | 166.35 | -22.19 | 166.54 |
| Nepal_Nagarkot_TM | 102306 | Nepal | 26.34 | 80.06 | 30.43 | 88.21 |
| New_Beijing_3_Degree_Gauss_Kruger_ CM_102E | 4791 | China - 100.5°E to 103.5°E | 21.13 | 100.5 | 42.69 | 103.5 |
| New_Beijing_3_Degree_Gauss_Kruger_ CM_105E | 4792 | China - 103.5°E to 106.5°E | 22.5 | 103.5 | 42.21 | 106.51 |
| New_Beijing_3_Degree_Gauss_Kruger_ CM_108E | 4793 | China - 106.5°E to 109.5°E onshore | 18.19 | 106.5 | 42.47 | 109.51 |
| New_Beijing_3_Degree_Gauss_Kruger_ CM_111E | 4794 | China - 109.5°E to 112.5°E onshore | 18.11 | 109.5 | 45.11 | 112.5 |
| New_Beijing_3_Degree_Gauss_Kruger_ CM_114E | 4795 | China - 112.5°E to 115.5°E onshore | 21.52 | 112.5 | 45.45 | 115.5 |
| New_Beijing_3_Degree_Gauss_Kruger_ CM_117E | 4796 | China - 115.5°E to 118.5°E onshore | 22.6 | 115.5 | 49.88 | 118.5 |
| New_Beijing_3_Degree_Gauss_Kruger_ CM_120E | 4797 | China - 118.5°E to 121.5°E onshore | 24.43 | 118.5 | 53.33 | 121.5 |
| New_Beijing_3_Degree_Gauss_Kruger_ CM_123E | 4798 | China - 121.5°E to 124.5°E onshore | 28.22 | 121.5 | 53.56 | 124.5 |
| New_Beijing_3_Degree_Gauss_Kruger_ CM_126E | 4799 | China - 124.5°E to 127.5°E onshore | 40.19 | 124.5 | 53.2 | 127.5 |
| New_Beijing_3_Degree_Gauss_Kruger_ CM_129E | 4800 | China - 127.5°E to 130.5°E | 41.37 | 127.5 | 50.25 | 130.5 |
| New_Beijing_3_Degree_Gauss_Kruger_ CM_132E | 102569 | China - 130.5°E to 133.5°E | 42.42 | 130.5 | 48.88 | 133.5 |
| New_Beijing_3_Degree_Gauss_Kruger_ CM_135E | 4822 | China - east of 133.5°E | 45.85 | 133.5 | 48.4 | 134.77 |
| New_Beijing_3_Degree_Gauss_Kruger_ CM_75E | 4782 | China - west of 76.5°E | 35.81 | 73.62 | 40.65 | 76.5 |
| New_Beijing_3_Degree_Gauss_Kruger_ CM_78E | 4783 | China - 76.5°E to 79.5°E | 31.03 | 76.5 | 41.83 | 79.5 |
| New_Beijing_3_Degree_Gauss_Kruger_ CM_81E | 4784 | China - 79.5°E to 82.5°E | 29.95 | 79.5 | 45.88 | 82.51 |
| New_Beijing_3_Degree_Gauss_Kruger_ CM_84E | 4785 | China - 82.5°E to 85.5°E | 28.26 | 82.5 | 47.23 | 85.5 |
| New_Beijing_3_Degree_Gauss_Kruger_ CM_87E | 4786 | China - 85.5°E to 88.5°E | 27.8 | 85.5 | 49.18 | 88.5 |
| New_Beijing_3_Degree_Gauss_Kruger_ CM_90E | 4787 | China - 88.5°E to 91.5°E | 27.32 | 88.49 | 48.42 | 91.51 |
| New_Beijing_3_Degree_Gauss_Kruger_ CM_93E | 4788 | China - 91.5°E to 94.5°E | 27.71 | 91.5 | 45.13 | 94.5 |
| New_Beijing_3_Degree_Gauss_Kruger_ CM_96E | 4789 | China - 94.5°E to 97.5°E | 28.23 | 94.5 | 44.5 | 97.51 |
| New_Beijing_3_Degree_Gauss_Kruger_ CM_99E | 4790 | China - 97.5°E to 100.5°E | 21.43 | 97.5 | 42.76 | 100.5 |
| New_Beijing_3_Degree_Gauss_Kruger_ Zone_25 | 4652 | China - west of 76.5°E | 35.81 | 73.62 | 40.65 | 76.5 |
| New_Beijing_3_Degree_Gauss_Kruger_ Zone_26 | 4653 | China - 76.5°E to 79.5°E | 31.03 | 76.5 | 41.83 | 79.5 |
| New_Beijing_3_Degree_Gauss_Kruger_ Zone_27 | 4654 | China - 79.5°E to 82.5°E | 29.95 | 79.5 | 45.88 | 82.51 |
| New_Beijing_3_Degree_Gauss_Kruger_ Zone_28 | 4655 | China - 82.5°E to 85.5°E | 28.26 | 82.5 | 47.23 | 85.5 |
| New_Beijing_3_Degree_Gauss_Kruger_ Zone_29 | 4656 | China - 85.5°E to 88.5°E | 27.8 | 85.5 | 49.18 | 88.5 |
| New_Beijing_3_Degree_Gauss_Kruger_ Zone_30 | 4766 | China - 88.5°E to 91.5°E | 27.32 | 88.49 | 48.42 | 91.51 |
| New_Beijing_3_Degree_Gauss_Kruger_ Zone_31 | 4767 | China - 91.5°E to 94.5°E | 27.71 | 91.5 | 45.13 | 94.5 |
| New_Beijing_3_Degree_Gauss_Kruger_ Zone_32 | 4768 | China - 94.5°E to 97.5°E | 28.23 | 94.5 | 44.5 | 97.51 |
| New_Beijing_3_Degree_Gauss_Kruger_ Zone_33 | 4769 | China - 97.5°E to 100.5°E | 21.43 | 97.5 | 42.76 | 100.5 |
| New_Beijing_3_Degree_Gauss_Kruger_ Zone_34 | 4770 | China - 100.5°E to 103.5°E | 21.13 | 100.5 | 42.69 | 103.5 |
| New_Beijing_3_Degree_Gauss_Kruger_ Zone_35 | 4771 | China - 103.5°E to 106.5°E | 22.5 | 103.5 | 42.21 | 106.51 |
| New_Beijing_3_Degree_Gauss_Kruger_ Zone_36 | 4772 | China - 106.5°E to 109.5°E onshore | 18.19 | 106.5 | 42.47 | 109.51 |
| New_Beijing_3_Degree_Gauss_Kruger_ Zone_37 | 4773 | China - 109.5°E to 112.5°E onshore | 18.11 | 109.5 | 45.11 | 112.5 |
| New_Beijing_3_Degree_Gauss_Kruger_ Zone_38 | 4774 | China - 112.5°E to 115.5°E onshore | 21.52 | 112.5 | 45.45 | 115.5 |
| New_Beijing_3_Degree_Gauss_Kruger_ Zone_39 | 4775 | China - 115.5°E to 118.5°E onshore | 22.6 | 115.5 | 49.88 | 118.5 |
| New_Beijing_3_Degree_Gauss_Kruger_ Zone_40 | 4776 | China - 118.5°E to 121.5°E onshore | 24.43 | 118.5 | 53.33 | 121.5 |
| New_Beijing_3_Degree_Gauss_Kruger_ Zone_41 | 4777 | China - 121.5°E to 124.5°E onshore | 28.22 | 121.5 | 53.56 | 124.5 |
| New_Beijing_3_Degree_Gauss_Kruger_ Zone_42 | 4778 | China - 124.5°E to 127.5°E onshore | 40.19 | 124.5 | 53.2 | 127.5 |
| New_Beijing_3_Degree_Gauss_Kruger_ Zone_43 | 4779 | China - 127.5°E to 130.5°E | 41.37 | 127.5 | 50.25 | 130.5 |
| New_Beijing_3_Degree_Gauss_Kruger_ Zone_44 | 4780 | China - 130.5°E to 133.5°E | 42.42 | 130.5 | 48.88 | 133.5 |
| New_Beijing_3_Degree_Gauss_Kruger_ Zone_45 | 4781 | China - east of 133.5°E | 45.85 | 133.5 | 48.4 | 134.77 |
| New_Beijing_Gauss_Kruger_CM_105E | 4584 | China - 102°E to 108°E onshore | 21.53 | 102 | 42.47 | 108 |
| New_Beijing_Gauss_Kruger_CM_111E | 4585 | China - 108°E to 114°E onshore | 18.11 | 108 | 45.11 | 114 |
| New_Beijing_Gauss_Kruger_CM_117E | 4586 | China - 114°E to 120°E onshore | 22.14 | 114 | 51.52 | 120 |
| New_Beijing_Gauss_Kruger_CM_123E | 4587 | China - 120°E to 126°E onshore | 26.34 | 120 | 53.56 | 126 |
| New_Beijing_Gauss_Kruger_CM_129E | 4588 | China - 126°E to 132°E onshore | 40.89 | 126 | 52.79 | 132 |
| New_Beijing_Gauss_Kruger_CM_135E | 4589 | China - east of 132°E | 45.02 | 132 | 48.4 | 134.77 |
| New_Beijing_Gauss_Kruger_CM_75E | 4579 | China - west of 78°E | 35.42 | 73.62 | 41.07 | 78.01 |
| New_Beijing_Gauss_Kruger_CM_81E | 4580 | China - 78°E to 84°E | 29.16 | 77.98 | 47.23 | 84 |
| New_Beijing_Gauss_Kruger_CM_87E | 4581 | China - 84°E to 90°E | 27.32 | 84 | 49.18 | 90 |
| New_Beijing_Gauss_Kruger_CM_93E | 4582 | China - 90°E to 96°E | 27.71 | 90 | 47.9 | 96.01 |
| New_Beijing_Gauss_Kruger_CM_99E | 4583 | China - 96°E to 102°E | 21.13 | 96 | 43.18 | 102.01 |
| New_Beijing_Gauss_Kruger_Zone_13 | 4568 | China - west of 78°E | 35.43 | 73.62 | 41.07 | 78.01 |
| New_Beijing_Gauss_Kruger_Zone_14 | 4569 | China - 78°E to 84°E | 29.16 | 77.98 | 47.23 | 84 |
| New_Beijing_Gauss_Kruger_Zone_15 | 4570 | China - 84°E to 90°E | 27.32 | 84 | 49.18 | 90 |
| New_Beijing_Gauss_Kruger_Zone_16 | 4571 | China - 90°E to 96°E | 27.71 | 90 | 47.9 | 96.01 |
| New_Beijing_Gauss_Kruger_Zone_17 | 4572 | China - 96°E to 102°E | 21.13 | 96 | 43.18 | 102.01 |
| New_Beijing_Gauss_Kruger_Zone_18 | 4573 | China - 102°E to 108°E onshore | 21.53 | 102 | 42.47 | 108 |
| New_Beijing_Gauss_Kruger_Zone_19 | 4574 | China - 108°E to 114°E onshore | 18.11 | 108 | 45.11 | 114 |
| New_Beijing_Gauss_Kruger_Zone_20 | 4575 | China - 114°E to 120°E onshore | 22.14 | 114 | 51.52 | 120 |
| New_Beijing_Gauss_Kruger_Zone_21 | 4576 | China - 120°E to 126°E onshore | 26.34 | 120 | 53.56 | 126 |
| New_Beijing_Gauss_Kruger_Zone_22 | 4577 | China - 126°E to 132°E onshore | 40.89 | 126 | 52.79 | 132 |
| New_Beijing_Gauss_Kruger_Zone_23 | 4578 | China - east of 132°E | 45.02 | 132 | 48.4 | 134.77 |
| New_Zealand_North_Island | 27291 | New Zealand - North Island | -41.67 | 171.99 | -34.1 | 178.63 |
| New_Zealand_South_Island | 27292 | New Zealand - South and Stewart Islands | -47.33 | 166.37 | -40.44 | 174.46 |
| NGN_UTM_Zone_38N | 31838 | Kuwait - west of 48°E onshore | 28.53 | 46.54 | 30.09 | 48 |
| NGN_UTM_Zone_39N | 31839 | Kuwait - east of 48°E onshore | 28.54 | 48 | 30.04 | 48.48 |
| NGO_1948_Baerum_Kommune | 102136 | Norway - Baerum Kommune | 59.825 | 10.337 | 60.037 | 10.672 |
| NGO_1948_Bergenhalvoen | 102137 | Norway - Bergenhalvoen Kommune | 60.165 | 5.137 | 60.544 | 5.699 |
| NGO_1948_Norway_Zone_1 | 102101 | Norway - zone I | 57.93 | 4.68 | 63.06 | 7.23 |
| NGO_1948_Norway_Zone_2 | 102102 | Norway - zone II | 57.95 | 7.22 | 63.87 | 9.56 |
| NGO_1948_Norway_Zone_3 | 102103 | Norway - zone III | 58.84 | 9.55 | 65.76 | 11.98 |
| NGO_1948_Norway_Zone_4 | 102104 | Norway - zone IV | 59.88 | 11.97 | 69.06 | 15.06 |
| NGO_1948_Norway_Zone_5 | 102105 | Norway - zone V | 66.15 | 15.05 | 70.19 | 18.89 |
| NGO_1948_Norway_Zone_6 | 102106 | Norway - zone VI | 68.33 | 18.88 | 70.81 | 22.89 |
| NGO_1948_Norway_Zone_7 | 102107 | Norway - zone VII | 68.58 | 22.88 | 71.21 | 26.98 |
| NGO_1948_Norway_Zone_8 | 102108 | Norway - zone VIII | 69.02 | 26.97 | 71.17 | 31.22 |
| NGO_1948_Oslo_Baerum_Kommune | 102450 | Norway - Baerum Kommune | 59.825 | 10.337 | 60.037 | 10.672 |
| NGO_1948_Oslo_Bergenhalvoen | 102451 | Norway - Bergenhalvoen Kommune | 60.165 | 5.137 | 60.544 | 5.699 |
| NGO_1948_Oslo_Kommune | 102138 | Norway - Oslo Kommune | 59.81 | 10.48 | 60.14 | 10.97 |
| NGO_1948_Oslo_Norway_Zone_1 | 27391 | Norway - zone I | 57.93 | 4.68 | 63.06 | 7.23 |
| NGO_1948_Oslo_Norway_Zone_2 | 27392 | Norway - zone II | 57.95 | 7.22 | 63.87 | 9.56 |
| NGO_1948_Oslo_Norway_Zone_3 | 27393 | Norway - zone III | 58.84 | 9.55 | 65.76 | 11.98 |
| NGO_1948_Oslo_Norway_Zone_4 | 27394 | Norway - zone IV | 59.88 | 11.97 | 69.06 | 15.06 |
| NGO_1948_Oslo_Norway_Zone_5 | 27395 | Norway - zone V | 66.15 | 15.05 | 70.19 | 18.89 |
| NGO_1948_Oslo_Norway_Zone_6 | 27396 | Norway - zone VI | 68.33 | 18.88 | 70.81 | 22.89 |
| NGO_1948_Oslo_Norway_Zone_7 | 27397 | Norway - zone VII | 68.58 | 22.88 | 71.21 | 26.98 |
| NGO_1948_Oslo_Norway_Zone_8 | 27398 | Norway - zone VIII | 69.02 | 26.97 | 71.17 | 31.22 |
| NGO_1948_Oslo_Oslo_Kommune | 102452 | Norway - Oslo Kommune | 59.81 | 10.48 | 60.14 | 10.97 |
| NGO_1948_UTM_Zone_32N | 102132 | World - N hemisphere - 6°E to 12°E - by country | 0 | 6 | 84 | 12 |
| NGO_1948_UTM_Zone_33N | 102133 | World - N hemisphere - 12°E to 18°E - by country | 0 | 12 | 84 | 18 |
| NGO_1948_UTM_Zone_34N | 102134 | World - N hemisphere - 18°E to 24°E - by country | 0 | 18 | 84 | 24 |
| NGO_1948_UTM_Zone_35N | 102135 | World - N hemisphere - 24°E to 30°E - by country | 0 | 24 | 84 | 30 |
| Nigeria_East_Belt | 26393 | Nigeria - east of 10.5°E | 6.43 | 10.49 | 13.72 | 14.65 |
| Nigeria_Mid_Belt | 26392 | Nigeria - 6.5°E to 10.5°E | 3.57 | 6.5 | 13.53 | 10.51 |
| Nigeria_West_Belt | 26391 | Nigeria - west of 6.5°E | 3.57 | 2.69 | 13.9 | 6.5 |
| Nord_Algerie_Ancienne | 30491 | Algeria - north of 34°39'N | 34.64 | -2.22 | 37.14 | 8.64 |
| Nord_Algerie_Ancienne_Degree | 102491 | Algeria | 18.97 | -8.67 | 38.8 | 11.99 |
| Nord_de_Guerre | 27500 | France - Alsace | 47.42 | 6.84 | 49.07 | 8.23 |
| Nord_Maroc | 26191 | Morocco - north of 31.5°N | 31.49 | -9.85 | 35.97 | -1.01 |
| Nord_Maroc_Degree | 102191 | Morocco - north of 31.5°N | 31.49 | -9.85 | 35.97 | -1.01 |
| Nord_Sahara_1959_UTM_Zone_29N | 30729 | Algeria - west of 6°W | 25.73 | -8.67 | 29.85 | -6 |
| Nord_Sahara_1959_UTM_Zone_30N | 30730 | Algeria - 6°W to 0°W | 21.82 | -6 | 37.01 | 0 |
| Nord_Sahara_1959_UTM_Zone_31N | 30731 | Algeria - 0°E to 6°E | 18.97 | 0 | 38.77 | 6.01 |
| Nord_Sahara_1959_UTM_Zone_32N | 30732 | Algeria - east of 6°E | 19.6 | 6 | 38.8 | 11.99 |
| Nord_Sahara_1959_Voirol_Unifie_Nord | 30791 | Algeria - north of 34°39'N | 34.64 | -2.22 | 37.14 | 8.64 |
| Nord_Sahara_1959_Voirol_Unifie_Sud | 30792 | Algeria - 31°30'N to 34°39'N | 31.49 | -3.85 | 34.66 | 9.22 |
| Nord_Tunisie | 22391 | Tunisia - north of 34°39'N | 34.65 | 8.18 | 37.4 | 11.37 |
| North_America_Albers_Equal_Area_ Conic | 102008 | North America - Canada and USA (CONUS, Alaska mainland) | 23.81 | -172.54 | 86.46 | -47.74 |
| North_America_Equidistant_Conic | 102010 | North America - Canada and USA (CONUS, Alaska mainland) | 23.81 | -172.54 | 86.46 | -47.74 |
| North_America_Lambert_Conformal_ Conic | 102009 | North America - Canada and USA (CONUS, Alaska mainland) | 23.81 | -172.54 | 86.46 | -47.74 |
| North_Pole_Azimuthal_Equidistant | 102016 | World - north of 0°N | 0 | -180 | 90 | 180 |
| North_Pole_Gnomonic | 102034 | World - north of 0°N | 0 | -180 | 90 | 180 |
| North_Pole_Lambert_Azimuthal_Equal_ Area | 102017 | World - north of 0°N | 0 | -180 | 90 | 180 |
| North_Pole_Orthographic | 102035 | World - north of 0°N | 0 | -180 | 90 | 180 |
| North_Pole_Stereographic | 102018 | World - north of 0°N | 0 | -180 | 90 | 180 |
| NSIDC_EASE_Grid_Global | 3410 | World - 86°S to 86°N | -86 | -180 | 86 | 180 |
| NSIDC_EASE_Grid_North | 3408 | World - north of 0°N | 0 | -180 | 90 | 180 |
| NSIDC_EASE_Grid_South | 3409 | World - south of 0°N | -90 | -180 | 0 | 180 |
| NSIDC_Sea_Ice_Polar_Stereographic_ North | 3411 | World - N hemisphere - north of 60°N | 60 | -180 | 90 | 180 |
| NSIDC_Sea_Ice_Polar_Stereographic_ South | 3412 | World - S hemisphere - south of 60°S | -90 | -180 | -60 | 180 |
| NTF_France_I_degrees | 102581 | France - mainland north of 48.15°N | 48.14 | -4.87 | 51.14 | 8.23 |
| NTF_France_II_degrees | 102582 | France - mainland 45.45°N to 48.15°N. Also all mainland. | 42.33 | -4.87 | 51.14 | 8.23 |
| NTF_France_III_degrees | 102583 | France - mainland south of 45.45°N | 42.33 | -1.79 | 45.46 | 7.71 |
| NTF_France_IV_degrees | 102584 | France - Corsica onshore | 41.31 | 8.5 | 43.07 | 9.63 |
| NTF_Lambert_Zone_I | 102585 | France - mainland north of 48.15°N | 48.14 | -4.87 | 51.14 | 8.23 |
| NTF_Lambert_Zone_II | 102586 | France - mainland 45.45°N to 48.15°N. Also all mainland. | 42.33 | -4.87 | 51.14 | 8.23 |
| NTF_Lambert_Zone_III | 102587 | France - mainland south of 45.45°N | 42.33 | -1.79 | 45.46 | 7.71 |
| NTF_Lambert_Zone_IV | 102588 | France - Corsica onshore | 41.31 | 8.5 | 43.07 | 9.63 |
| NTF_Paris_Centre_France | 27592 | France - mainland 45.45°N to 48.15°N | 45.44 | -4.8 | 48.15 | 7.63 |
| NTF_Paris_Corse | 27594 | France - Corsica onshore | 41.31 | 8.5 | 43.07 | 9.63 |
| NTF_Paris_France_I | 27581 | France - mainland north of 48.15°N | 48.14 | -4.87 | 51.14 | 8.23 |
| NTF_Paris_France_II | 27582 | France - mainland 45.45°N to 48.15°N. Also all mainland. | 42.33 | -4.87 | 51.14 | 8.23 |
| NTF_Paris_France_III | 27583 | France - mainland south of 45.45°N | 42.33 | -1.79 | 45.46 | 7.71 |
| NTF_Paris_France_IV | 27584 | France - Corsica onshore | 41.31 | 8.5 | 43.07 | 9.63 |
| NTF_Paris_Lambert_Centre_France | 27562 | France - mainland 45.45°N to 48.15°N | 45.44 | -4.8 | 48.15 | 7.63 |
| NTF_Paris_Lambert_Corse | 27564 | France - Corsica onshore | 41.31 | 8.5 | 43.07 | 9.63 |
| NTF_Paris_Lambert_Nord_France | 27561 | France - mainland north of 48.15°N | 48.14 | -4.87 | 51.14 | 8.23 |
| NTF_Paris_Lambert_Sud_France | 27563 | France - mainland south of 45.45°N | 42.33 | -1.79 | 45.46 | 7.71 |
| NTF_Paris_Lambert_Zone_I | 27571 | France - mainland north of 48.15°N | 48.14 | -4.87 | 51.14 | 8.23 |
| NTF_Paris_Lambert_Zone_II | 27572 | France - mainland 45.45°N to 48.15°N. Also all mainland. | 42.33 | -4.87 | 51.14 | 8.23 |
| NTF_Paris_Lambert_Zone_III | 27573 | France - mainland south of 45.45°N | 42.33 | -1.79 | 45.46 | 7.71 |
| NTF_Paris_Lambert_Zone_IV | 27574 | France - Corsica onshore | 41.31 | 8.5 | 43.07 | 9.63 |
| NTF_Paris_Nord_France | 27591 | France - mainland north of 48.15°N | 48.14 | -4.87 | 51.14 | 8.23 |
| NTF_Paris_Sud_France | 27593 | France - mainland south of 45.45°N | 42.33 | -1.79 | 45.46 | 7.71 |
| NZGD_1949_Amuri_Circuit | 27219 | New Zealand - South Island - Amuri mc | -42.95 | 171.88 | -42.09 | 173.55 |
| NZGD_1949_Bay_of_Plenty_Circuit | 27206 | New Zealand - North Island - Bay of Plenty mc | -39.13 | 175.75 | -37.22 | 177.23 |
| NZGD_1949_Bluff_Circuit | 27232 | New Zealand - South and Stewart Islands - Bluff mc | -47.33 | 167.29 | -45.33 | 168.97 |
| NZGD_1949_Buller_Circuit | 27217 | New Zealand - South Island - Buller mc | -42.19 | 171.27 | -41.42 | 172.41 |
| NZGD_1949_Collingwood_Circuit | 27214 | New Zealand - South Island - Collingwood mc | -41.22 | 172.16 | -40.44 | 173.13 |
| NZGD_1949_Gawler_Circuit | 27225 | New Zealand - South Island - Gawler mc | -44.25 | 170.68 | -43.13 | 172.26 |
| NZGD_1949_Grey_Circuit | 27218 | New Zealand - South Island - Grey mc | -42.74 | 171.15 | -41.5 | 172.75 |
| NZGD_1949_Hawkes_Bay_Circuit | 27208 | New Zealand - North Island - Hawkes Bay mc Napier vcrs | -40.57 | 175.8 | -38.87 | 178.07 |
| NZGD_1949_Hokitika_Circuit | 27221 | New Zealand - South Island - Hokitika mc | -43.23 | 170.39 | -42.41 | 171.89 |
| NZGD_1949_Jacksons_Bay_Circuit | 27223 | New Zealand - South Island - Jacksons Bay mc | -44.4 | 168.02 | -43.67 | 170.01 |
| NZGD_1949_Karamea_Circuit | 27216 | New Zealand - South Island - Karamea mc | -41.49 | 171.96 | -40.75 | 172.7 |
| NZGD_1949_Lindis_Peak_Circuit | 27227 | New Zealand - South Island - Lindis Peak mc | -45.4 | 168.62 | -43.71 | 170.24 |
| NZGD_1949_Marlborough_Circuit | 27220 | New Zealand - South Island - Marlborough mc | -42.65 | 172.95 | -40.85 | 174.46 |
| NZGD_1949_Mount_Eden_Circuit | 27205 | New Zealand - North Island - Mount Eden mc | -39.01 | 171.99 | -34.1 | 176.12 |
| NZGD_1949_Mount_Nicholas_Circuit | 27228 | New Zealand - South Island - Mount Nicholas mc | -45.58 | 167.72 | -44.29 | 169.11 |
| NZGD_1949_Mount_Pleasant_Circuit | 27224 | New Zealand - South Island - Mount Pleasant mc | -43.96 | 171.11 | -42.69 | 173.38 |
| NZGD_1949_Mount_York_Circuit | 27229 | New Zealand - South Island - Mount York mc | -46.33 | 166.37 | -44.53 | 168.21 |
| NZGD_1949_Nelson_Circuit | 27215 | New Zealand - South Island - Nelson mc | -42.18 | 172.4 | -40.66 | 174.08 |
| NZGD_1949_North_Taieri_Circuit | 27231 | New Zealand - South Island - North Taieri mc | -46.73 | 168.64 | -45.23 | 170.87 |
| NZGD_1949_Observation_Point_Circuit | 27230 | New Zealand - South Island - Observation Point mc | -45.82 | 169.77 | -44.61 | 171.24 |
| NZGD_1949_Okarito_Circuit | 27222 | New Zealand - South Island - Okarito mc | -43.85 | 169.21 | -43 | 170.89 |
| NZGD_1949_Poverty_Bay_Circuit | 27207 | New Zealand - North Island - Poverty Bay mc | -39.04 | 176.73 | -37.49 | 178.63 |
| NZGD_1949_Taranaki_Circuit | 27209 | New Zealand - North Island - Taranaki mc | -39.78 | 173.68 | -38.4 | 175.44 |
| NZGD_1949_Timaru_Circuit | 27226 | New Zealand - South Island - Timaru mc | -44.98 | 169.82 | -43.35 | 171.55 |
| NZGD_1949_Tuhirangi_Circuit | 27210 | New Zealand - North Island - Tuhirangi mc | -39.55 | 174.88 | -38.87 | 176.33 |
| NZGD_1949_UTM_Zone_58S | 27258 | New Zealand - nearshore west of 168°E | -47.65 | 165.87 | -42.59 | 168 |
| NZGD_1949_UTM_Zone_59S | 27259 | New Zealand - nearshore 168°E to 174°E | -47.64 | 168 | -33.89 | 174 |
| NZGD_1949_UTM_Zone_60S | 27260 | New Zealand - nearshore east of 174°E | -44.13 | 174 | -34.24 | 179.27 |
| NZGD_1949_Wairarapa_Circuit | 27212 | New Zealand - North Island - Wairarapa mc | -41.67 | 175.01 | -40.29 | 176.55 |
| NZGD_1949_Wanganui_Circuit | 27211 | New Zealand - North Island - Wanganui mc | -40.97 | 174.4 | -39.46 | 176.27 |
| NZGD_1949_Wellington_Circuit | 27213 | New Zealand - North Island - Wellington mc | -41.5 | 174.52 | -40.91 | 175.36 |
| NZGD_2000_Amuri_Circuit | 2119 | New Zealand - South Island - Amuri mc | -42.95 | 171.88 | -42.09 | 173.55 |
| NZGD_2000_Antipodes_Islands_TM_ 2000 | 3790 | New Zealand - Antipodes and Bounty Islands | -49.92 | 178.4 | -47.54 | 179.37 |
| NZGD_2000_Auckland_Islands_TM_2000 | 3788 | New Zealand - Snares and Auckland Islands | -51.13 | 165.55 | -47.8 | 166.93 |
| NZGD_2000_Bay_of_Plenty_Circuit | 2106 | New Zealand - North Island - Bay of Plenty mc | -39.13 | 175.75 | -37.22 | 177.23 |
| NZGD_2000_Bluff_Circuit | 2132 | New Zealand - South and Stewart Islands - Bluff mc | -47.33 | 167.29 | -45.33 | 168.97 |
| NZGD_2000_Buller_Circuit | 2117 | New Zealand - South Island - Buller mc | -42.19 | 171.27 | -41.42 | 172.41 |
| NZGD_2000_Campbell_Island_TM_2000 | 3789 | New Zealand - Campbell Island | -52.83 | 168.65 | -52.26 | 169.6 |
| NZGD_2000_Chatham_Island_Circuit | 3764 | New Zealand - Chatham Islands group | -44.64 | -177.25 | -43.3 | -175.54 |
| NZGD_2000_Chatham_Islands_TM_2000 | 3793 | New Zealand - Chatham Islands group | -44.64 | -177.25 | -43.3 | -175.54 |
| NZGD_2000_Collingwood_Circuit | 2114 | New Zealand - South Island - Collingwood mc | -41.22 | 172.16 | -40.44 | 173.13 |
| NZGD_2000_Gawler_Circuit | 2125 | New Zealand - South Island - Gawler mc | -44.25 | 170.68 | -43.13 | 172.26 |
| NZGD_2000_Grey_Circuit | 2118 | New Zealand - South Island - Grey mc | -42.74 | 171.15 | -41.5 | 172.75 |
| NZGD_2000_Hawkes_Bay_Circuit | 2108 | New Zealand - North Island - Hawkes Bay mc Napier vcrs | -40.57 | 175.8 | -38.87 | 178.07 |
| NZGD_2000_Hokitika_Circuit | 2121 | New Zealand - South Island - Hokitika mc | -43.23 | 170.39 | -42.41 | 171.89 |
| NZGD_2000_Jacksons_Bay_Circuit | 2123 | New Zealand - South Island - Jacksons Bay mc | -44.4 | 168.02 | -43.67 | 170.01 |
| NZGD_2000_Karamea_Circuit | 2116 | New Zealand - South Island - Karamea mc | -41.49 | 171.96 | -40.75 | 172.7 |
| NZGD_2000_Lindis_Peak_Circuit | 2127 | New Zealand - South Island - Lindis Peak mc | -45.4 | 168.62 | -43.71 | 170.24 |
| NZGD_2000_Marlborough_Circuit | 2120 | New Zealand - South Island - Marlborough mc | -42.65 | 172.95 | -40.85 | 174.46 |
| NZGD_2000_Mount_Eden_Circuit | 2105 | New Zealand - North Island - Mount Eden mc | -39.01 | 171.99 | -34.1 | 176.12 |
| NZGD_2000_Mount_Nicholas_Circuit | 2128 | New Zealand - South Island - Mount Nicholas mc | -45.58 | 167.72 | -44.29 | 169.11 |
| NZGD_2000_Mount_Pleasant_Circuit | 2124 | New Zealand - South Island - Mount Pleasant mc | -43.96 | 171.11 | -42.69 | 173.38 |
| NZGD_2000_Mount_York_Circuit | 2129 | New Zealand - South Island - Mount York mc | -46.33 | 166.37 | -44.53 | 168.21 |
| NZGD_2000_Nelson_Circuit | 2115 | New Zealand - South Island - Nelson mc | -42.18 | 172.4 | -40.66 | 174.08 |
| NZGD_2000_New_Zealand_Transverse_ Mercator | 2193 | New Zealand - onshore | -47.33 | 166.37 | -34.1 | 178.63 |
| NZGD_2000_North_Taieri_Circuit | 2131 | New Zealand - South Island - North Taieri mc | -46.73 | 168.64 | -45.23 | 170.87 |
| NZGD_2000_NZ_Continental_Shelf_2000 | 3851 | New Zealand - offshore | -55.95 | 160.6 | -25.88 | -171.2 |
| NZGD_2000_Observation_Point_Circuit | 2130 | New Zealand - South Island - Observation Point mc | -45.82 | 169.77 | -44.61 | 171.24 |
| NZGD_2000_Okarito_Circuit | 2122 | New Zealand - South Island - Okarito mc | -43.85 | 169.21 | -43 | 170.89 |
| NZGD_2000_Poverty_Bay_Circuit | 2107 | New Zealand - North Island - Poverty Bay mc | -39.04 | 176.73 | -37.49 | 178.63 |
| NZGD_2000_Raoul_Island_TM_2000 | 3791 | New Zealand - Raoul and Kermadec Islands | -31.56 | -179.07 | -29.03 | -177.62 |
| NZGD_2000_Taranaki_Circuit | 2109 | New Zealand - North Island - Taranaki mc | -39.78 | 173.68 | -38.4 | 175.44 |
| NZGD_2000_Timaru_Circuit | 2126 | New Zealand - South Island - Timaru mc | -44.98 | 169.82 | -43.35 | 171.55 |
| NZGD_2000_Tuhirangi_Circuit | 2110 | New Zealand - North Island - Tuhirangi mc | -39.55 | 174.88 | -38.87 | 176.33 |
| NZGD_2000_UTM_Zone_1S | 5700 | New Zealand - offshore 180°W to 174°W | -52.97 | -180 | -25.88 | -174 |
| NZGD_2000_UTM_Zone_58S | 2133 | New Zealand - offshore 162°E to168°E | -55.89 | 162 | -39.68 | 168 |
| NZGD_2000_UTM_Zone_59S | 2134 | New Zealand - offshore 168°E to 174°E | -55.95 | 168 | -30.78 | 174 |
| NZGD_2000_UTM_Zone_60S | 2135 | New Zealand - offshore 174°E to 180°E | -54.32 | 174 | -26.42 | 180 |
| NZGD_2000_Wairarapa_Circuit | 2112 | New Zealand - North Island - Wairarapa mc | -41.67 | 175.01 | -40.29 | 176.55 |
| NZGD_2000_Wanganui_Circuit | 2111 | New Zealand - North Island - Wanganui mc | -40.97 | 174.4 | -39.46 | 176.27 |
| NZGD_2000_Wellington_Circuit | 2113 | New Zealand - North Island - Wellington mc | -41.5 | 174.52 | -40.91 | 175.36 |
| Observatorio_Meteorologico_1939_UTM _Zone_25N | 102166 | Portugal - Azores W - onshore | 39.3 | -31.34 | 39.77 | -31.02 |
| Observatorio_Meteorologico_1965_ Macau_Grid | 102159 | China - Macao | 22.06 | 113.52 | 22.23 | 113.68 |
| Ocotepeque_1935_Costa_Rica_Lambert_ Norte | 102221 | Costa Rica | 2.15 | -90.45 | 11.77 | -81.43 |
| Ocotepeque_1935_Costa_Rica_Lambert_ Sur | 102222 | Costa Rica | 2.15 | -90.45 | 11.77 | -81.43 |
| Ocotepeque_1935_Costa_Rica_Norte | 5456 | Costa Rica - onshore north of 9°32'N | 9.53 | -85.97 | 11.22 | -82.53 |
| Ocotepeque_1935_Costa_Rica_Sur | 5457 | Costa Rica - onshore south of 9°56'N | 7.98 | -85.74 | 9.94 | -82.53 |
| Ocotepeque_1935_El_Salvador_Lambert | 5460 | El Salvador - onshore | 13.1 | -90.11 | 14.44 | -87.69 |
| Ocotepeque_1935_Guatemala_Norte | 5559 | Guatemala - north of 15°51'30''N | 15.85 | -91.86 | 17.83 | -88.34 |
| Ocotepeque_1935_Guatemala_Sur | 5459 | Guatemala - south of 15°51'30''N | 13.69 | -92.29 | 15.86 | -88.19 |
| Ocotepeque_1935_Nicaragua_Norte | 5461 | Nicaragua - onshore north of 12°48'N | 12.8 | -87.74 | 15.03 | -83.08 |
| Ocotepeque_1935_Nicaragua_Sur | 5462 | Nicaragua - onshore south of 12°48'N | 10.7 | -87.63 | 12.8 | -83.42 |
| OCRS_Baker_NAD_1983_2011_TM_Feet_ Intl | 6787 | USA - Oregon - Baker City | 44.6 | -118.15 | 45.19 | -117.37 |
| OCRS_Baker_NAD_1983_2011_TM_ Meters | 6786 | USA - Oregon - Baker City | 10.7 | -87.63 | 12.8 | -83.42 |
| OCRS_Baker_NAD_1983_CORS96_TM_ Feet_Intl | 6785 | USA - Oregon - Baker City | 44.6 | -118.15 | 45.19 | -117.37 |
| OCRS_Baker_NAD_1983_CORS96_TM_ Meters | 6784 | USA - Oregon - Baker City | 10.7 | -87.63 | 12.8 | -83.42 |
| OCRS_Bend- Burns_NAD_1983_2011_LCC_Feet_Intl | 6799 | USA - Oregon - Bend- Burns | 43.34 | -121.95 | 44.28 | -118.8 |
| OCRS_Bend- Burns_NAD_1983_2011_LCC_Meters | 6798 | USA - Oregon - Bend- Burns | 43.34 | -121.95 | 44.28 | -118.8 |
| OCRS_Bend- Burns_NAD_1983_CORS96_LCC_Feet_Intl | 6797 | USA - Oregon - Bend- Burns | 43.34 | -121.95 | 44.28 | -118.8 |
| OCRS_Bend- Burns_NAD_1983_CORS96_LCC_Meters | 6796 | USA - Oregon - Bend- Burns | 43.34 | -121.95 | 44.28 | -118.8 |
| OCRS_Bend- Klamath_Falls_NAD_1983_2011_TM_ Feet_Intl | 6791 | USA - Oregon - Bend- Klamath Falls | 41.88 | -122.45 | 43.89 | -120.77 |
| OCRS_Bend- Klamath_Falls_NAD_1983_2011_TM_ Meters | 6790 | USA - Oregon - Bend- Klamath Falls | 41.88 | -122.45 | 43.89 | -120.77 |
| OCRS_Bend-Klamath_Falls_NAD_1983_ CORS96_TM_Feet_Intl | 6789 | USA - Oregon - Bend- Klamath Falls | 41.88 | -122.45 | 43.89 | -120.77 |
| OCRS_Bend-Klamath_Falls_NAD_1983_ CORS96_TM_Meters | 6788 | USA - Oregon - Bend- Klamath Falls | 41.88 | -122.45 | 43.89 | -120.77 |
| OCRS_Bend-Redmond-Prineville_NAD_ 1983_2011_LCC_Feet_Intl | 6795 | USA - Oregon - Bend- Redmond-Prineville | 43.76 | -121.88 | 44.98 | -119.79 |
| OCRS_Bend-Redmond- Prineville_NAD_1983_2011_LCC_Meters | 6794 | USA - Oregon - Bend- Redmond-Prineville | 43.76 | -121.88 | 44.98 | -119.79 |
| OCRS_Bend-Redmond-Prineville_NAD _1983_CORS96_LCC_Feet_Intl | 6793 | USA - Oregon - Bend- Redmond-Prineville | 43.76 | -121.88 | 44.98 | -119.79 |
| OCRS_Bend-Redmond-Prineville_NAD_ 1983_CORS96_LCC_Meters | 6792 | USA - Oregon - Bend- Redmond-Prineville | 43.76 | -121.88 | 44.98 | -119.79 |
| OCRS_Burns-Harper_NAD_1983_ 2011_TM_Ft_Intl | 8312 | USA - Oregon - Burns- Harper | 43.49 | -118.61 | 44.19 | -117.49 |
| OCRS_Burns-Harper_NAD_1983_ 2011_TM_Meters | 8311 | USA - Oregon - Burns- Harper | 43.49 | -118.61 | 44.19 | -117.49 |
| OCRS_Burns-Harper_NAD_1983_2011_ TM_Ft_Intl | 8312 | USA - Oregon - Burns- Harper | 43.49 | -118.61 | 44.19 | -117.49 |
| OCRS_Burns-Harper_NAD_1983_2011_ TM_Meters | 8311 | USA - Oregon - Burns- Harper | 43.49 | -118.61 | 44.19 | -117.49 |
| OCRS_Canyonville-Grants_Pass_ NAD_1983_2011_TM_Feet_Intl | 6803 | USA - Oregon - Canyonville-Grants Pass | 42.49 | -123.83 | 43.24 | -122.43 |
| OCRS_Canyonville-Grants_Pass_ NAD_1983_2011_TM_Meters | 6802 | USA - Oregon - Canyonville-Grants Pass | 42.49 | -123.83 | 43.24 | -122.43 |
| OCRS_Canyonville-Grants_Pass_ NAD_1983_CORS96_TM_Feet_Intl | 6801 | USA - Oregon - Canyonville-Grants Pass | 42.49 | -123.83 | 43.24 | -122.43 |
| OCRS_Canyonville-Grants_Pass_ NAD_1983_CORS96_TM_Meters | 6800 | USA - Oregon - Canyonville-Grants Pass | 42.49 | -123.83 | 43.24 | -122.43 |
| OCRS_Coast_Range_North_NAD_1983_ 2011_LCC_Ft_Intl | 8316 | USA - Oregon - Coast Range North | 45.4 | -123.81 | 45.98 | -123.01 |
| OCRS_Coast_Range_North_NAD_1983_ 2011_LCC_Meters | 8315 | USA - Oregon - Coast Range North | 45.4 | -123.81 | 45.98 | -123.01 |
| OCRS_Columbia_River_East_NAD_1983_ 2011_LCC_Feet_Intl | 6807 | USA - Oregon - Columbia River East | 45.49 | -122.05 | 46.08 | -118.89 |
| OCRS_Columbia_River_East_NAD_1983_ 2011_LCC_Meters | 6806 | USA - Oregon - Columbia River East | 45.49 | -122.05 | 46.08 | -118.89 |
| OCRS_Columbia_River_East_NAD_1983_ CORS96_LCC_Feet_Intl | 6805 | USA - Oregon - Columbia River East | 45.49 | -122.05 | 46.08 | -118.89 |
| OCRS_Columbia_River_East_NAD_1983_ CORS96_LCC_Meters | 6804 | USA - Oregon - Columbia River East | 45.49 | -122.05 | 46.08 | -118.89 |
| OCRS_Columbia_River_West_NAD_1983_ 2011_OM_Feet_Intl | 6811 | USA - Oregon - Columbia River West | 45.17 | -124.33 | 46.56 | -121.47 |
| OCRS_Columbia_River_West_NAD_1983_ 2011_OM_Meters | 6810 | USA - Oregon - Columbia River West | 45.17 | -124.33 | 46.56 | -121.47 |
| OCRS_Columbia_River_West_NAD_1983_ CORS96_OM_Feet_Intl | 6809 | USA - Oregon - Columbia River West | 45.17 | -124.33 | 46.56 | -121.47 |
| OCRS_Columbia_River_West_NAD_1983_ CORS96_OM_Meters | 6808 | USA - Oregon - Columbia River West | 45.17 | -124.33 | 46.56 | -121.47 |
| OCRS_Cottage_Grove-Canyonville_ NAD_1983_2011_TM_Feet_Intl | 6815 | USA - Oregon - Cottage Grove-Canyonville | 42.82 | -123.96 | 43.88 | -122.4 |
| OCRS_Cottage_Grove-Canyonville_ NAD_1983_2011_TM_Meters | 6814 | USA - Oregon - Cottage Grove-Canyonville | 42.82 | -123.96 | 43.88 | -122.4 |
| OCRS_Cottage_Grove-Canyonville_ NAD_1983_CORS96_TM_Feet_Intl | 6813 | USA - Oregon - Cottage Grove-Canyonville | 42.82 | -123.96 | 43.88 | -122.4 |
| OCRS_Cottage_Grove-Canyonville_ NAD_1983_CORS96_TM_Meters | 6812 | USA - Oregon - Cottage Grove-Canyonville | 42.82 | -123.96 | 43.88 | -122.4 |
| OCRS_Dayville-Prairie_City_ NAD_1983_2011_TM_Ft_Intl | 8318 | USA - Oregon - Dayville- Prairie City | 44.24 | -119.89 | 44.94 | -118.61 |
| OCRS_Dayville-Prairie_City_ NAD_1983_2011_TM_Meters | 8317 | USA - Oregon - Dayville- Prairie City | 44.24 | -119.89 | 44.94 | -118.61 |
| OCRS_Denio-Burns_ NAD_1983_2011_TM_Ft_Intl | 8320 | USA - Oregon - Denio- Burns | 41.88 | -119.41 | 43.54 | -117.67 |
| OCRS_Denio-Burns_ NAD_1983_2011_TM_Meters | 8319 | USA - Oregon - Denio- Burns | 41.88 | -119.41 | 43.54 | -117.67 |
| OCRS_Dufur-Madras_ NAD_1983_2011_TM_Feet_Intl | 6819 | USA - Oregon - Dufur- Madras | 44.63 | -121.95 | 45.55 | -120.46 |
| OCRS_Dufur-Madras_ NAD_1983_2011_TM_Meters | 6818 | USA - Oregon - Dufur- Madras | 44.63 | -121.95 | 45.55 | -120.46 |
| OCRS_Dufur-Madras_ NAD_1983_CORS96_TM_Feet_Intl | 6817 | USA - Oregon - Dufur- Madras | 44.63 | -121.95 | 45.55 | -120.46 |
| OCRS_Dufur-Madras_ NAD_1983_CORS96_TM_Meters | 6816 | USA - Oregon - Dufur- Madras | 44.63 | -121.95 | 45.55 | -120.46 |
| OCRS_Eugene_NAD_1983_2011_TM_ Feet_Intl | 6823 | USA - Oregon - Eugene | 43.74 | -123.8 | 44.71 | -122.18 |
| OCRS_Eugene_NAD_1983_2011_TM_ Meters | 6822 | USA - Oregon - Eugene | 43.74 | -123.8 | 44.71 | -122.18 |
| OCRS_Eugene_NAD_1983_CORS96_TM_ Feet_Intl | 6821 | USA - Oregon - Eugene | 43.74 | -123.8 | 44.71 | -122.18 |
| OCRS_Eugene_NAD_1983_CORS96_TM_ Meters | 6820 | USA - Oregon - Eugene | 43.74 | -123.8 | 44.71 | -122.18 |
| OCRS_Grants_Pass-Ashland_NAD_1983_ 2011_TM_Feet_Intl | 6827 | USA - Oregon - Grants Pass-Ashland | 41.88 | -123.95 | 42.85 | -122.37 |
| OCRS_Grants_Pass-Ashland_NAD_1983_ 2011_TM_Meters | 6826 | USA - Oregon - Grants Pass-Ashland | 41.88 | -123.95 | 42.85 | -122.37 |
| OCRS_Grants_Pass-Ashland_NAD_1983_ CORS96_TM_Feet_Intl | 6825 | USA - Oregon - Grants Pass-Ashland | 41.88 | -123.95 | 42.85 | -122.37 |
| OCRS_Grants_Pass-Ashland_NAD_1983_ CORS96_TM_Meters | 6824 | USA - Oregon - Grants Pass-Ashland | 41.88 | -123.95 | 42.85 | -122.37 |
| OCRS_Gresham-Warm_Springs_ NAD_1983_2011_TM_Feet_Intl | 6831 | USA - Oregon - Gresham-Warm Springs | 45.02 | -122.43 | 45.55 | -121.68 |
| OCRS_Gresham-Warm_Springs_ NAD_1983_2011_TM_Meters | 6830 | USA - Oregon - Gresham-Warm Springs | 45.02 | -122.43 | 45.55 | -121.68 |
| OCRS_Gresham-Warm_Springs_ NAD_1983_CORS96_TM_Feet_Intl | 6829 | USA - Oregon - Gresham-Warm Springs | 45.02 | -122.43 | 45.55 | -121.68 |
| OCRS_Gresham-Warm_Springs_ NAD_1983_CORS96_TM_Meters | 6828 | USA - Oregon - Gresham-Warm Springs | 45.02 | -122.43 | 45.55 | -121.68 |
| OCRS_Halfway_NAD_1983_2011_LCC_ Ft_Intl | 8322 | USA - Oregon - Halfway | 44.61 | -117.61 | 45.28 | -116.63 |
| OCRS_Halfway_NAD_1983_2011_LCC_ Meters | 8321 | USA - Oregon - Halfway | 44.61 | -117.61 | 45.28 | -116.63 |
| OCRS_La_Grande_NAD_1983_2011_TM_ Feet_Intl | 6835 | USA - Oregon - La Grande | 45.13 | -118.17 | 45.8 | -117.14 |
| OCRS_La_Grande_NAD_1983_2011_TM_ Meters | 6834 | USA - Oregon - La Grande | 45.13 | -118.17 | 45.8 | -117.14 |
| OCRS_La_Grande_NAD_1983_CORS96_ TM_Feet_Intl | 6833 | USA - Oregon - La Grande | 45.13 | -118.17 | 45.8 | -117.14 |
| OCRS_La_Grande_NAD_1983_CORS96_ TM_Meters | 6832 | USA - Oregon - La Grande | 45.13 | -118.17 | 45.8 | -117.14 |
| OCRS_Medford-Diamond_Lake_ NAD_1983_2011_LCC_Ft_Intl | 8324 | USA - Oregon - Medford-Diamond Lake | 42.53 | -122.73 | 43.34 | -121.71 |
| OCRS_Medford-Diamond_Lake_ NAD_1983_2011_LCC_Meters | 8323 | USA - Oregon - Medford-Diamond Lake | 42.53 | -122.73 | 43.34 | -121.71 |
| OCRS_Mitchell_NAD_1983_2011_LCC_ Ft_Intl | 8326 | USA - Oregon - Mitchell | 44.38 | -120.56 | 44.78 | -119.82 |
| OCRS_Mitchell_NAD_1983_2011_LCC_ Meters | 8325 | USA - Oregon - Mitchell | 44.38 | -120.56 | 44.78 | -119.82 |
| OCRS_North_Central_NAD_1983_2011_ LCC_Ft_Intl | 8328 | USA - Oregon - North Central | 44.89 | -121.79 | 45.95 | -119.03 |
| OCRS_North_Central_NAD_1983_2011_ LCC_Meters | 8327 | USA - Oregon - North Central | 44.89 | -121.79 | 45.95 | -119.03 |
| OCRS_Ochoco_Summit_NAD_1983_2011 _LCC_Ft_Intl | 8330 | USA - Oregon - Ochoco Summit | 44.21 | -121.01 | 44.61 | -120.31 |
| OCRS_Ochoco_Summit_NAD_1983_2011 _LCC_Meters | 8329 | USA - Oregon - Ochoco Summit | 44.21 | -121.01 | 44.61 | -120.31 |
| OCRS_Ontario_NAD_1983_2011_TM_ Feet_Intl | 6839 | USA - Oregon - Ontario | 43.41 | -117.9 | 44.65 | -116.7 |
| OCRS_Ontario_NAD_1983_2011_TM_ Meters | 6838 | USA - Oregon - Ontario | 43.41 | -117.9 | 44.65 | -116.7 |
| OCRS_Ontario_NAD_1983_CORS96_TM_ Feet_Intl | 6837 | USA - Oregon - Ontario | 43.41 | -117.9 | 44.65 | -116.7 |
| OCRS_Ontario_NAD_1983_CORS96_TM_ Meters | 6836 | USA - Oregon - Ontario | 43.41 | -117.9 | 44.65 | -116.7 |
| OCRS_Oregon_Coast_NAD_1983_2011_ OM_Feet_Intl | 6843 | USA - Oregon - Oregon Coast | 41.89 | -124.84 | 46.4 | -123.35 |
| OCRS_Oregon_Coast_NAD_1983_2011_ OM_Meters | 6842 | USA - Oregon - Oregon Coast | 41.89 | -124.84 | 46.4 | -123.35 |
| OCRS_Oregon_Coast_NAD_1983_CORS96 _OM_Feet_Intl | 6841 | USA - Oregon - Oregon Coast | 41.89 | -124.84 | 46.4 | -123.35 |
| OCRS_Oregon_Coast_NAD_1983_CORS96 _OM_Meters | 6840 | USA - Oregon - Oregon Coast | 41.89 | -124.84 | 46.4 | -123.35 |
| OCRS_Owyhee_NAD_1983_2011_TM_ Ft_Intl | 8332 | USA - Oregon - Owyhee | 41.88 | -118.14 | 43.54 | -116.85 |
| OCRS_Owyhee_NAD_1983_2011_TM_ Meters | 8331 | USA - Oregon - Owyhee | 41.88 | -118.14 | 43.54 | -116.85 |
| OCRS_Pendleton-La_Grande_NAD_1983_ 2011_TM_Feet_Intl | 6851 | USA - Oregon - Pendleton-La Grande | 45.13 | -118.64 | 45.64 | -118.09 |
| OCRS_Pendleton-La_Grande_NAD_1983_ 2011_TM_Meters | 6850 | USA - Oregon - Pendleton-La Grande | 45.13 | -118.64 | 45.64 | -118.09 |
| OCRS_Pendleton-La_Grande_NAD_1983_ CORS96_TM_Feet_Intl | 6849 | USA - Oregon - Pendleton-La Grande | 45.13 | -118.64 | 45.64 | -118.09 |
| OCRS_Pendleton-La_Grande_NAD_1983_ CORS96_TM_Meters | 6848 | USA - Oregon - Pendleton-La Grande | 45.13 | -118.64 | 45.64 | -118.09 |
| OCRS_Pendleton_NAD_1983_2011_TM_ Feet_Intl | 6847 | USA - Oregon - Pendleton | 45.46 | -119.36 | 46.02 | -118.17 |
| OCRS_Pendleton_NAD_1983_2011_TM_ Meters | 6846 | USA - Oregon - Pendleton | 45.46 | -119.36 | 46.02 | -118.17 |
| OCRS_Pendleton_NAD_1983_CORS96_ TM_Feet_Intl | 6845 | USA - Oregon - Pendleton | 45.46 | -119.36 | 46.02 | -118.17 |
| OCRS_Pendleton_NAD_1983_CORS96_ TM_Meters | 6844 | USA - Oregon - Pendleton | 45.46 | -119.36 | 46.02 | -118.17 |
| OCRS_Pilot_Rock-Ukiah_NAD_1983_ 2011_LCC_Ft_Intl | 8334 | USA - Oregon - Pilot Rock-Ukiah | 44.99 | -119.65 | 46.04 | -118.11 |
| OCRS_Pilot_Rock-Ukiah_NAD_1983_ 2011_LCC_Meters | 8333 | USA - Oregon - Pilot Rock-Ukiah | 44.99 | -119.65 | 46.04 | -118.11 |
| OCRS_Portland_NAD_1983_2011_LCC_ Feet_Intl | 6855 | USA - Oregon - Portland | 45.23 | -123.53 | 46.01 | -122.11 |
| OCRS_Portland_NAD_1983_2011_LCC_ Meters | 6854 | USA - Oregon - Portland | 45.12 | 45.23 | -123.53 | 46.01 |
| OCRS_Portland_NAD_1983_CORS96_LCC _Feet_Intl | 6853 | USA - Oregon - Portland | 45.12 | 45.23 | -123.53 | 46.01 |
| OCRS_Portland_NAD_1983_CORS96_LCC _Meters | 6852 | USA - Oregon - Portland | 45.12 | 45.23 | -123.53 | 46.01 |
| OCRS_Prairie_City-Brogan_NAD_1983_ 2011_LCC_Ft_Intl | 8336 | USA - Oregon - Prairie City-Brogan | 44.16 | -118.77 | 45.02 | -117.48 |
| OCRS_Prairie_City-Brogan_NAD_1983_ 2011_LCC_Meters | 8335 | USA - Oregon - Prairie City-Brogan | 44.16 | -118.77 | 45.02 | -117.48 |
| OCRS_Riley-Lakeview_NAD_1983_ 2011_TM_Ft_Intl | 8338 | USA - Oregon - Riley- Lakeview | 41.88 | -120.97 | 43.45 | -119.15 |
| OCRS_Riley-Lakeview_NAD_1983_ 2011_TM_Meters | 8337 | USA - Oregon - Riley- Lakeview | 41.88 | -120.97 | 43.45 | -119.15 |
| OCRS_Salem_NAD_1983_2011_TM_Feet _Intl | 6859 | USA - Oregon - Salem | 44.32 | -123.73 | 45.3 | -121.89 |
| OCRS_Salem_NAD_1983_2011_TM_ Meters | 6858 | USA - Oregon - Salem | 44.32 | -123.73 | 45.3 | -121.89 |
| OCRS_Salem_NAD_1983_CORS96_TM_ Feet_Intl | 6857 | USA - Oregon - Salem | 44.32 | -123.73 | 45.3 | -121.89 |
| OCRS_Salem_NAD_1983_CORS96_TM_ Meters | 6856 | USA - Oregon - Salem | 44.32 | -123.73 | 45.3 | -121.89 |
| OCRS_Santiam_Pass_NAD_1983_2011_ TM_Feet_Intl | 6863 | USA - Oregon - Sweet Home-Sisters | 44.11 | -122.51 | 44.66 | -121.69 |
| OCRS_Santiam_Pass_NAD_1983_2011_ TM_Meters | 6862 | USA - Oregon - Sweet Home-Sisters | 44.11 | -122.51 | 44.66 | -121.69 |
| OCRS_Santiam_Pass_NAD_1983_CORS96 _TM_Feet_Intl | 6861 | USA - Oregon - Sweet Home-Sisters | 44.11 | -122.51 | 44.66 | -121.69 |
| OCRS_Santiam_Pass_NAD_1983_CORS96 _TM_Meters | 6860 | USA - Oregon - Sweet Home-Sisters | 44.11 | -122.51 | 44.66 | -121.69 |
| OCRS_Siskiyou_Pass_NAD_1983_2011_ LCC_Ft_Intl | 8340 | USA - Oregon - Siskiyou Pass | 41.95 | -122.71 | 42.46 | -121.96 |
| OCRS_Siskiyou_Pass_NAD_1983_2011_ LCC_Meters | 8339 | USA - Oregon - Siskiyou Pass | 41.95 | -122.71 | 42.46 | -121.96 |
| OCRS_Ukiah-Fox_NAD_1983_2011_ LCC_Ft_Intl | 8342 | USA - Oregon - Ukiah- Fox | 44.52 | -119.35 | 45.21 | -118.64 |
| OCRS_Ukiah-Fox_NAD_1983_2011_ LCC_Meters | 8341 | USA - Oregon - Ukiah- Fox | 44.52 | -119.35 | 45.21 | -118.64 |
| OCRS_Wallowa_NAD_1983_2011_TM_ Ft_Intl | 8344 | USA - Oregon - Wallowa | 45.27 | -118.16 | 46.05 | -116.42 |
| OCRS_Wallowa_NAD_1983_2011_TM_ Meters | 8343 | USA - Oregon - Wallowa | 45.27 | -118.16 | 46.05 | -116.42 |
| OCRS_Warner_Highway_NAD_1983_ 2011_LCC_Ft_Intl | 8346 | USA - Oregon - Warner Highway | 41.95 | -120.42 | 42.43 | -119.3 |
| OCRS_Warner_Highway_NAD_1983_ 2011_LCC_Meters | 8345 | USA - Oregon - Warner Highway | 41.95 | -120.42 | 42.43 | -119.3 |
| OCRS_Willamette_Pass_NAD_1983_2011 _TM_Ft_Intl | 8348 | USA - Oregon - Willamette Pass | 42.99 | -122.26 | 44.18 | -121.48 |
| OCRS_Willamette_Pass_NAD_1983_2011 _TM_Meters | 8347 | USA - Oregon - Willamette Pass | 42.99 | -122.26 | 44.18 | -121.48 |
| Old_Hawaiian_StatePlane_Hawaii_1_FIPS _5101 | 3561 | USA - Hawaii - island of Hawaii - onshore | 18.87 | -156.1 | 20.33 | -154.74 |
| Old_Hawaiian_StatePlane_Hawaii_2_FIPS _5102 | 3562 | USA - Hawaii - Maui; Kahoolawe; Lanai; Molokai - onshore | 20.45 | -157.36 | 21.26 | -155.93 |
| Old_Hawaiian_StatePlane_Hawaii_3_FIPS _5103 | 3563 | USA - Hawaii - Oahu - onshore | 21.2 | -158.33 | 21.75 | -157.61 |
| Old_Hawaiian_StatePlane_Hawaii_4_FIPS _5104 | 3564 | USA - Hawaii - Kauai - onshore | 21.81 | -159.85 | 22.29 | -159.23 |
| Old_Hawaiian_StatePlane_Hawaii_5_FIPS _5105 | 3565 | USA - Hawaii - Niihau - onshore | 21.73 | -160.3 | 22.07 | -159.99 |
| Old_Hawaiian_UTM_Zone_4N | 102114 | USA - 162°W to 156°W onshore - HI | 19.51 | -160.3 | 22.29 | -156 |
| Old_Hawaiian_UTM_Zone_5N | 102115 | USA - 156°W to 150°W onshore - HI | 18.87 | -156 | 20.86 | -154.74 |
| ONGD14_UTM_Zone_39N | 7374 | Oman - west of 54°E | 14.94 | 51.99 | 19.67 | 54.01 |
| ONGD14_UTM_Zone_40N | 7375 | Oman - 54°E to 60°E | 14.33 | 54 | 26.74 | 60.01 |
| ONGD14_UTM_Zone_41N | 7376 | Oman - east of 60°E | 16.37 | 60 | 24.09 | 63.38 |
| ONGD17_UTM_Zone_39N | 9295 | Oman - west of 54°E | 14.94 | 51.99 | 19.67 | 54.01 |
| ONGD17_UTM_Zone_40N | 9296 | Oman - 54°E to 60°E | 14.33 | 54 | 26.74 | 60.01 |
| ONGD17_UTM_Zone_41N | 9297 | Oman - east of 60°E | 16.37 | 60 | 24.09 | 63.38 |
| OSNI_1952_Irish_National_Grid | 29901 | UK - Northern Ireland - onshore | 53.96 | -8.18 | 55.36 | -5.34 |
| OSGB36_Highways_England_A10H1 | 102814 | UK - Highways England - A10 | 50.228 | -4.314 | 50.807 | -4.089 |
| OSGB36_Highways_England_A10H2 | 102815 | UK - Highways England - A10 | 50.228 | -4.314 | 50.807 | -4.089 |
| OSGB36_Highways_England_A11H1 | 102816 | UK - Highways England - A11 | 50.231 | -4.115 | 50.81 | -3.879 |
| OSGB36_Highways_England_A11H2 | 102817 | UK - Highways England - A11 | 50.231 | -4.115 | 50.81 | -3.879 |
| OSGB36_Highways_England_A11H3 | 102818 | UK - Highways England - A11 | 50.231 | -4.115 | 50.81 | -3.879 |
| OSGB36_Highways_England_A12H1 | 102819 | UK - Highways England - A12 | 50.235 | -3.902 | 50.814 | -3.655 |
| OSGB36_Highways_England_A12H2 | 102820 | UK - Highways England - A12 | 50.235 | -3.902 | 50.814 | -3.655 |
| OSGB36_Highways_England_A12H3 | 102821 | UK - Highways England - A12 | 50.235 | -3.902 | 50.814 | -3.655 |
| OSGB36_Highways_England_A13H1 | 102822 | UK - Highways England - A13 | 50.418 | -3.678 | 50.898 | -3.422 |
| OSGB36_Highways_England_A13H2 | 102823 | UK - Highways England - A13 | 50.418 | -3.678 | 50.898 | -3.422 |
| OSGB36_Highways_England_A14H1 | 102824 | UK - Highways England - A14 | 50.585 | -4.447 | 51.198 | -3.102 |
| OSGB36_Highways_England_A14H2 | 102825 | UK - Highways England - A14 | 50.585 | -4.447 | 51.198 | -3.102 |
| OSGB36_Highways_England_A15H1 | 102826 | UK - Highways England - A15 | 50.605 | -3.138 | 52.047 | -2.622 |
| OSGB36_Highways_England_A15H2 | 102827 | UK - Highways England - A15 | 50.605 | -3.138 | 52.047 | -2.622 |
| OSGB36_Highways_England_A16H1 | 102828 | UK - Highways England - A16 | 50.608 | -2.642 | 52.048 | -1.504 |
| OSGB36_Highways_England_A16H2 | 102829 | UK - Highways England - A16 | 50.608 | -2.642 | 52.048 | -1.504 |
| OSGB36_Highways_England_A17H1 | 102830 | UK - Highways England - A17 | 50.777 | -1.518 | 52.048 | -1.008 |
| OSGB36_Highways_England_A17H2 | 102831 | UK - Highways England - A17 | 50.777 | -1.518 | 52.048 | -1.008 |
| OSGB36_Highways_England_A18H1 | 102832 | UK - Highways England - A18 | 50.773 | -1.036 | 52.045 | -0.571 |
| OSGB36_Highways_England_A18H2 | 102833 | UK - Highways England - A18 | 50.773 | -1.036 | 52.045 | -0.571 |
| OSGB36_Highways_England_A19H1 | 102834 | UK - Highways England - A19 | 50.77 | -0.61 | 52.04 | -0.323 |
| OSGB36_Highways_England_A19H2 | 102835 | UK - Highways England - A19 | 50.77 | -0.61 | 52.04 | -0.323 |
| OSGB36_Highways_England_A1H1 | 102799 | UK - Highways England - A1 | 50.107 | -5.548 | 50.425 | -5.399 |
| OSGB36_Highways_England_A20H1 | 102836 | UK - Highways England - A20 | 50.766 | -0.369 | 52.037 | -0.075 |
| OSGB36_Highways_England_A20H2 | 102837 | UK - Highways England - A20 | 50.766 | -0.369 | 52.037 | -0.075 |
| OSGB36_Highways_England_A21H1 | 102838 | UK - Highways England - A21 | 50.762 | -0.128 | 52.033 | 0.172 |
| OSGB36_Highways_England_A21H2 | 102839 | UK - Highways England - A21 | 50.762 | -0.128 | 52.033 | 0.172 |
| OSGB36_Highways_England_A22H1 | 102840 | UK - Highways England - A22 | 50.757 | 0.113 | 52.029 | 0.42 |
| OSGB36_Highways_England_A22H2 | 102841 | UK - Highways England - A22 | 50.757 | 0.113 | 52.029 | 0.42 |
| OSGB36_Highways_England_A23H1 | 102842 | UK - Highways England - A23 | 50.755 | 0.354 | 52.024 | 0.551 |
| OSGB36_Highways_England_A23H2 | 102843 | UK - Highways England - A23 | 50.755 | 0.354 | 52.024 | 0.551 |
| OSGB36_Highways_England_A24H1 | 102844 | UK - Highways England - A24 | 50.751 | 0.481 | 52.021 | 0.711 |
| OSGB36_Highways_England_A24H2 | 102845 | UK - Highways England - A24 | 50.751 | 0.481 | 52.021 | 0.711 |
| OSGB36_Highways_England_A25H1 | 102846 | UK - Highways England - A25 | 50.748 | 0.637 | 52.018 | 0.857 |
| OSGB36_Highways_England_A25H2 | 102847 | UK - Highways England - A25 | 50.748 | 0.637 | 52.018 | 0.857 |
| OSGB36_Highways_England_A26H1 | 102848 | UK - Highways England - A26 | 50.744 | 0.779 | 52.014 | 1.002 |
| OSGB36_Highways_England_A26H2 | 102849 | UK - Highways England - A26 | 50.744 | 0.779 | 52.014 | 1.002 |
| OSGB36_Highways_England_A27H1 | 102850 | UK - Highways England - A27 | 50.929 | 0.932 | 52.011 | 1.148 |
| OSGB36_Highways_England_A27H2 | 102851 | UK - Highways England - A27 | 50.929 | 0.932 | 52.011 | 1.148 |
| OSGB36_Highways_England_A28H1 | 102852 | UK - Highways England - A28 | 50.926 | 1.074 | 52.007 | 1.279 |
| OSGB36_Highways_England_A28H2 | 102853 | UK - Highways England - A28 | 50.926 | 1.074 | 52.007 | 1.279 |
| OSGB36_Highways_England_A29H1 | 102854 | UK - Highways England - A29 | 50.922 | 1.202 | 52.003 | 1.409 |
| OSGB36_Highways_England_A2H1 | 102800 | UK - Highways England - A2 | 50.111 | -5.422 | 50.429 | -5.273 |
| OSGB36_Highways_England_A30H1 | 102855 | UK - Highways England - A30 | 50.919 | 1.33 | 52 | 1.54 |
| OSGB36_Highways_England_A3H1 | 102801 | UK - Highways England - A3 | 50.114 | -5.295 | 50.432 | -5.148 |
| OSGB36_Highways_England_A3H2 | 102802 | UK - Highways England - A3 | 50.114 | -5.295 | 50.432 | -5.148 |
| OSGB36_Highways_England_A4H1 | 102803 | UK - Highways England - A4 | 50.208 | -5.175 | 50.525 | -5.028 |
| OSGB36_Highways_England_A5H1 | 102804 | UK - Highways England - A5 | 50.211 | -5.048 | 50.529 | -4.888 |
| OSGB36_Highways_England_A5H2 | 102805 | UK - Highways England - A5 | 50.211 | -5.048 | 50.529 | -4.888 |
| OSGB36_Highways_England_A6H1 | 102806 | UK - Highways England - A6 | 50.214 | -4.907 | 50.532 | -4.748 |
| OSGB36_Highways_England_A6H2 | 102807 | UK - Highways England - A6 | 50.214 | -4.907 | 50.532 | -4.748 |
| OSGB36_Highways_England_A7H1 | 102808 | UK - Highways England - A7 | 50.398 | -4.766 | 50.536 | -4.617 |
| OSGB36_Highways_England_A7H2 | 102809 | UK - Highways England - A7 | 50.398 | -4.766 | 50.536 | -4.617 |
| OSGB36_Highways_England_A8H1 | 102810 | UK - Highways England - A8 | 50.221 | -4.64 | 50.8 | -4.454 |
| OSGB36_Highways_England_A8H2 | 102811 | UK - Highways England - A8 | 50.221 | -4.64 | 50.8 | -4.454 |
| OSGB36_Highways_England_A9H1 | 102812 | UK - Highways England - A9 | 50.224 | -4.484 | 50.803 | -4.285 |
| OSGB36_Highways_England_A9H2 | 102813 | UK - Highways England - A9 | 50.224 | -4.484 | 50.803 | -4.285 |
| OSGB36_Highways_England_B15H1 | 102856 | UK - Highways England - B15 | 52.043 | -3.188 | 53.935 | -2.642 |
| OSGB36_Highways_England_B15H2 | 102857 | UK - Highways England - B15 | 52.043 | -3.188 | 53.935 | -2.642 |
| OSGB36_Highways_England_B15H3 | 102858 | UK - Highways England - B15 | 52.043 | -3.188 | 53.935 | -2.642 |
| OSGB36_Highways_England_B16H1 | 102859 | UK - Highways England - B16 | 52.047 | -2.67 | 53.936 | -1.482 |
| OSGB36_Highways_England_B16H2 | 102860 | UK - Highways England - B16 | 52.047 | -2.67 | 53.936 | -1.482 |
| OSGB36_Highways_England_B16H3 | 102861 | UK - Highways England - B16 | 52.047 | -2.67 | 53.936 | -1.482 |
| OSGB36_Highways_England_B16H4 | 102862 | UK - Highways England - B16 | 52.047 | -2.67 | 53.936 | -1.482 |
| OSGB36_Highways_England_B17H1 | 102863 | UK - Highways England - B17 | 52.045 | -1.504 | 53.936 | -0.964 |
| OSGB36_Highways_England_B17H2 | 102864 | UK - Highways England - B17 | 52.045 | -1.504 | 53.936 | -0.964 |
| OSGB36_Highways_England_B18H1 | 102865 | UK - Highways England - B18 | 52.04 | -1.008 | 53.932 | -0.507 |
| OSGB36_Highways_England_B18H2 | 102866 | UK - Highways England - B18 | 52.04 | -1.008 | 53.932 | -0.507 |
| OSGB36_Highways_England_B19H1 | 102867 | UK - Highways England - B19 | 52.037 | -0.571 | 53.928 | -0.249 |
| OSGB36_Highways_England_B20H1 | 102868 | UK - Highways England - B20 | 52.033 | -0.323 | 53.924 | 0.01 |
| OSGB36_Highways_England_B21H1 | 102869 | UK - Highways England - B21 | 52.029 | -0.076 | 52.806 | 0.21 |
| OSGB36_Highways_England_B22H1 | 102870 | UK - Highways England - B22 | 52.024 | 0.172 | 52.802 | 0.463 |
| OSGB36_Highways_England_B23H1 | 102871 | UK - Highways England - B23 | 52.021 | 0.42 | 52.797 | 0.596 |
| OSGB36_Highways_England_B24H1 | 102872 | UK - Highways England - B24 | 52.018 | 0.551 | 52.794 | 0.759 |
| OSGB36_Highways_England_B25H1 | 102873 | UK - Highways England - B25 | 52.014 | 0.711 | 52.79 | 0.907 |
| OSGB36_Highways_England_B26H1 | 102874 | UK - Highways England - B26 | 52.011 | 0.857 | 52.787 | 1.055 |
| OSGB36_Highways_England_B27H1 | 102875 | UK - Highways England - B27 | 52.007 | 1.002 | 52.783 | 1.203 |
| OSGB36_Highways_England_B28H1 | 102876 | UK - Highways England - B28 | 52.003 | 1.148 | 52.779 | 1.336 |
| OSGB36_Highways_England_B29H1 | 102877 | UK - Highways England - B29 | 52 | 1.278 | 52.775 | 1.47 |
| OSGB36_Highways_England_B30H1 | 102878 | UK - Highways England - B30 | 51.996 | 1.409 | 52.772 | 1.603 |
| OSGB36_Highways_England_B31H1 | 102879 | UK - Highways England - B31 | 52.342 | 1.568 | 52.767 | 1.736 |
| OSGB36_Highways_England_B32H1 | 102880 | UK - Highways England - B32 | 52.337 | 1.7 | 52.763 | 1.869 |
| OSGB36_Highways_England_C13H1 | 102881 | UK - Highways England - C13 | 54.364 | -3.834 | 54.772 | -3.555 |
| OSGB36_Highways_England_C14H1 | 102882 | UK - Highways England - C14 | 54.008 | -3.57 | 54.776 | -3.19 |
| OSGB36_Highways_England_C14H2 | 102883 | UK - Highways England - C14 | 54.008 | -3.57 | 54.776 | -3.19 |
| OSGB36_Highways_England_C14H3 | 102884 | UK - Highways England - C14 | 54.008 | -3.57 | 54.776 | -3.19 |
| OSGB36_Highways_England_C14H4 | 102885 | UK - Highways England - C14 | 54.008 | -3.57 | 54.776 | -3.19 |
| OSGB36_Highways_England_C15H1 | 102886 | UK - Highways England - C15 | 53.931 | -3.224 | 55.139 | -2.67 |
| OSGB36_Highways_England_C15H2 | 102887 | UK - Highways England - C15 | 53.931 | -3.224 | 55.139 | -2.67 |
| OSGB36_Highways_England_C15H3 | 102888 | UK - Highways England - C15 | 53.931 | -3.224 | 55.139 | -2.67 |
| OSGB36_Highways_England_C15H4 | 102889 | UK - Highways England - C15 | 53.931 | -3.224 | 55.139 | -2.67 |
| OSGB36_Highways_England_C15H5 | 102890 | UK - Highways England - C15 | 53.931 | -3.224 | 55.139 | -2.67 |
| OSGB36_Highways_England_C16H1 | 102891 | UK - Highways England - C16 | 53.935 | -2.703 | 55.832 | -1.457 |
| OSGB36_Highways_England_C16H2 | 102892 | UK - Highways England - C16 | 53.935 | -2.703 | 55.832 | -1.457 |
| OSGB36_Highways_England_C16H3 | 102893 | UK - Highways England - C16 | 53.935 | -2.703 | 55.832 | -1.457 |
| OSGB36_Highways_England_C16H4 | 102894 | UK - Highways England - C16 | 53.935 | -2.703 | 55.832 | -1.457 |
| OSGB36_Highways_England_C17H1 | 102895 | UK - Highways England - C17 | 53.932 | -1.482 | 55.518 | -0.923 |
| OSGB36_Highways_England_C17H2 | 102896 | UK - Highways England - C17 | 53.932 | -1.482 | 55.518 | -0.923 |
| OSGB36_Highways_England_C18H1 | 102897 | UK - Highways England - C18 | 53.928 | -0.964 | 54.391 | -0.491 |
| OSGB36_Highways_England_C18H2 | 102898 | UK - Highways England - C18 | 53.928 | -0.964 | 54.391 | -0.491 |
| OSGB36_Highways_England_C19H1 | 102899 | UK - Highways England - C19 | 53.924 | -0.507 | 54.386 | -0.229 |
| OSGB36_Highways_England_C19H2 | 102900 | UK - Highways England - C19 | 53.924 | -0.507 | 54.386 | -0.229 |
| Palestine_Grid_1923_Modified_TM | 103699 | Palestine Territory | 31.21 | 34.17 | 32.55 | 35.58 |
| Palestine_1923_Israel_CS_Grid | 28193 | Asia - Middle East - Israel and Palestine Territory onshore | 29.45 | 34.17 | 33.28 | 35.69 |
| Palestine_1923_Palestine_Belt | 28192 | Asia - Middle East - Israel, Jordan and Palestine onshore | 29.18 | 34.17 | 33.38 | 39.31 |
| Palestine_1923_Palestine_Grid | 28191 | Asia - Middle East - Israel, Jordan and Palestine onshore | 29.18 | 34.17 | 33.38 | 39.31 |
| Palestine_1923_Palestine_Grid_TM | 7142 | Asia - Middle East - Israel, Jordan and Palestine onshore | 29.18 | 34.17 | 33.38 | 39.31 |
| Pampa_del_Castillo_Argentina_1 | 9284 | Argentina - 42.5°S to 50.3°S and west of 70.5°W | -50.34 | -73.59 | -44.94 | -70.5 |
| Pampa_del_Castillo_Argentina_2 | 2082 | Argentina - 42.5°S to 50.3°S and 70.5°W to 67.5°W | -50.34 | -70.5 | -42.49 | -67.49 |
| Pampa_del_Castillo_Argentina_3 | 9285 | Argentina - 42.5°S to 50.3°S and east of 67.5°W | -49.05 | -67.5 | -43.58 | -65.47 |
| Panama-Colon_1911_Panama_Lambert | 5469 | Panama - onshore | 7.15 | -83.04 | 9.68 | -77.19 |
| Panama-Colon_1911_Panama_Polyconic | 5472 | Panama - onshore | 7.15 | -83.04 | 9.68 | -77.19 |
| Panhandle_Energy_Albers | 102589 | USA - Contiguous US | 20 | -125 | 50 | -65 |
| PD/83_3_Degree_GK_Zone_3_E-N | 5666 | Germany - Thuringen - west of 10.5°E | 50.35 | 9.92 | 51.56 | 10.5 |
| PD/83_3_Degree_GK_Zone_4_E-N | 5667 | Germany - Thuringen - east of 10.5°E | 50.2 | 10.5 | 51.64 | 12.56 |
| PD/83_GK_Zone_3 | 3396 | Germany - Thuringen - west of 10.5°E | 50.35 | 9.92 | 51.56 | 10.5 |
| PD/83_GK_Zone_4 | 3397 | Germany - Thuringen - east of 10.5°E | 50.2 | 10.5 | 51.64 | 12.56 |
| PDO_1993_UTM_Zone_39N | 3439 | Oman - onshore west of 54°E | 16.59 | 51.99 | 19.67 | 54 |
| PDO_1993_UTM_Zone_40N | 3440 | Oman - onshore east of 54°E | 16.89 | 54 | 26.58 | 59.91 |
| Perroud_1950_Terre_Adelie_Polar_ Stereographic | 2986 | Antarctica - Adelie Land coastal area | -67.13 | 136 | -65.61 | 142 |
| Peru96_UTM_Zone_17S | 5839 | Peru - 84°W to 78°W | -17.33 | -84 | -3.11 | -78 |
| Peru96_UTM_Zone_18S | 5387 | Peru - 78°W to 72°W | -21.05 | -78 | -0.03 | -72 |
| Peru96_UTM_Zone_19S | 5389 | Peru - east of 72°W | -20.44 | -72 | -2.14 | -68.67 |
| Peru_Central_Zone | 24892 | Peru - 79°W to 73°W | -16.57 | -79 | -0.03 | -73 |
| Peru_East_Zone | 24893 | Peru - east of 73°W | -18.39 | -73 | -2.14 | -68.67 |
| Peru_West_Zone | 24891 | Peru - west of 79°W | -8.32 | -81.41 | -3.38 | -79 |
| Petrels_1972_Terre_Adelie_Polar_ Stereographic | 2985 | Antarctica - Adelie Land - Petrels island | -66.78 | 139.44 | -66.1 | 141.5 |
| Philippines_Zone_I | 25391 | Philippines - zone I onshore | 7.75 | 116.89 | 9.32 | 118 |
| Philippines_Zone_II | 25392 | Philippines - zone II onshore | 8.82 | 118 | 11.58 | 120.07 |
| Philippines_Zone_III | 25393 | Philippines - zone III onshore | 4.99 | 119.7 | 19.45 | 122.21 |
| Philippines_Zone_IV | 25394 | Philippines - zone IV onshore | 6.35 | 121.74 | 18.58 | 124.29 |
| Philippines_Zone_V | 25395 | Philippines - zone V onshore | 5.5 | 123.73 | 14.15 | 126.65 |
| Pitcairn_1967_UTM_Zone_9S | 3784 | Pitcairn - Pitcairn Island | -25.14 | -130.16 | -25 | -130.01 |
| Pitcairn_2006_Pitcairn_TM_2006 | 3783 | Pitcairn - Pitcairn Island | -25.14 | -130.16 | -25 | -130.01 |
| PNG94_PNGMG94_Zone_54 | 5550 | Papua New Guinea - west of 144°E | -11.15 | 139.2 | 2.31 | 144 |
| PNG94_PNGMG94_Zone_55 | 5551 | Papua New Guinea - 144°E to 150°E | -13.88 | 144 | 2.58 | 150.01 |
| PNG94_PNGMG94_Zone_56 | 5552 | Papua New Guinea - 150°E to 156°E | -14.75 | 150 | 1.98 | 156 |
| Pohnpei_Az_Eq_1971 | 102237 | Micronesia | -1.19 | 135.27 | 13.43 | 165.68 |
| Pointe_Noire_UTM_Zone_32S | 28232 | Congo | -6.91 | 8.84 | 3.72 | 18.65 |
| Porto_Santo_1936_UTM_Zone_28N | 2942 | Portugal - Madeira archipelago onshore | 32.35 | -17.31 | 33.15 | -16.23 |
| Porto_Santo_1995_UTM_Zone_28N | 3061 | Portugal - Madeira archipelago onshore | 32.35 | -17.31 | 33.15 | -16.23 |
| Portuguese_National_Grid | 20790 | Portugal - mainland - onshore | 36.95 | -9.56 | 42.16 | -6.19 |
| POSGAR_1994_Argentina_Zone_1 | 22181 | Argentina - west of 70.5°W | -52 | -73.59 | -36.16 | -70.5 |
| POSGAR_1994_Argentina_Zone_2 | 22182 | Argentina - 70.5°W to 67.5°W onshore | -54.9 | -70.5 | -24.08 | -67.49 |
| POSGAR_1994_Argentina_Zone_3 | 22183 | Argentina - 67.5°W to 64.5°W onshore | -55.11 | -67.5 | -21.78 | -64.49 |
| POSGAR_1994_Argentina_Zone_4 | 22184 | Argentina - 64.5°W to 61.5°W onshore | -54.91 | -64.5 | -21.99 | -61.5 |
| POSGAR_1994_Argentina_Zone_5 | 22185 | Argentina - 61.5°W to 58.5°W onshore | -39.06 | -61.51 | -23.37 | -58.5 |
| POSGAR_1994_Argentina_Zone_6 | 22186 | Argentina - 58.5°W to 55.5°W onshore | -38.59 | -58.5 | -24.84 | -55.49 |
| POSGAR_1994_Argentina_Zone_7 | 22187 | Argentina - east of 55.5°W onshore | -28.11 | -55.5 | -25.49 | -53.65 |
| POSGAR_1998_Argentina_Zone_1 | 22171 | Argentina - west of 70.5°W | -52 | -73.59 | -36.16 | -70.5 |
| POSGAR_1998_Argentina_Zone_2 | 22172 | Argentina - 70.5°W to 67.5°W onshore | -54.9 | -70.5 | -24.08 | -67.49 |
| POSGAR_1998_Argentina_Zone_3 | 22173 | Argentina - 67.5°W to 64.5°W onshore | -55.11 | -67.5 | -21.78 | -64.49 |
| POSGAR_1998_Argentina_Zone_4 | 22174 | Argentina - 64.5°W to 61.5°W onshore | -54.91 | -64.5 | -21.99 | -61.5 |
| POSGAR_1998_Argentina_Zone_5 | 22175 | Argentina - 61.5°W to 58.5°W onshore | -39.06 | -61.51 | -23.37 | -58.5 |
| POSGAR_1998_Argentina_Zone_6 | 22176 | Argentina - 58.5°W to 55.5°W onshore | -38.59 | -58.5 | -24.84 | -55.49 |
| POSGAR_1998_Argentina_Zone_7 | 22177 | Argentina - east of 55.5°W onshore | -28.11 | -55.5 | -25.49 | -53.65 |
| POSGAR_2007_Argentina_Zone_1 | 5343 | Argentina - west of 70.5°W | -52 | -73.59 | -36.16 | -70.5 |
| POSGAR_2007_Argentina_Zone_2 | 5344 | Argentina - 70.5°W to 67.5°W onshore | -54.9 | -70.5 | -24.08 | -67.49 |
| POSGAR_2007_Argentina_Zone_3 | 5345 | Argentina - 67.5°W to 64.5°W onshore | -55.11 | -67.5 | -21.78 | -64.49 |
| POSGAR_2007_Argentina_Zone_4 | 5346 | Argentina - 64.5°W to 61.5°W onshore | -54.91 | -64.5 | -21.99 | -61.5 |
| POSGAR_2007_Argentina_Zone_5 | 5347 | Argentina - 61.5°W to 58.5°W onshore | -39.06 | -61.51 | -23.37 | -58.5 |
| POSGAR_2007_Argentina_Zone_6 | 5348 | Argentina - 58.5°W to 55.5°W onshore | -38.59 | -58.5 | -24.84 | -55.49 |
| POSGAR_2007_Argentina_Zone_7 | 5349 | Argentina - east of 55.5°W onshore | -28.11 | -55.5 | -25.49 | -53.65 |
| POSGAR_2007_CABA_2019 | 9498 | Argentina - Buenos Aires city | -34.71 | -58.54 | -34.5 | -58.29 |
| POSGAR_2007_UTM_zone_19S | 9265 | Argentina - Tierra del Fuego offshore west of 66°W | -54.61 | -68.62 | -51.65 | -66 |
| Prince_Edward_Island_Stereographic | 2290 | Canada - Prince Edward Island | 45.9 | -64.49 | 47.09 | -61.9 |
| PRS_1992_Philippines_Zone_I | 3121 | Philippines - zone I | 6.21 | 116.04 | 18.64 | 118 |
| PRS_1992_Philippines_Zone_II | 3122 | Philippines - zone II | 3.02 | 118 | 20.42 | 120.07 |
| PRS_1992_Philippines_Zone_III | 3123 | Philippines - zone III | 3 | 119.7 | 21.62 | 122.21 |
| PRS_1992_Philippines_Zone_IV | 3124 | Philippines - zone IV | 3.44 | 121.74 | 22.18 | 124.29 |
| PRS_1992_Philippines_Zone_V | 3125 | Philippines - zone V | 4.76 | 123.73 | 21.97 | 126.65 |
| PRS_1992_UTM_Zone_50N | 102456 | Philippines - West of 120°E, N hemisphere | 3 | 114 | 22 | 120 |
| PRS_1992_UTM_Zone_51N | 102457 | Philippines - 120°E to 126°E, N hemisphere | 3 | 120 | 24 | 126 |
| PRS_1992_UTM_Zone_52N | 102458 | Philippines - East of 126°E, N hemisphere | 4 | 126 | 20 | 132 |
| PSAD_1956_ICN_Regional | 2317 | Venezuela - onshore | 0.64 | -73.38 | 12.25 | -59.8 |
| PSAD_1956_UTM_Zone_17N | 24817 | South America - 84°W to 78°W, N hemisphere and PSAD56 by country | 0 | -80.18 | 1.45 | -78 |
| PSAD_1956_UTM_Zone_17S | 24877 | South America - 84°W to 78°W, S hemisphere and PSAD56 by country | -10.53 | -81.41 | 0 | -78 |
| PSAD_1956_UTM_Zone_18N | 24818 | South America - 78°W to 72°W, N hemisphere and PSAD56 by country | 0 | -78 | 11.62 | -71.99 |
| PSAD_1956_UTM_Zone_18S | 24878 | South America - 78°W to 72°W, S hemisphere and PSAD56 by country | -43.5 | -78 | 0 | -71.99 |
| PSAD_1956_UTM_Zone_19N | 24819 | South America - 72°W to 66°W, N hemisphere and PSAD56 by country | 0.73 | -72 | 12.68 | -66 |
| PSAD_1956_UTM_Zone_19S | 24879 | South America - 72°W to 66°W, S hemisphere and PSAD56 by country | -43.5 | -72 | -2.14 | -66 |
| PSAD_1956_UTM_Zone_20N | 24820 | South America - 66°W to 60°W, N hemisphere and PSAD56 by country | 0.64 | -66 | 11.23 | -59.99 |
| PSAD_1956_UTM_Zone_20S | 24880 | Bolivia - 66°W to 60°W | -22.87 | -66 | -9.67 | -60 |
| PSAD_1956_UTM_Zone_21N | 24821 | South America - 60°W to 54°W, N hemisphere and PSAD56 by country | 1.18 | -60 | 8.58 | -56.47 |
| PSAD_1956_UTM_Zone_21S | 24881 | Bolivia - east of 60°W | -20.17 | -60 | -16.27 | -57.52 |
| PSAD_1956_UTM_Zone_22S | 24882 | Brazil - Amazon cone shelf | -1.05 | -51.64 | 5.6 | -48 |
| PTRA08_LAEA_Europe | 5633 | Portugal - Azores and Madeira | 29.24 | -35.58 | 43.07 | -12.48 |
| PTRA08_LCC_Europe | 5632 | Portugal - Azores and Madeira | 29.24 | -35.58 | 43.07 | -12.48 |
| PTRA08_UTM_Zone_25N | 5014 | Portugal - Azores - west of 30°W | 35.25 | -35.58 | 43.07 | -30 |
| PTRA08_UTM_Zone_26N | 5015 | Portugal - Azores 30°W to 24°W | 33.52 | -30 | 42.96 | -24 |
| PTRA08_UTM_Zone_28N | 5016 | Portugal - Madeira and EEZ E of 18°W | 29.24 | -18 | 36.46 | -12.48 |
| Puerto_Rico_StatePlane_Puerto_Rico_ FIPS_5201 | 3991 | Puerto Rico - onshore | 17.87 | -67.97 | 18.57 | -65.19 |
| Puerto_Rico_StatePlane_Virgin_Islands_ St_Croix_FIPS_5202 | 3992 | Virgin Islands, US - onshore | 17.62 | -65.09 | 18.44 | -64.51 |
| Puerto_Rico_UTM_Zone_20N | 3920 | Virgin Islands, British - onshore | 18.28 | -64.88 | 18.78 | -64.25 |
| Pulkovo_1942_3_Degree_GK_CM_102E | 2610 | Russia - 100.5°E to 103.5°E onshore | 50.17 | 100.5 | 79.71 | 103.5 |
| Pulkovo_1942_3_Degree_GK_CM_105E | 2611 | Russia - 103.5°E to 106.5°E onshore | 50.13 | 103.5 | 79.21 | 106.5 |
| Pulkovo_1942_3_Degree_GK_CM_108E | 2612 | Russia - 106.5°E to 109.5°E onshore | 49.25 | 106.5 | 78.4 | 109.5 |
| Pulkovo_1942_3_Degree_GK_CM_111E | 2613 | Russia - 109.5°E to 112.5°E onshore | 49.14 | 109.5 | 76.81 | 112.5 |
| Pulkovo_1942_3_Degree_GK_CM_114E | 2614 | Russia - 112.5°E to 115.5°E onshore | 49.49 | 112.5 | 76.7 | 115.5 |
| Pulkovo_1942_3_Degree_GK_CM_117E | 2615 | Russia - 115.5°E to 118.5°E onshore | 49.51 | 115.5 | 74.43 | 118.5 |
| Pulkovo_1942_3_Degree_GK_CM_120E | 2616 | Russia - 118.5°E to 121.5°E onshore | 49.87 | 118.5 | 73.63 | 121.5 |
| Pulkovo_1942_3_Degree_GK_CM_123E | 2617 | Russia - 121.5°E to 124.5°E onshore | 53.18 | 121.5 | 74 | 124.5 |
| Pulkovo_1942_3_Degree_GK_CM_126E | 2618 | Russia - 124.5°E to 127.5°E onshore | 49.88 | 124.5 | 74 | 127.5 |
| Pulkovo_1942_3_Degree_GK_CM_129E | 2619 | Russia - 127.5°E to 130.5°E onshore | 42.67 | 127.5 | 73.59 | 130.5 |
| Pulkovo_1942_3_Degree_GK_CM_132E | 2620 | Russia - 130.5°E to 133.5°E onshore | 42.25 | 130.5 | 71.99 | 133.5 |
| Pulkovo_1942_3_Degree_GK_CM_135E | 2621 | Russia - 133.5°E to 136.5°E onshore | 42.74 | 133.5 | 75.9 | 136.5 |
| Pulkovo_1942_3_Degree_GK_CM_138E | 2622 | Russia - 136.5°E to 139.5°E onshore | 44.76 | 136.5 | 76.27 | 139.5 |
| Pulkovo_1942_3_Degree_GK_CM_141E | 2623 | Russia - 139.5°E to 142.5°E onshore | 45.84 | 139.5 | 76.23 | 142.5 |
| Pulkovo_1942_3_Degree_GK_CM_144E | 2624 | Russia - 142.5°E to 145.5°E onshore | 43.61 | 142.5 | 75.98 | 145.5 |
| Pulkovo_1942_3_Degree_GK_CM_147E | 2625 | Russia - 145.5°E to 148.5°E onshore | 43.6 | 145.5 | 76.76 | 148.5 |
| Pulkovo_1942_3_Degree_GK_CM_150E | 2626 | Russia - 148.5°E to 151.5°E onshore | 45.21 | 148.5 | 76.82 | 151.5 |
| Pulkovo_1942_3_Degree_GK_CM_153E | 2627 | Russia - 151.5°E to 154.5°E onshore | 46.72 | 151.5 | 76.26 | 154.5 |
| Pulkovo_1942_3_Degree_GK_CM_156E | 2628 | Russia - 154.5°E to 157.5°E onshore | 49.02 | 154.5 | 77.2 | 157.5 |
| Pulkovo_1942_3_Degree_GK_CM_159E | 2629 | Russia - 157.5°E to 160.5°E onshore | 51.36 | 157.5 | 71.12 | 160.5 |
| Pulkovo_1942_3_Degree_GK_CM_162E | 2630 | Russia - 160.5°E to 163.5°E onshore | 54.34 | 160.5 | 70.98 | 163.5 |
| Pulkovo_1942_3_Degree_GK_CM_165E | 2631 | Russia - 163.5°E to 166.5°E onshore | 54.69 | 163.5 | 69.82 | 166.5 |
| Pulkovo_1942_3_Degree_GK_CM_168E | 2632 | Russia - 166.5°E to 169.5°E onshore | 54.45 | 166.5 | 70.07 | 169.5 |
| Pulkovo_1942_3_Degree_GK_CM_168W | 2640 | Russia - east of 169.5°W onshore | 65.7 | -169.22 | 65.86 | -168.97 |
| Pulkovo_1942_3_Degree_GK_CM_171E | 2633 | Russia - 169.5°E to 172.5°E onshore | 59.86 | 169.5 | 70.19 | 172.5 |
| Pulkovo_1942_3_Degree_GK_CM_171W | 2639 | Russia - 172.5°W to 169.5°W onshore | 64.35 | -172.5 | 67.06 | -169.57 |
| Pulkovo_1942_3_Degree_GK_CM_174E | 2634 | Russia - 172.5°E to 175.5°E onshore | 60.99 | 172.5 | 70.02 | 175.5 |
| Pulkovo_1942_3_Degree_GK_CM_174W | 2638 | Russia - 175.5°W to 172.5°W onshore | 64.2 | -175.5 | 67.78 | -172.5 |
| Pulkovo_1942_3_Degree_GK_CM_177E | 2635 | Russia - 175.5°E to 178.5°E onshore | 62.09 | 175.5 | 71.1 | 178.5 |
| Pulkovo_1942_3_Degree_GK_CM_177W | 2637 | Russia - 178.5°W to 175.5°W onshore | 64.74 | -178.5 | 71.61 | -175.5 |
| Pulkovo_1942_3_Degree_GK_CM_180E | 2636 | Russia - 178.5°E to 178.5°W onshore | 62.24 | 178.5 | 71.65 | -178.5 |
| Pulkovo_1942_3_Degree_GK_CM_18E | 3147 | Russia - west of 19.5°E | 54.32 | 19.2 | 55.3 | 19.5 |
| Pulkovo_1942_3_Degree_GK_CM_21E | 2582 | Europe - FSU - 19.5°E to 22.5°E onshore | 48.24 | 19.57 | 59.1 | 22.5 |
| Pulkovo_1942_3_Degree_GK_CM_24E | 2583 | Europe - FSU - 22.5°E to 25.5°E onshore | 47.71 | 22.5 | 59.75 | 25.5 |
| Pulkovo_1942_3_Degree_GK_CM_27E | 2584 | Europe - FSU - 25.5°E to 28.5°E onshore | 45.26 | 25.49 | 68.93 | 28.51 |
| Pulkovo_1942_3_Degree_GK_CM_30E | 2585 | Europe - FSU - 28.5°E to 31.5°E onshore | 45.18 | 28.5 | 69.85 | 31.5 |
| Pulkovo_1942_3_Degree_GK_CM_33E | 2586 | Europe - FSU - 31.5°E to 34.5°E onshore | 44.32 | 31.5 | 70.02 | 34.5 |
| Pulkovo_1942_3_Degree_GK_CM_36E | 2587 | Europe - FSU - 34.5°E to 37.5°E onshore | 44.61 | 34.5 | 69.39 | 37.5 |
| Pulkovo_1942_3_Degree_GK_CM_39E | 2588 | Europe - FSU - 37.5°E to 40.5°E onshore | 43.07 | 37.5 | 68.8 | 40.5 |
| Pulkovo_1942_3_Degree_GK_CM_42E | 2589 | Europe - FSU - 40.5°E to 43.5°E onshore | 41.01 | 40.5 | 68.74 | 43.51 |
| Pulkovo_1942_3_Degree_GK_CM_45E | 2590 | Europe - FSU - 43.5°E to 46.5°E onshore | 38.84 | 43.5 | 80.8 | 46.5 |
| Pulkovo_1942_3_Degree_GK_CM_48E | 2591 | Europe - FSU - 46.5°E to 49.5°E onshore | 38.31 | 46.5 | 80.91 | 49.5 |
| Pulkovo_1942_3_Degree_GK_CM_51E | 2592 | Asia - FSU - 49.5°E to 52.5°E onshore | 37.66 | 49.5 | 81.22 | 52.5 |
| Pulkovo_1942_3_Degree_GK_CM_54E | 2593 | Asia - FSU - 52.5°E to 55.5°E onshore | 37.33 | 52.5 | 81.41 | 55.5 |
| Pulkovo_1942_3_Degree_GK_CM_57E | 2594 | Asia - FSU - 55.5°E to 58.5°E onshore | 37.64 | 55.5 | 81.89 | 58.5 |
| Pulkovo_1942_3_Degree_GK_CM_60E | 2595 | Asia - FSU - 58.5°E to 61.5°E onshore | 35.51 | 58.5 | 81.91 | 61.5 |
| Pulkovo_1942_3_Degree_GK_CM_63E | 2596 | Asia - FSU - 61.5°E to 64.5°E onshore | 35.14 | 61.5 | 81.77 | 64.5 |
| Pulkovo_1942_3_Degree_GK_CM_66E | 2597 | Asia - FSU - 64.5°E to 67.5°E onshore | 36.27 | 64.5 | 81.25 | 67.5 |
| Pulkovo_1942_3_Degree_GK_CM_69E | 2598 | Asia - FSU - 67.5°E to 70.5°E onshore | 36.93 | 67.5 | 77.07 | 70.5 |
| Pulkovo_1942_3_Degree_GK_CM_72E | 2599 | Asia - FSU - 70.5°E to 73.5°E onshore | 36.67 | 70.5 | 73.57 | 73.5 |
| Pulkovo_1942_3_Degree_GK_CM_75E | 2601 | Asia - FSU - 73.5°E to 76.5°E onshore | 37.22 | 73.5 | 79.71 | 76.5 |
| Pulkovo_1942_3_Degree_GK_CM_78E | 2602 | Asia - FSU - 76.5°E to 79.5°E onshore | 40.44 | 76.5 | 81.03 | 79.5 |
| Pulkovo_1942_3_Degree_GK_CM_81E | 2603 | Asia - FSU - 79.5°E to 82.5°E onshore | 41.82 | 79.5 | 81.03 | 82.5 |
| Pulkovo_1942_3_Degree_GK_CM_84E | 2604 | Asia - FSU - 82.5°E to 85.5°E onshore | 45.11 | 82.5 | 77.56 | 85.5 |
| Pulkovo_1942_3_Degree_GK_CM_87E | 2605 | Asia - FSU - 85.5°E to 88.5°E onshore | 47.05 | 85.5 | 77.16 | 88.5 |
| Pulkovo_1942_3_Degree_GK_CM_90E | 2606 | Russia - 88.5°E to 91.5°E onshore | 49.44 | 88.5 | 81.28 | 91.5 |
| Pulkovo_1942_3_Degree_GK_CM_93E | 2607 | Russia - 91.5°E to 94.5°E onshore | 50.16 | 91.5 | 81.26 | 94.5 |
| Pulkovo_1942_3_Degree_GK_CM_96E | 2608 | Russia - 94.5°E to 97.5°E onshore | 49.73 | 94.5 | 81.35 | 97.5 |
| Pulkovo_1942_3_Degree_GK_CM_99E | 2609 | Russia - 97.5°E to 100.5°E onshore | 49.79 | 97.5 | 80.9 | 100.5 |
| Pulkovo_1942_3_Degree_GK_Zone_10 | 2526 | Europe - FSU - 28.5°E to 31.5°E onshore | 45.18 | 28.5 | 69.85 | 31.5 |
| Pulkovo_1942_3_Degree_GK_Zone_11 | 2527 | Europe - FSU - 31.5°E to 34.5°E onshore | 44.32 | 31.5 | 70.02 | 34.5 |
| Pulkovo_1942_3_Degree_GK_Zone_12 | 2528 | Europe - FSU - 34.5°E to 37.5°E onshore | 44.61 | 34.5 | 69.39 | 37.5 |
| Pulkovo_1942_3_Degree_GK_Zone_13 | 2529 | Europe - FSU - 37.5°E to 40.5°E onshore | 43.07 | 37.5 | 68.8 | 40.5 |
| Pulkovo_1942_3_Degree_GK_Zone_14 | 2530 | Europe - FSU - 40.5°E to 43.5°E onshore | 41.01 | 40.5 | 68.74 | 43.51 |
| Pulkovo_1942_3_Degree_GK_Zone_15 | 2531 | Europe - FSU - 43.5°E to 46.5°E onshore | 38.84 | 43.5 | 80.8 | 46.5 |
| Pulkovo_1942_3_Degree_GK_Zone_16 | 2532 | Europe - FSU - 46.5°E to 49.5°E onshore | 38.31 | 46.5 | 80.91 | 49.5 |
| Pulkovo_1942_3_Degree_GK_Zone_17 | 2533 | Asia - FSU - 49.5°E to 52.5°E onshore | 37.66 | 49.5 | 81.22 | 52.5 |
| Pulkovo_1942_3_Degree_GK_Zone_18 | 2534 | Asia - FSU - 52.5°E to 55.5°E onshore | 37.33 | 52.5 | 81.41 | 55.5 |
| Pulkovo_1942_3_Degree_GK_Zone_19 | 2535 | Asia - FSU - 55.5°E to 58.5°E onshore | 37.64 | 55.5 | 81.89 | 58.5 |
| Pulkovo_1942_3_Degree_GK_Zone_20 | 2536 | Asia - FSU - 58.5°E to 61.5°E onshore | 35.51 | 58.5 | 81.91 | 61.5 |
| Pulkovo_1942_3_Degree_GK_Zone_21 | 2537 | Asia - FSU - 61.5°E to 64.5°E onshore | 35.14 | 61.5 | 81.77 | 64.5 |
| Pulkovo_1942_3_Degree_GK_Zone_22 | 2538 | Asia - FSU - 64.5°E to 67.5°E onshore | 36.27 | 64.5 | 81.25 | 67.5 |
| Pulkovo_1942_3_Degree_GK_Zone_23 | 2539 | Asia - FSU - 67.5°E to 70.5°E onshore | 36.93 | 67.5 | 77.07 | 70.5 |
| Pulkovo_1942_3_Degree_GK_Zone_24 | 2540 | Asia - FSU - 70.5°E to 73.5°E onshore | 36.67 | 70.5 | 73.57 | 73.5 |
| Pulkovo_1942_3_Degree_GK_Zone_25 | 2541 | Asia - FSU - 73.5°E to 76.5°E onshore | 37.22 | 73.5 | 79.71 | 76.5 |
| Pulkovo_1942_3_Degree_GK_Zone_26 | 2542 | Asia - FSU - 76.5°E to 79.5°E onshore | 40.44 | 76.5 | 81.03 | 79.5 |
| Pulkovo_1942_3_Degree_GK_Zone_27 | 2543 | Asia - FSU - 79.5°E to 82.5°E onshore | 41.82 | 79.5 | 81.03 | 82.5 |
| Pulkovo_1942_3_Degree_GK_Zone_28 | 2544 | Asia - FSU - 82.5°E to 85.5°E onshore | 45.11 | 82.5 | 77.56 | 85.5 |
| Pulkovo_1942_3_Degree_GK_Zone_29 | 2545 | Asia - FSU - 85.5°E to 88.5°E onshore | 47.05 | 85.5 | 77.16 | 88.5 |
| Pulkovo_1942_3_Degree_GK_Zone_30 | 2546 | Russia - 88.5°E to 91.5°E onshore | 49.44 | 88.5 | 81.28 | 91.5 |
| Pulkovo_1942_3_Degree_GK_Zone_31 | 2547 | Russia - 91.5°E to 94.5°E onshore | 50.16 | 91.5 | 81.26 | 94.5 |
| Pulkovo_1942_3_Degree_GK_Zone_32 | 2548 | Russia - 94.5°E to 97.5°E onshore | 49.73 | 94.5 | 81.35 | 97.5 |
| Pulkovo_1942_3_Degree_GK_Zone_33 | 2549 | Russia - 97.5°E to 100.5°E onshore | 49.79 | 97.5 | 80.9 | 100.5 |
| Pulkovo_1942_3_Degree_GK_Zone_34 | 2551 | Russia - 100.5°E to 103.5°E onshore | 50.17 | 100.5 | 79.71 | 103.5 |
| Pulkovo_1942_3_Degree_GK_Zone_35 | 2552 | Russia - 103.5°E to 106.5°E onshore | 50.13 | 103.5 | 79.21 | 106.5 |
| Pulkovo_1942_3_Degree_GK_Zone_36 | 2553 | Russia - 106.5°E to 109.5°E onshore | 49.25 | 106.5 | 78.4 | 109.5 |
| Pulkovo_1942_3_Degree_GK_Zone_37 | 2554 | Russia - 109.5°E to 112.5°E onshore | 49.14 | 109.5 | 76.81 | 112.5 |
| Pulkovo_1942_3_Degree_GK_Zone_38 | 2555 | Russia - 112.5°E to 115.5°E onshore | 49.49 | 112.5 | 76.7 | 115.5 |
| Pulkovo_1942_3_Degree_GK_Zone_39 | 2556 | Russia - 115.5°E to 118.5°E onshore | 49.51 | 115.5 | 74.43 | 118.5 |
| Pulkovo_1942_3_Degree_GK_Zone_40 | 2557 | Russia - 118.5°E to 121.5°E onshore | 49.87 | 118.5 | 73.63 | 121.5 |
| Pulkovo_1942_3_Degree_GK_Zone_41 | 2558 | Russia - 121.5°E to 124.5°E onshore | 53.18 | 121.5 | 74 | 124.5 |
| Pulkovo_1942_3_Degree_GK_Zone_42 | 2559 | Russia - 124.5°E to 127.5°E onshore | 49.88 | 124.5 | 74 | 127.5 |
| Pulkovo_1942_3_Degree_GK_Zone_43 | 2560 | Russia - 127.5°E to 130.5°E onshore | 42.67 | 127.5 | 73.59 | 130.5 |
| Pulkovo_1942_3_Degree_GK_Zone_44 | 2561 | Russia - 130.5°E to 133.5°E onshore | 42.25 | 130.5 | 71.99 | 133.5 |
| Pulkovo_1942_3_Degree_GK_Zone_45 | 2562 | Russia - 133.5°E to 136.5°E onshore | 42.74 | 133.5 | 75.9 | 136.5 |
| Pulkovo_1942_3_Degree_GK_Zone_46 | 2563 | Russia - 136.5°E to 139.5°E onshore | 44.76 | 136.5 | 76.27 | 139.5 |
| Pulkovo_1942_3_Degree_GK_Zone_47 | 2564 | Russia - 139.5°E to 142.5°E onshore | 45.84 | 139.5 | 76.23 | 142.5 |
| Pulkovo_1942_3_Degree_GK_Zone_48 | 2565 | Russia - 142.5°E to 145.5°E onshore | 43.61 | 142.5 | 75.98 | 145.5 |
| Pulkovo_1942_3_Degree_GK_Zone_49 | 2566 | Russia - 145.5°E to 148.5°E onshore | 43.6 | 145.5 | 76.76 | 148.5 |
| Pulkovo_1942_3_Degree_GK_Zone_50 | 2567 | Russia - 148.5°E to 151.5°E onshore | 45.21 | 148.5 | 76.82 | 151.5 |
| Pulkovo_1942_3_Degree_GK_Zone_51 | 2568 | Russia - 151.5°E to 154.5°E onshore | 46.72 | 151.5 | 76.26 | 154.5 |
| Pulkovo_1942_3_Degree_GK_Zone_52 | 2569 | Russia - 154.5°E to 157.5°E onshore | 49.02 | 154.5 | 77.2 | 157.5 |
| Pulkovo_1942_3_Degree_GK_Zone_53 | 2570 | Russia - 157.5°E to 160.5°E onshore | 51.36 | 157.5 | 71.12 | 160.5 |
| Pulkovo_1942_3_Degree_GK_Zone_54 | 2571 | Russia - 160.5°E to 163.5°E onshore | 54.34 | 160.5 | 70.98 | 163.5 |
| Pulkovo_1942_3_Degree_GK_Zone_55 | 2572 | Russia - 163.5°E to 166.5°E onshore | 54.69 | 163.5 | 69.82 | 166.5 |
| Pulkovo_1942_3_Degree_GK_Zone_56 | 2573 | Russia - 166.5°E to 169.5°E onshore | 54.45 | 166.5 | 70.07 | 169.5 |
| Pulkovo_1942_3_Degree_GK_Zone_57 | 2574 | Russia - 169.5°E to 172.5°E onshore | 59.86 | 169.5 | 70.19 | 172.5 |
| Pulkovo_1942_3_Degree_GK_Zone_58 | 2575 | Russia - 172.5°E to 175.5°E onshore | 60.99 | 172.5 | 70.02 | 175.5 |
| Pulkovo_1942_3_Degree_GK_Zone_59 | 2576 | Russia - 175.5°E to 178.5°E onshore | 62.09 | 175.5 | 71.1 | 178.5 |
| Pulkovo_1942_3_Degree_GK_Zone_6 | 3146 | Russia - west of 19.5°E | 54.32 | 19.2 | 55.3 | 19.5 |
| Pulkovo_1942_3_Degree_GK_Zone_60 | 3389 | Russia - 178.5°E to 178.5°W onshore | 62.24 | 178.5 | 71.65 | -178.5 |
| Pulkovo_1942_3_Degree_GK_Zone_61 | 2578 | Russia - 178.5°W to 175.5°W onshore | 64.74 | -178.5 | 71.61 | -175.5 |
| Pulkovo_1942_3_Degree_GK_Zone_62 | 2579 | Russia - 175.5°W to 172.5°W onshore | 64.2 | -175.5 | 67.78 | -172.5 |
| Pulkovo_1942_3_Degree_GK_Zone_63 | 2580 | Russia - 172.5°W to 169.5°W onshore | 64.35 | -172.5 | 67.06 | -169.57 |
| Pulkovo_1942_3_Degree_GK_Zone_64 | 2581 | Russia - east of 169.5°W onshore | 65.7 | -169.22 | 65.86 | -168.97 |
| Pulkovo_1942_3_Degree_GK_Zone_7 | 2523 | Europe - FSU - 19.5°E to 22.5°E onshore | 48.24 | 19.57 | 59.1 | 22.5 |
| Pulkovo_1942_3_Degree_GK_Zone_8 | 2524 | Europe - FSU - 22.5°E to 25.5°E onshore | 47.71 | 22.5 | 59.75 | 25.5 |
| Pulkovo_1942_3_Degree_GK_Zone_9 | 2525 | Europe - FSU - 25.5°E to 28.5°E onshore | 45.26 | 25.49 | 68.93 | 28.51 |
| Pulkovo_1942_Adj_1958_3_Degree_GK_ Zone_10 | 3840 | Europe - 28.5°E to 31.5°E onshore and S- 42(58) by country | 43.34 | 28.5 | 45.44 | 29.74 |
| Pulkovo_1942_Adj_1958_3_Degree_GK_ Zone_3 | 3837 | Germany - East Germany - west of 10.5°E | 50.35 | 9.92 | 51.56 | 10.5 |
| Pulkovo_1942_Adj_1958_3_Degree_GK_ Zone_3_E-N | 5670 | Germany - East Germany - west of 10.5°E | 50.35 | 9.92 | 51.56 | 10.5 |
| Pulkovo_1942_Adj_1958_3_Degree_GK_ Zone_4 | 3838 | Europe - 10.5°E to 13.5°E onshore by country | 48.97 | 10.5 | 54.74 | 13.5 |
| Pulkovo_1942_Adj_1958_3_Degree_GK_ Zone_4_E-N | 5671 | Europe - 10.5°E to 13.5°E onshore by country | 48.97 | 10.5 | 54.74 | 13.5 |
| Pulkovo_1942_Adj_1958_3_Degree_GK_ Zone_5 | 3329 | Europe - 13.5°E to 16.5°E onshore and S- 42(58) by country | 46.54 | 13.5 | 54.72 | 16.5 |
| Pulkovo_1942_Adj_1958_3_Degree_GK_ Zone_5_E-N | 5672 | Europe - 13.5°E to 16.5°E onshore and S- 42(58) by country | 46.54 | 13.5 | 54.72 | 16.5 |
| Pulkovo_1942_Adj_1958_3_Degree_GK_ Zone_6 | 3330 | Europe - 16.5°E to 19.5°E onshore and S- 42(58) by country | 40.14 | 16.5 | 54.89 | 19.5 |
| Pulkovo_1942_Adj_1958_3_Degree_GK_ Zone_7 | 3331 | Europe - 19.5°E to 22.5°E onshore and S- 42(58) by country | 39.64 | 19.5 | 54.51 | 22.5 |
| Pulkovo_1942_Adj_1958_3_Degree_GK_ Zone_8 | 3332 | Europe - 22.5°E to 25.5°E onshore and S- 42(58) by country | 41.24 | 22.5 | 54.41 | 25.5 |
| Pulkovo_1942_Adj_1958_3_Degree_GK_ Zone_9 | 3839 | Europe - 25.5°E to 28.5°E onshore and S- 42(58) by country | 41.28 | 25.5 | 48.27 | 28.5 |
| Pulkovo_1942_Adj_1958_GK_Zone_2 | 3833 | Germany - East Germany - west of 12°E | 50.2 | 9.92 | 54.23 | 12 |
| Pulkovo_1942_Adj_1958_GK_Zone_2_ E-N | 5631 | Germany - East Germany - west of 12°E | 50.2 | 9.92 | 54.23 | 12 |
| Pulkovo_1942_Adj_1958_GK_Zone_3 | 3333 | Europe - 12°E to 18°E onshore and S-42(58) by country | 45.78 | 12 | 54.89 | 18 |
| Pulkovo_1942_Adj_1958_GK_Zone_3_ E-N | 5663 | Europe - 12°E to 18°E onshore and S-42(58) by country | 45.78 | 12 | 54.89 | 18 |
| Pulkovo_1942_Adj_1958_GK_Zone_4 | 3334 | Europe - 18°E to 24°E onshore and S-42(58) by country | 39.64 | 18 | 54.89 | 24 |
| Pulkovo_1942_Adj_1958_GK_Zone_5 | 3335 | Europe - 24°E to 30°E onshore and S-42(58) by country | 41.24 | 24 | 50.93 | 29.74 |
| Pulkovo_1942_Adj_1958_GUGiK-80 | 3328 | Poland - onshore | 49 | 14.14 | 54.89 | 24.15 |
| Pulkovo_1942_Adj_1958_Poland_Zone_I | 3120 | Poland - zone I | 49 | 18 | 52.34 | 24.15 |
| Pulkovo_1942_Adj_1958_Poland_Zone_II | 2172 | Poland - zone II | 51.33 | 19 | 54.51 | 23.95 |
| Pulkovo_1942_Adj_1958_Poland_Zone_ III | 2173 | Poland - zone III | 52.16 | 14.14 | 54.89 | 20 |
| Pulkovo_1942_Adj_1958_Poland_Zone_ IV | 2174 | Poland - zone IV | 49.39 | 14.14 | 53.34 | 19.09 |
| Pulkovo_1942_Adj_1958_Poland_Zone_V | 2175 | Poland - zone V | 49.39 | 18.33 | 51.34 | 19.67 |
| Pulkovo_1942_Adj_1983_3_Degree_GK_ Zone_3 | 2397 | Germany - East Germany - west of 10.5°E | 50.35 | 9.92 | 51.56 | 10.5 |
| Pulkovo_1942_Adj_1983_3_Degree_GK_ Zone_3_E-N | 5673 | Germany - East Germany - west of 10.5°E | 50.35 | 9.92 | 51.56 | 10.5 |
| Pulkovo_1942_Adj_1983_3_Degree_GK_ Zone_4 | 2398 | Europe - 10.5°E to 13.5°E onshore by country | 48.97 | 10.5 | 54.74 | 13.5 |
| Pulkovo_1942_Adj_1983_3_Degree_GK_ Zone_4_E-N | 5674 | Europe - 10.5°E to 13.5°E onshore by country | 48.97 | 10.5 | 54.74 | 13.5 |
| Pulkovo_1942_Adj_1983_3_Degree_GK_ Zone_5 | 2399 | Europe - 13.5°E to 16.5°E onshore and S- 42(83) by country | 46.54 | 13.5 | 54.72 | 16.5 |
| Pulkovo_1942_Adj_1983_3_Degree_GK_ Zone_5_E-N | 5675 | Europe - 13.5°E to 16.5°E onshore and S- 42(83) by country | 46.54 | 13.5 | 54.72 | 16.5 |
| Pulkovo_1942_Adj_1983_3_Degree_GK_ Zone_6 | 3841 | Europe - 16.5°E to 19.5°E onshore and S- 42(83) by country | 45.74 | 16.5 | 50.45 | 19.5 |
| Pulkovo_1942_Adj_1983_3_Degree_GK_ Zone_7 | 4417 | Europe - 19.5°E to 22.5°E onshore and S- 42(83) by country | 46.1 | 19.5 | 49.59 | 22.5 |
| Pulkovo_1942_Adj_1983_3_Degree_GK_ Zone_8 | 4434 | Europe - 22.5°E to 25.5°E onshore and S- 42(83) by country | 47.76 | 22.5 | 49.1 | 22.9 |
| Pulkovo_1942_Adj_1983_GK_Zone_2 | 3834 | Germany - East Germany - west of 12°E | 50.2 | 9.92 | 54.23 | 12 |
| Pulkovo_1942_Adj_1983_GK_Zone_2_ E-N | 5664 | Germany - East Germany - west of 12°E | 50.2 | 9.92 | 54.23 | 12 |
| Pulkovo_1942_Adj_1983_GK_Zone_3 | 3835 | Europe - 12°E to 18°E onshore and S-42(83) by country | 45.78 | 12 | 54.74 | 18.01 |
| Pulkovo_1942_Adj_1983_GK_Zone_3_E- N | 5665 | Europe - 12°E to 18°E onshore and S-42(83) by country | 45.78 | 12 | 54.74 | 18.01 |
| Pulkovo_1942_Adj_1983_GK_Zone_4 | 3836 | Europe - 18°E to 24°E onshore and S-42(83) by country | 45.74 | 18 | 50.06 | 22.9 |
| Pulkovo_1942_Adj_58_Stereo_70 | 3844 | Romania | 43.44 | 20.26 | 48.27 | 31.41 |
| Pulkovo_1942_Caspian_Sea_Mercator | 3388 | Asia - FSU - Caspian Sea | 37.35 | 46.95 | 46.97 | 53.93 |
| Pulkovo_1942_CS63_Zone_A1 | 2935 | Asia - FSU - CS63 zone A1 | 41.37 | 39.99 | 43.59 | 43.04 |
| Pulkovo_1942_CS63_Zone_A2 | 2936 | Asia - FSU - CS63 zone A2 | 38.87 | 43.03 | 43.05 | 46.04 |
| Pulkovo_1942_CS63_Zone_A3 | 2937 | Asia - FSU - CS63 zone A3 | 38.38 | 46.03 | 42.1 | 49.04 |
| Pulkovo_1942_CS63_Zone_A4 | 2938 | Asia - FSU - CS63 zone A4 | 37.89 | 49.03 | 42.59 | 51.73 |
| Pulkovo_1942_CS63_Zone_C0 | 3350 | Europe - FSU - CS63 zone C0 | 54.17 | 19.57 | 59.27 | 23.45 |
| Pulkovo_1942_CS63_Zone_C1 | 3351 | Europe - FSU - CS63 zone C1 | 53.89 | 23.45 | 59.72 | 26.45 |
| Pulkovo_1942_CS63_Zone_C2 | 3352 | Europe - FSU - CS63 zone C2 | 55.15 | 26.45 | 59.61 | 28.24 |
| Pulkovo_1942_CS63_Zone_K2 | 2939 | Asia - FSU - CS63 zone K2 | 41.15 | 49.26 | 51.77 | 52.27 |
| Pulkovo_1942_CS63_Zone_K3 | 2940 | Asia - FSU - CS63 zone K3 | 41.46 | 52.26 | 51.79 | 55.27 |
| Pulkovo_1942_CS63_Zone_K4 | 2941 | Asia - FSU - CS63 zone K4 | 41.26 | 55.26 | 51.14 | 58.27 |
| Pulkovo_1942_CS63_zone_X1 | 7825 | Ukraine - west of 25°E | 47.71 | 22.15 | 51.92 | 25.01 |
| Pulkovo_1942_CS63_zone_X2 | 7826 | Ukraine - 25°E to 28°E | 47.72 | 25 | 51.96 | 28.01 |
| Pulkovo_1942_CS63_zone_X3 | 7827 | Ukraine - 28°E to 31°E onshore | 45.18 | 28 | 52.09 | 31.01 |
| Pulkovo_1942_CS63_zone_X4 | 7828 | Ukraine - 31°E to 34°E onshore | 44.32 | 31 | 52.38 | 34.01 |
| Pulkovo_1942_CS63_zone_X5 | 7829 | Ukraine - 34°E to 37°E onshore | 44.33 | 34 | 52.25 | 37.01 |
| Pulkovo_1942_CS63_zone_X6 | 7830 | Ukraine - 37°E to 40°E onshore | 46.8 | 37 | 50.44 | 40.01 |
| Pulkovo_1942_CS63_zone_X7 | 7831 | Ukraine - east of 40°E | 48.8 | 40 | 49.62 | 40.18 |
| Pulkovo_1942_Gauss-Kruger_CM_105E | 2508 | Russia - 102°E to 108°E onshore | 49.64 | 102 | 79.48 | 108 |
| Pulkovo_1942_Gauss-Kruger_CM_111E | 2509 | Russia - 108°E to 114°E onshore | 49.14 | 108 | 76.81 | 114 |
| Pulkovo_1942_Gauss-Kruger_CM_117E | 2510 | Russia - 114°E to 120°E onshore | 49.51 | 114 | 75.96 | 120 |
| Pulkovo_1942_Gauss-Kruger_CM_123E | 2511 | Russia - 120°E to 126°E onshore | 51.51 | 120 | 74 | 126 |
| Pulkovo_1942_Gauss-Kruger_CM_129E | 2512 | Russia - 126°E to 132°E onshore | 42.25 | 126 | 73.61 | 132 |
| Pulkovo_1942_Gauss-Kruger_CM_135E | 2513 | Russia - 132°E to 138°E onshore | 42.63 | 132 | 76.15 | 138 |
| Pulkovo_1942_Gauss-Kruger_CM_141E | 2514 | Russia - 138°E to 144°E onshore | 45.84 | 138 | 76.27 | 144 |
| Pulkovo_1942_Gauss-Kruger_CM_147E | 2515 | Russia - 144°E to 150°E onshore | 43.6 | 144 | 76.82 | 150 |
| Pulkovo_1942_Gauss-Kruger_CM_153E | 2516 | Russia - 150°E to 156°E onshore | 45.77 | 150 | 76.26 | 156 |
| Pulkovo_1942_Gauss-Kruger_CM_159E | 2517 | Russia - 156°E to 162°E onshore | 50.27 | 156 | 77.2 | 162 |
| Pulkovo_1942_Gauss-Kruger_CM_165E | 2518 | Russia - 162°E to 168°E onshore | 54.47 | 162 | 70.03 | 168 |
| Pulkovo_1942_Gauss-Kruger_CM_171E | 2519 | Russia - 168°E to 174°E onshore | 54.45 | 168 | 70.19 | 174 |
| Pulkovo_1942_Gauss-Kruger_CM_171W | 2522 | Russia - east of 174°W onshore | 64.2 | -174 | 67.18 | -168.97 |
| Pulkovo_1942_Gauss-Kruger_CM_177E | 2520 | Russia - 174°E to 180°E onshore | 61.65 | 174 | 71.59 | 180 |
| Pulkovo_1942_Gauss-Kruger_CM_177W | 2521 | Russia - 180° to 174°W onshore | 64.35 | -180 | 71.65 | -174 |
| Pulkovo_1942_Gauss-Kruger_CM_21E | 2494 | Europe - FSU onshore 18°E to 24°E and S-42 by country | 47.95 | 19.57 | 59.44 | 24 |
| Pulkovo_1942_Gauss-Kruger_CM_27E | 2495 | Europe - FSU onshore 24°E to 30°E and S-42 by country | 45.18 | 24 | 69.47 | 30.01 |
| Pulkovo_1942_Gauss-Kruger_CM_33E | 2496 | Europe - FSU onshore 30°E to 36°E | 44.32 | 30 | 70.02 | 36 |
| Pulkovo_1942_Gauss-Kruger_CM_39E | 2497 | Europe - FSU onshore 36°E to 42°E | 41.43 | 36 | 69.23 | 42 |
| Pulkovo_1942_Gauss-Kruger_CM_45E | 2498 | Europe - FSU onshore 42°E to 48°E | 38.84 | 42 | 80.91 | 48.01 |
| Pulkovo_1942_Gauss-Kruger_CM_51E | 2499 | Asia - FSU onshore 48°E to 54°E | 37.34 | 48 | 81.4 | 54 |
| Pulkovo_1942_Gauss-Kruger_CM_57E | 2500 | Asia - FSU onshore 54°E to 60°E | 37.05 | 54 | 81.91 | 60 |
| Pulkovo_1942_Gauss-Kruger_CM_63E | 2501 | Asia - FSU onshore 60°E to 66°E | 35.14 | 60 | 81.77 | 66 |
| Pulkovo_1942_Gauss-Kruger_CM_69E | 2502 | Asia - FSU onshore 66°E to 72°E | 36.67 | 66 | 77.07 | 72 |
| Pulkovo_1942_Gauss-Kruger_CM_75E | 2503 | Asia - FSU onshore 72°E to 78°E | 36.79 | 72 | 79.71 | 78 |
| Pulkovo_1942_Gauss-Kruger_CM_81E | 2504 | Asia - FSU onshore 78°E to 84°E | 41.04 | 78 | 81.03 | 84.01 |
| Pulkovo_1942_Gauss-Kruger_CM_87E | 2505 | Asia - FSU onshore 84°E to 90°E | 46.82 | 84 | 81.27 | 90 |
| Pulkovo_1942_Gauss-Kruger_CM_93E | 2506 | Russia - 90°E to 96°E onshore | 49.89 | 90 | 81.35 | 96 |
| Pulkovo_1942_Gauss-Kruger_CM_99E | 2507 | Russia - 96°E to 102°E onshore | 49.73 | 96 | 81.32 | 102 |
| Pulkovo_1942_GK_Zone_10 | 28410 | Asia - FSU onshore 54°E to 60°E | 37.05 | 54 | 81.91 | 60 |
| Pulkovo_1942_GK_Zone_10N | 28470 | Asia - FSU onshore 54°E to 60°E | 37.05 | 54 | 81.91 | 60 |
| Pulkovo_1942_GK_Zone_11 | 28411 | Asia - FSU onshore 60°E to 66°E | 35.14 | 60 | 81.77 | 66 |
| Pulkovo_1942_GK_Zone_11N | 28471 | Asia - FSU onshore 60°E to 66°E | 35.14 | 60 | 81.77 | 66 |
| Pulkovo_1942_GK_Zone_12 | 28412 | Asia - FSU onshore 66°E to 72°E | 36.67 | 66 | 77.07 | 72 |
| Pulkovo_1942_GK_Zone_12N | 28472 | Asia - FSU onshore 66°E to 72°E | 36.67 | 66 | 77.07 | 72 |
| Pulkovo_1942_GK_Zone_13 | 28413 | Asia - FSU onshore 72°E to 78°E | 36.79 | 72 | 79.71 | 78 |
| Pulkovo_1942_GK_Zone_13N | 28473 | Asia - FSU onshore 72°E to 78°E | 36.79 | 72 | 79.71 | 78 |
| Pulkovo_1942_GK_Zone_14 | 28414 | Asia - FSU onshore 78°E to 84°E | 41.04 | 78 | 81.03 | 84.01 |
| Pulkovo_1942_GK_Zone_14N | 28474 | Asia - FSU onshore 78°E to 84°E | 41.04 | 78 | 81.03 | 84.01 |
| Pulkovo_1942_GK_Zone_15 | 28415 | Asia - FSU onshore 84°E to 90°E | 46.82 | 84 | 81.27 | 90 |
| Pulkovo_1942_GK_Zone_15N | 28475 | Asia - FSU onshore 84°E to 90°E | 46.82 | 84 | 81.27 | 90 |
| Pulkovo_1942_GK_Zone_16 | 28416 | Russia - 90°E to 96°E onshore | 49.89 | 90 | 81.35 | 96 |
| Pulkovo_1942_GK_Zone_16N | 28476 | Russia - 90°E to 96°E onshore | 49.89 | 90 | 81.35 | 96 |
| Pulkovo_1942_GK_Zone_17 | 28417 | Russia - 96°E to 102°E onshore | 49.73 | 96 | 81.32 | 102 |
| Pulkovo_1942_GK_Zone_17N | 28477 | Russia - 96°E to 102°E onshore | 49.73 | 96 | 81.32 | 102 |
| Pulkovo_1942_GK_Zone_18 | 28418 | Russia - 102°E to 108°E onshore | 49.64 | 102 | 79.48 | 108 |
| Pulkovo_1942_GK_Zone_18N | 28478 | Russia - 102°E to 108°E onshore | 49.64 | 102 | 79.48 | 108 |
| Pulkovo_1942_GK_Zone_19 | 28419 | Russia - 108°E to 114°E onshore | 49.14 | 108 | 76.81 | 114 |
| Pulkovo_1942_GK_Zone_19N | 28479 | Russia - 108°E to 114°E onshore | 49.14 | 108 | 76.81 | 114 |
| Pulkovo_1942_GK_Zone_2 | 28402 | Europe - 6°E to 12°E and Pulkovo by country | 50.21 | 9.93 | 54.18 | 12 |
| Pulkovo_1942_GK_Zone_20 | 28420 | Russia - 114°E to 120°E onshore | 49.51 | 114 | 75.96 | 120 |
| Pulkovo_1942_GK_Zone_20N | 28480 | Russia - 114°E to 120°E onshore | 49.51 | 114 | 75.96 | 120 |
| Pulkovo_1942_GK_Zone_21 | 28421 | Russia - 120°E to 126°E onshore | 51.51 | 120 | 74 | 126 |
| Pulkovo_1942_GK_Zone_21N | 28481 | Russia - 120°E to 126°E onshore | 51.51 | 120 | 74 | 126 |
| Pulkovo_1942_GK_Zone_22 | 28422 | Russia - 126°E to 132°E onshore | 42.25 | 126 | 73.61 | 132 |
| Pulkovo_1942_GK_Zone_22N | 28482 | Russia - 126°E to 132°E onshore | 42.25 | 126 | 73.61 | 132 |
| Pulkovo_1942_GK_Zone_23 | 28423 | Russia - 132°E to 138°E onshore | 42.63 | 132 | 76.15 | 138 |
| Pulkovo_1942_GK_Zone_23N | 28483 | Russia - 132°E to 138°E onshore | 42.63 | 132 | 76.15 | 138 |
| Pulkovo_1942_GK_Zone_24 | 28424 | Russia - 138°E to 144°E onshore | 45.84 | 138 | 76.27 | 144 |
| Pulkovo_1942_GK_Zone_24N | 28484 | Russia - 138°E to 144°E onshore | 45.84 | 138 | 76.27 | 144 |
| Pulkovo_1942_GK_Zone_25 | 28425 | Russia - 144°E to 150°E onshore | 43.6 | 144 | 76.82 | 150 |
| Pulkovo_1942_GK_Zone_25N | 28485 | Russia - 144°E to 150°E onshore | 43.6 | 144 | 76.82 | 150 |
| Pulkovo_1942_GK_Zone_26 | 28426 | Russia - 150°E to 156°E onshore | 45.77 | 150 | 76.26 | 156 |
| Pulkovo_1942_GK_Zone_26N | 28486 | Russia - 150°E to 156°E onshore | 45.77 | 150 | 76.26 | 156 |
| Pulkovo_1942_GK_Zone_27 | 28427 | Russia - 156°E to 162°E onshore | 50.27 | 156 | 77.2 | 162 |
| Pulkovo_1942_GK_Zone_27N | 28487 | Russia - 156°E to 162°E onshore | 50.27 | 156 | 77.2 | 162 |
| Pulkovo_1942_GK_Zone_28 | 28428 | Russia - 162°E to 168°E onshore | 54.47 | 162 | 70.03 | 168 |
| Pulkovo_1942_GK_Zone_28N | 28488 | Russia - 162°E to 168°E onshore | 54.47 | 162 | 70.03 | 168 |
| Pulkovo_1942_GK_Zone_29 | 28429 | Russia - 168°E to 174°E onshore | 54.45 | 168 | 70.19 | 174 |
| Pulkovo_1942_GK_Zone_29N | 28489 | Russia - 168°E to 174°E onshore | 54.45 | 168 | 70.19 | 174 |
| Pulkovo_1942_GK_Zone_2N | 28462 | Europe - 6°E to 12°E and Pulkovo by country | 50.21 | 9.93 | 54.18 | 12 |
| Pulkovo_1942_GK_Zone_3 | 28403 | Europe - 12°E to 18°E onshore and S-42(58) by country | 45.78 | 12 | 54.89 | 18 |
| Pulkovo_1942_GK_Zone_30 | 28430 | Russia - 174°E to 180°E onshore | 61.65 | 174 | 71.59 | 180 |
| Pulkovo_1942_GK_Zone_30N | 28490 | Russia - 174°E to 180°E onshore | 61.65 | 174 | 71.59 | 180 |
| Pulkovo_1942_GK_Zone_31 | 28431 | Russia - 180° to 174°W onshore | 64.35 | -180 | 71.65 | -174 |
| Pulkovo_1942_GK_Zone_31N | 28491 | Russia - 180° to 174°W onshore | 64.35 | -180 | 71.65 | -174 |
| Pulkovo_1942_GK_Zone_32 | 28432 | Russia - east of 174°W onshore | 64.2 | -174 | 67.18 | -168.97 |
| Pulkovo_1942_GK_Zone_32N | 28492 | Russia - east of 174°W onshore | 64.2 | -174 | 67.18 | -168.97 |
| Pulkovo_1942_GK_Zone_3N | 28463 | Europe - 12°E to 18°E onshore and S-42(58) by country | 45.78 | 12 | 54.89 | 18 |
| Pulkovo_1942_GK_Zone_4 | 28404 | Europe - FSU onshore 18°E to 24°E and S-42 by country | 47.95 | 19.57 | 59.44 | 24 |
| Pulkovo_1942_GK_Zone_4N | 28464 | Europe - FSU onshore 18°E to 24°E and S-42 by country | 47.95 | 19.57 | 59.44 | 24 |
| Pulkovo_1942_GK_Zone_5 | 28405 | Europe - FSU onshore 24°E to 30°E and S-42 by country | 45.18 | 24 | 69.47 | 30.01 |
| Pulkovo_1942_GK_Zone_5N | 28465 | Europe - FSU onshore 24°E to 30°E and S-42 by country | 45.18 | 24 | 69.47 | 30.01 |
| Pulkovo_1942_GK_Zone_6 | 28406 | Europe - FSU onshore 30°E to 36°E | 44.32 | 30 | 70.02 | 36 |
| Pulkovo_1942_GK_Zone_6N | 28466 | Europe - FSU onshore 30°E to 36°E | 44.32 | 30 | 70.02 | 36 |
| Pulkovo_1942_GK_Zone_7 | 28407 | Europe - FSU onshore 36°E to 42°E | 41.43 | 36 | 69.23 | 42 |
| Pulkovo_1942_GK_Zone_7N | 28467 | Europe - FSU onshore 36°E to 42°E | 41.43 | 36 | 69.23 | 42 |
| Pulkovo_1942_GK_Zone_8 | 28408 | Europe - FSU onshore 42°E to 48°E | 38.84 | 42 | 80.91 | 48.01 |
| Pulkovo_1942_GK_Zone_8N | 28468 | Europe - FSU onshore 42°E to 48°E | 38.84 | 42 | 80.91 | 48.01 |
| Pulkovo_1942_GK_Zone_9 | 28409 | Asia - FSU onshore 48°E to 54°E | 37.34 | 48 | 81.4 | 54 |
| Pulkovo_1942_GK_Zone_9N | 28469 | Asia - FSU onshore 48°E to 54°E | 37.34 | 48 | 81.4 | 54 |
| Pulkovo_1995_3_Degree_GK_CM_102E | 2726 | Russia - 100.5°E to 103.5°E onshore | 50.17 | 100.5 | 79.71 | 103.5 |
| Pulkovo_1995_3_Degree_GK_CM_105E | 2727 | Russia - 103.5°E to 106.5°E onshore | 50.13 | 103.5 | 79.21 | 106.5 |
| Pulkovo_1995_3_Degree_GK_CM_108E | 2728 | Russia - 106.5°E to 109.5°E onshore | 49.25 | 106.5 | 78.4 | 109.5 |
| Pulkovo_1995_3_Degree_GK_CM_111E | 2729 | Russia - 109.5°E to 112.5°E onshore | 49.14 | 109.5 | 76.81 | 112.5 |
| Pulkovo_1995_3_Degree_GK_CM_114E | 2730 | Russia - 112.5°E to 115.5°E onshore | 49.49 | 112.5 | 76.7 | 115.5 |
| Pulkovo_1995_3_Degree_GK_CM_117E | 2731 | Russia - 115.5°E to 118.5°E onshore | 49.51 | 115.5 | 74.43 | 118.5 |
| Pulkovo_1995_3_Degree_GK_CM_120E | 2732 | Russia - 118.5°E to 121.5°E onshore | 49.87 | 118.5 | 73.63 | 121.5 |
| Pulkovo_1995_3_Degree_GK_CM_123E | 2733 | Russia - 121.5°E to 124.5°E onshore | 53.18 | 121.5 | 74 | 124.5 |
| Pulkovo_1995_3_Degree_GK_CM_126E | 2734 | Russia - 124.5°E to 127.5°E onshore | 49.88 | 124.5 | 74 | 127.5 |
| Pulkovo_1995_3_Degree_GK_CM_129E | 2735 | Russia - 127.5°E to 130.5°E onshore | 42.67 | 127.5 | 73.59 | 130.5 |
| Pulkovo_1995_3_Degree_GK_CM_132E | 2738 | Russia - 130.5°E to 133.5°E onshore | 42.25 | 130.5 | 71.99 | 133.5 |
| Pulkovo_1995_3_Degree_GK_CM_135E | 2739 | Russia - 133.5°E to 136.5°E onshore | 42.74 | 133.5 | 75.9 | 136.5 |
| Pulkovo_1995_3_Degree_GK_CM_138E | 2740 | Russia - 136.5°E to 139.5°E onshore | 44.76 | 136.5 | 76.27 | 139.5 |
| Pulkovo_1995_3_Degree_GK_CM_141E | 2741 | Russia - 139.5°E to 142.5°E onshore | 45.84 | 139.5 | 76.23 | 142.5 |
| Pulkovo_1995_3_Degree_GK_CM_144E | 2742 | Russia - 142.5°E to 145.5°E onshore | 43.61 | 142.5 | 75.98 | 145.5 |
| Pulkovo_1995_3_Degree_GK_CM_147E | 2743 | Russia - 145.5°E to 148.5°E onshore | 43.6 | 145.5 | 76.76 | 148.5 |
| Pulkovo_1995_3_Degree_GK_CM_150E | 2744 | Russia - 148.5°E to 151.5°E onshore | 45.21 | 148.5 | 76.82 | 151.5 |
| Pulkovo_1995_3_Degree_GK_CM_153E | 2745 | Russia - 151.5°E to 154.5°E onshore | 46.72 | 151.5 | 76.26 | 154.5 |
| Pulkovo_1995_3_Degree_GK_CM_156E | 2746 | Russia - 154.5°E to 157.5°E onshore | 49.02 | 154.5 | 77.2 | 157.5 |
| Pulkovo_1995_3_Degree_GK_CM_159E | 2747 | Russia - 157.5°E to 160.5°E onshore | 51.36 | 157.5 | 71.12 | 160.5 |
| Pulkovo_1995_3_Degree_GK_CM_162E | 2748 | Russia - 160.5°E to 163.5°E onshore | 54.34 | 160.5 | 70.98 | 163.5 |
| Pulkovo_1995_3_Degree_GK_CM_165E | 2749 | Russia - 163.5°E to 166.5°E onshore | 54.69 | 163.5 | 69.82 | 166.5 |
| Pulkovo_1995_3_Degree_GK_CM_168E | 2750 | Russia - 166.5°E to 169.5°E onshore | 54.45 | 166.5 | 70.07 | 169.5 |
| Pulkovo_1995_3_Degree_GK_CM_168W | 2758 | Russia - east of 169.5°W onshore | 65.7 | -169.22 | 65.86 | -168.97 |
| Pulkovo_1995_3_Degree_GK_CM_171E | 2751 | Russia - 169.5°E to 172.5°E onshore | 59.86 | 169.5 | 70.19 | 172.5 |
| Pulkovo_1995_3_Degree_GK_CM_171W | 2757 | Russia - 172.5°W to 169.5°W onshore | 64.35 | -172.5 | 67.06 | -169.57 |
| Pulkovo_1995_3_Degree_GK_CM_174E | 2752 | Russia - 172.5°E to 175.5°E onshore | 60.99 | 172.5 | 70.02 | 175.5 |
| Pulkovo_1995_3_Degree_GK_CM_174W | 2756 | Russia - 175.5°W to 172.5°W onshore | 64.2 | -175.5 | 67.78 | -172.5 |
| Pulkovo_1995_3_Degree_GK_CM_177E | 2753 | Russia - 175.5°E to 178.5°E onshore | 62.09 | 175.5 | 71.1 | 178.5 |
| Pulkovo_1995_3_Degree_GK_CM_177W | 2755 | Russia - 178.5°W to 175.5°W onshore | 64.74 | -178.5 | 71.61 | -175.5 |
| Pulkovo_1995_3_Degree_GK_CM_180E | 2754 | Russia - 178.5°E to 178.5°W onshore | 62.24 | 178.5 | 71.65 | -178.5 |
| Pulkovo_1995_3_Degree_GK_CM_18E | 3151 | Russia - west of 19.5°E | 54.32 | 19.2 | 55.3 | 19.5 |
| Pulkovo_1995_3_Degree_GK_CM_21E | 2699 | Russia - 19.5°E to 22.5°E onshore | 54.32 | 19.57 | 55.32 | 22.5 |
| Pulkovo_1995_3_Degree_GK_CM_24E | 2700 | Russia - 22.5°E to 25.5°E onshore | 54.34 | 22.5 | 55.07 | 22.87 |
| Pulkovo_1995_3_Degree_GK_CM_27E | 2701 | Russia - 25.5°E to 28.5°E onshore | 56.05 | 26.61 | 68.93 | 28.51 |
| Pulkovo_1995_3_Degree_GK_CM_30E | 2702 | Russia - 28.5°E to 31.5°E onshore | 52.85 | 28.5 | 69.85 | 31.5 |
| Pulkovo_1995_3_Degree_GK_CM_33E | 2703 | Russia - 31.5°E to 34.5°E onshore | 51.24 | 31.5 | 70.02 | 34.5 |
| Pulkovo_1995_3_Degree_GK_CM_36E | 2704 | Russia - 34.5°E to 37.5°E onshore | 44.61 | 34.5 | 69.39 | 37.51 |
| Pulkovo_1995_3_Degree_GK_CM_39E | 2705 | Russia - 37.5°E to 40.5°E onshore | 43.33 | 37.5 | 68.8 | 40.5 |
| Pulkovo_1995_3_Degree_GK_CM_42E | 2706 | Russia - 40.5°E to 43.5°E onshore | 42.87 | 40.5 | 68.74 | 43.5 |
| Pulkovo_1995_3_Degree_GK_CM_45E | 2707 | Russia - 43.5°E to 46.5°E onshore | 41.89 | 43.5 | 80.8 | 46.5 |
| Pulkovo_1995_3_Degree_GK_CM_48E | 2708 | Russia - 46.5°E to 49.5°E onshore | 41.19 | 46.5 | 80.91 | 49.5 |
| Pulkovo_1995_3_Degree_GK_CM_51E | 2709 | Russia - 49.5°E to 52.5°E onshore | 42.36 | 49.5 | 81.22 | 52.5 |
| Pulkovo_1995_3_Degree_GK_CM_54E | 2710 | Russia - 52.5°E to 55.5°E onshore | 50.52 | 52.5 | 81.41 | 55.5 |
| Pulkovo_1995_3_Degree_GK_CM_57E | 2711 | Russia - 55.5°E to 58.5°E onshore | 50.53 | 55.5 | 81.89 | 58.5 |
| Pulkovo_1995_3_Degree_GK_CM_60E | 2712 | Russia - 58.5°E to 61.5°E onshore | 50.47 | 58.5 | 81.91 | 61.5 |
| Pulkovo_1995_3_Degree_GK_CM_63E | 2713 | Russia - 61.5°E to 64.5°E onshore | 51.03 | 61.5 | 81.77 | 64.5 |
| Pulkovo_1995_3_Degree_GK_CM_66E | 2714 | Russia - 64.5°E to 67.5°E onshore | 54.31 | 64.5 | 81.25 | 67.5 |
| Pulkovo_1995_3_Degree_GK_CM_69E | 2715 | Russia - 67.5°E to 70.5°E onshore | 54.85 | 67.5 | 77.07 | 70.5 |
| Pulkovo_1995_3_Degree_GK_CM_72E | 2716 | Russia - 70.5°E to 73.5°E onshore | 53.43 | 70.5 | 73.57 | 73.5 |
| Pulkovo_1995_3_Degree_GK_CM_75E | 2717 | Russia - 73.5°E to 76.5°E onshore | 53.47 | 73.5 | 79.71 | 76.5 |
| Pulkovo_1995_3_Degree_GK_CM_78E | 2718 | Russia - 76.5°E to 79.5°E onshore | 51.49 | 76.5 | 81.03 | 79.5 |
| Pulkovo_1995_3_Degree_GK_CM_81E | 2719 | Russia - 79.5°E to 82.5°E onshore | 50.7 | 79.5 | 81.03 | 82.5 |
| Pulkovo_1995_3_Degree_GK_CM_84E | 2720 | Russia - 82.5°E to 85.5°E onshore | 49.58 | 82.5 | 77.56 | 85.5 |
| Pulkovo_1995_3_Degree_GK_CM_87E | 2721 | Russia - 85.5°E to 88.5°E onshore | 49.07 | 85.5 | 77.16 | 88.5 |
| Pulkovo_1995_3_Degree_GK_CM_90E | 2722 | Russia - 88.5°E to 91.5°E onshore | 49.44 | 88.5 | 81.28 | 91.5 |
| Pulkovo_1995_3_Degree_GK_CM_93E | 2723 | Russia - 91.5°E to 94.5°E onshore | 50.16 | 91.5 | 81.26 | 94.5 |
| Pulkovo_1995_3_Degree_GK_CM_96E | 2724 | Russia - 94.5°E to 97.5°E onshore | 49.73 | 94.5 | 81.35 | 97.5 |
| Pulkovo_1995_3_Degree_GK_CM_99E | 2725 | Russia - 97.5°E to 100.5°E onshore | 49.79 | 97.5 | 80.9 | 100.5 |
| Pulkovo_1995_3_Degree_GK_Zone_10 | 2644 | Russia - 28.5°E to 31.5°E onshore | 52.85 | 28.5 | 69.85 | 31.5 |
| Pulkovo_1995_3_Degree_GK_Zone_11 | 2645 | Russia - 31.5°E to 34.5°E onshore | 51.24 | 31.5 | 70.02 | 34.5 |
| Pulkovo_1995_3_Degree_GK_Zone_12 | 2646 | Russia - 34.5°E to 37.5°E onshore | 44.61 | 34.5 | 69.39 | 37.51 |
| Pulkovo_1995_3_Degree_GK_Zone_13 | 2647 | Russia - 37.5°E to 40.5°E onshore | 43.33 | 37.5 | 68.8 | 40.5 |
| Pulkovo_1995_3_Degree_GK_Zone_14 | 2648 | Russia - 40.5°E to 43.5°E onshore | 42.87 | 40.5 | 68.74 | 43.5 |
| Pulkovo_1995_3_Degree_GK_Zone_15 | 2649 | Russia - 43.5°E to 46.5°E onshore | 41.89 | 43.5 | 80.8 | 46.5 |
| Pulkovo_1995_3_Degree_GK_Zone_16 | 2650 | Russia - 46.5°E to 49.5°E onshore | 41.19 | 46.5 | 80.91 | 49.5 |
| Pulkovo_1995_3_Degree_GK_Zone_17 | 2651 | Russia - 49.5°E to 52.5°E onshore | 42.36 | 49.5 | 81.22 | 52.5 |
| Pulkovo_1995_3_Degree_GK_Zone_18 | 2652 | Russia - 52.5°E to 55.5°E onshore | 50.52 | 52.5 | 81.41 | 55.5 |
| Pulkovo_1995_3_Degree_GK_Zone_19 | 2653 | Russia - 55.5°E to 58.5°E onshore | 50.53 | 55.5 | 81.89 | 58.5 |
| Pulkovo_1995_3_Degree_GK_Zone_20 | 2654 | Russia - 58.5°E to 61.5°E onshore | 50.47 | 58.5 | 81.91 | 61.5 |
| Pulkovo_1995_3_Degree_GK_Zone_21 | 2655 | Russia - 61.5°E to 64.5°E onshore | 51.03 | 61.5 | 81.77 | 64.5 |
| Pulkovo_1995_3_Degree_GK_Zone_22 | 2656 | Russia - 64.5°E to 67.5°E onshore | 54.31 | 64.5 | 81.25 | 67.5 |
| Pulkovo_1995_3_Degree_GK_Zone_23 | 2657 | Russia - 67.5°E to 70.5°E onshore | 54.85 | 67.5 | 77.07 | 70.5 |
| Pulkovo_1995_3_Degree_GK_Zone_24 | 2658 | Russia - 70.5°E to 73.5°E onshore | 53.43 | 70.5 | 73.57 | 73.5 |
| Pulkovo_1995_3_Degree_GK_Zone_25 | 2659 | Russia - 73.5°E to 76.5°E onshore | 53.47 | 73.5 | 79.71 | 76.5 |
| Pulkovo_1995_3_Degree_GK_Zone_26 | 2660 | Russia - 76.5°E to 79.5°E onshore | 51.49 | 76.5 | 81.03 | 79.5 |
| Pulkovo_1995_3_Degree_GK_Zone_27 | 2661 | Russia - 79.5°E to 82.5°E onshore | 50.7 | 79.5 | 81.03 | 82.5 |
| Pulkovo_1995_3_Degree_GK_Zone_28 | 2662 | Russia - 82.5°E to 85.5°E onshore | 49.58 | 82.5 | 77.56 | 85.5 |
| Pulkovo_1995_3_Degree_GK_Zone_29 | 2663 | Russia - 85.5°E to 88.5°E onshore | 49.07 | 85.5 | 77.16 | 88.5 |
| Pulkovo_1995_3_Degree_GK_Zone_30 | 2664 | Russia - 88.5°E to 91.5°E onshore | 49.44 | 88.5 | 81.28 | 91.5 |
| Pulkovo_1995_3_Degree_GK_Zone_31 | 2665 | Russia - 91.5°E to 94.5°E onshore | 50.16 | 91.5 | 81.26 | 94.5 |
| Pulkovo_1995_3_Degree_GK_Zone_32 | 2666 | Russia - 94.5°E to 97.5°E onshore | 49.73 | 94.5 | 81.35 | 97.5 |
| Pulkovo_1995_3_Degree_GK_Zone_33 | 2667 | Russia - 97.5°E to 100.5°E onshore | 49.79 | 97.5 | 80.9 | 100.5 |
| Pulkovo_1995_3_Degree_GK_Zone_34 | 2668 | Russia - 100.5°E to 103.5°E onshore | 50.17 | 100.5 | 79.71 | 103.5 |
| Pulkovo_1995_3_Degree_GK_Zone_35 | 2669 | Russia - 103.5°E to 106.5°E onshore | 50.13 | 103.5 | 79.21 | 106.5 |
| Pulkovo_1995_3_Degree_GK_Zone_36 | 2670 | Russia - 106.5°E to 109.5°E onshore | 49.25 | 106.5 | 78.4 | 109.5 |
| Pulkovo_1995_3_Degree_GK_Zone_37 | 2671 | Russia - 109.5°E to 112.5°E onshore | 49.14 | 109.5 | 76.81 | 112.5 |
| Pulkovo_1995_3_Degree_GK_Zone_38 | 2672 | Russia - 112.5°E to 115.5°E onshore | 49.49 | 112.5 | 76.7 | 115.5 |
| Pulkovo_1995_3_Degree_GK_Zone_39 | 2673 | Russia - 115.5°E to 118.5°E onshore | 49.51 | 115.5 | 74.43 | 118.5 |
| Pulkovo_1995_3_Degree_GK_Zone_40 | 2674 | Russia - 118.5°E to 121.5°E onshore | 49.87 | 118.5 | 73.63 | 121.5 |
| Pulkovo_1995_3_Degree_GK_Zone_41 | 2675 | Russia - 121.5°E to 124.5°E onshore | 53.18 | 121.5 | 74 | 124.5 |
| Pulkovo_1995_3_Degree_GK_Zone_42 | 2676 | Russia - 124.5°E to 127.5°E onshore | 49.88 | 124.5 | 74 | 127.5 |
| Pulkovo_1995_3_Degree_GK_Zone_43 | 2677 | Russia - 127.5°E to 130.5°E onshore | 42.67 | 127.5 | 73.59 | 130.5 |
| Pulkovo_1995_3_Degree_GK_Zone_44 | 2678 | Russia - 130.5°E to 133.5°E onshore | 42.25 | 130.5 | 71.99 | 133.5 |
| Pulkovo_1995_3_Degree_GK_Zone_45 | 2679 | Russia - 133.5°E to 136.5°E onshore | 42.74 | 133.5 | 75.9 | 136.5 |
| Pulkovo_1995_3_Degree_GK_Zone_46 | 2680 | Russia - 136.5°E to 139.5°E onshore | 44.76 | 136.5 | 76.27 | 139.5 |
| Pulkovo_1995_3_Degree_GK_Zone_47 | 2681 | Russia - 139.5°E to 142.5°E onshore | 45.84 | 139.5 | 76.23 | 142.5 |
| Pulkovo_1995_3_Degree_GK_Zone_48 | 2682 | Russia - 142.5°E to 145.5°E onshore | 43.61 | 142.5 | 75.98 | 145.5 |
| Pulkovo_1995_3_Degree_GK_Zone_49 | 2683 | Russia - 145.5°E to 148.5°E onshore | 43.6 | 145.5 | 76.76 | 148.5 |
| Pulkovo_1995_3_Degree_GK_Zone_50 | 2684 | Russia - 148.5°E to 151.5°E onshore | 45.21 | 148.5 | 76.82 | 151.5 |
| Pulkovo_1995_3_Degree_GK_Zone_51 | 2685 | Russia - 151.5°E to 154.5°E onshore | 46.72 | 151.5 | 76.26 | 154.5 |
| Pulkovo_1995_3_Degree_GK_Zone_52 | 2686 | Russia - 154.5°E to 157.5°E onshore | 49.02 | 154.5 | 77.2 | 157.5 |
| Pulkovo_1995_3_Degree_GK_Zone_53 | 2687 | Russia - 157.5°E to 160.5°E onshore | 51.36 | 157.5 | 71.12 | 160.5 |
| Pulkovo_1995_3_Degree_GK_Zone_54 | 2688 | Russia - 160.5°E to 163.5°E onshore | 54.34 | 160.5 | 70.98 | 163.5 |
| Pulkovo_1995_3_Degree_GK_Zone_55 | 2689 | Russia - 163.5°E to 166.5°E onshore | 54.69 | 163.5 | 69.82 | 166.5 |
| Pulkovo_1995_3_Degree_GK_Zone_56 | 2690 | Russia - 166.5°E to 169.5°E onshore | 54.45 | 166.5 | 70.07 | 169.5 |
| Pulkovo_1995_3_Degree_GK_Zone_57 | 2691 | Russia - 169.5°E to 172.5°E onshore | 59.86 | 169.5 | 70.19 | 172.5 |
| Pulkovo_1995_3_Degree_GK_Zone_58 | 2692 | Russia - 172.5°E to 175.5°E onshore | 60.99 | 172.5 | 70.02 | 175.5 |
| Pulkovo_1995_3_Degree_GK_Zone_59 | 2693 | Russia - 175.5°E to 178.5°E onshore | 62.09 | 175.5 | 71.1 | 178.5 |
| Pulkovo_1995_3_Degree_GK_Zone_6 | 3150 | Russia - west of 19.5°E | 54.32 | 19.2 | 55.3 | 19.5 |
| Pulkovo_1995_3_Degree_GK_Zone_60 | 3390 | Russia - 178.5°E to 178.5°W onshore | 62.24 | 178.5 | 71.65 | -178.5 |
| Pulkovo_1995_3_Degree_GK_Zone_61 | 2695 | Russia - 178.5°W to 175.5°W onshore | 64.74 | -178.5 | 71.61 | -175.5 |
| Pulkovo_1995_3_Degree_GK_Zone_62 | 2696 | Russia - 175.5°W to 172.5°W onshore | 64.2 | -175.5 | 67.78 | -172.5 |
| Pulkovo_1995_3_Degree_GK_Zone_63 | 2697 | Russia - 172.5°W to 169.5°W onshore | 64.35 | -172.5 | 67.06 | -169.57 |
| Pulkovo_1995_3_Degree_GK_Zone_64 | 2698 | Russia - east of 169.5°W onshore | 65.7 | -169.22 | 65.86 | -168.97 |
| Pulkovo_1995_3_Degree_GK_Zone_7 | 2641 | Russia - 19.5°E to 22.5°E onshore | 54.32 | 19.57 | 55.32 | 22.5 |
| Pulkovo_1995_3_Degree_GK_Zone_8 | 2642 | Russia - 22.5°E to 25.5°E onshore | 54.34 | 22.5 | 55.07 | 22.87 |
| Pulkovo_1995_3_Degree_GK_Zone_9 | 2643 | Russia - 25.5°E to 28.5°E onshore | 56.05 | 26.61 | 68.93 | 28.51 |
| Pulkovo_1995_Gauss-Kruger_CM_105E | 2477 | Russia - 102°E to 108°E onshore | 49.64 | 102 | 79.48 | 108 |
| Pulkovo_1995_Gauss-Kruger_CM_111E | 2478 | Russia - 108°E to 114°E onshore | 49.14 | 108 | 76.81 | 114 |
| Pulkovo_1995_Gauss-Kruger_CM_117E | 2479 | Russia - 114°E to 120°E onshore | 49.51 | 114 | 75.96 | 120 |
| Pulkovo_1995_Gauss-Kruger_CM_123E | 2480 | Russia - 120°E to 126°E onshore | 51.51 | 120 | 74 | 126 |
| Pulkovo_1995_Gauss-Kruger_CM_129E | 2481 | Russia - 126°E to 132°E onshore | 42.25 | 126 | 73.61 | 132 |
| Pulkovo_1995_Gauss-Kruger_CM_135E | 2482 | Russia - 132°E to 138°E onshore | 42.63 | 132 | 76.15 | 138 |
| Pulkovo_1995_Gauss-Kruger_CM_141E | 2483 | Russia - 138°E to 144°E onshore | 45.84 | 138 | 76.27 | 144 |
| Pulkovo_1995_Gauss-Kruger_CM_147E | 2484 | Russia - 144°E to 150°E onshore | 43.6 | 144 | 76.82 | 150 |
| Pulkovo_1995_Gauss-Kruger_CM_153E | 2485 | Russia - 150°E to 156°E onshore | 45.77 | 150 | 76.26 | 156 |
| Pulkovo_1995_Gauss-Kruger_CM_159E | 2486 | Russia - 156°E to 162°E onshore | 50.27 | 156 | 77.2 | 162 |
| Pulkovo_1995_Gauss-Kruger_CM_165E | 2487 | Russia - 162°E to 168°E onshore | 54.47 | 162 | 70.03 | 168 |
| Pulkovo_1995_Gauss-Kruger_CM_171E | 2488 | Russia - 168°E to 174°E onshore | 54.45 | 168 | 70.19 | 174 |
| Pulkovo_1995_Gauss-Kruger_CM_171W | 2491 | Russia - east of 174°W onshore | 64.2 | -174 | 67.18 | -168.97 |
| Pulkovo_1995_Gauss-Kruger_CM_177E | 2489 | Russia - 174°E to 180°E onshore | 61.65 | 174 | 71.59 | 180 |
| Pulkovo_1995_Gauss-Kruger_CM_177W | 2490 | Russia - 180° to 174°W onshore | 64.35 | -180 | 71.65 | -174 |
| Pulkovo_1995_Gauss-Kruger_CM_21E | 2463 | Russia - west of 24°E onshore | 54.32 | 19.57 | 55.32 | 22.87 |
| Pulkovo_1995_Gauss-Kruger_CM_27E | 2464 | Russia - 24°E to 30°E onshore | 55.69 | 26.61 | 69.47 | 30 |
| Pulkovo_1995_Gauss-Kruger_CM_33E | 2465 | Russia - 30°E to 36°E onshore | 50.34 | 30 | 70.02 | 36 |
| Pulkovo_1995_Gauss-Kruger_CM_39E | 2466 | Russia - 36°E to 42°E onshore | 43.18 | 36 | 69.23 | 42.01 |
| Pulkovo_1995_Gauss-Kruger_CM_45E | 2467 | Russia - 42°E to 48°E onshore | 41.19 | 42 | 80.91 | 48 |
| Pulkovo_1995_Gauss-Kruger_CM_51E | 2468 | Russia - 48°E to 54°E onshore | 41.39 | 48 | 81.4 | 54 |
| Pulkovo_1995_Gauss-Kruger_CM_57E | 2469 | Russia - 54°E to 60°E onshore | 50.47 | 54 | 81.91 | 60 |
| Pulkovo_1995_Gauss-Kruger_CM_63E | 2470 | Russia - 60°E to 66°E onshore | 50.66 | 60 | 81.77 | 66 |
| Pulkovo_1995_Gauss-Kruger_CM_69E | 2471 | Russia - 66°E to 72°E onshore | 54.1 | 66 | 77.07 | 72 |
| Pulkovo_1995_Gauss-Kruger_CM_75E | 2472 | Russia - 72°E to 78°E onshore | 53.17 | 72 | 79.71 | 78 |
| Pulkovo_1995_Gauss-Kruger_CM_81E | 2473 | Russia - 78°E to 84°E onshore | 50.69 | 78 | 81.03 | 84 |
| Pulkovo_1995_Gauss-Kruger_CM_87E | 2474 | Russia - 84°E to 90°E onshore | 49.07 | 84 | 81.27 | 90 |
| Pulkovo_1995_Gauss-Kruger_CM_93E | 2475 | Russia - 90°E to 96°E onshore | 49.89 | 90 | 81.35 | 96 |
| Pulkovo_1995_Gauss-Kruger_CM_99E | 2476 | Russia - 96°E to 102°E onshore | 49.73 | 96 | 81.32 | 102 |
| Pulkovo_1995_GK_Zone_10 | 20010 | Russia - 54°E to 60°E onshore | 50.47 | 54 | 81.91 | 60 |
| Pulkovo_1995_GK_Zone_10N | 20070 | Russia - 54°E to 60°E onshore | 50.47 | 54 | 81.91 | 60 |
| Pulkovo_1995_GK_Zone_11 | 20011 | Russia - 60°E to 66°E onshore | 50.66 | 60 | 81.77 | 66 |
| Pulkovo_1995_GK_Zone_11N | 20071 | Russia - 60°E to 66°E onshore | 50.66 | 60 | 81.77 | 66 |
| Pulkovo_1995_GK_Zone_12 | 20012 | Russia - 66°E to 72°E onshore | 54.1 | 66 | 77.07 | 72 |
| Pulkovo_1995_GK_Zone_12N | 20072 | Russia - 66°E to 72°E onshore | 54.1 | 66 | 77.07 | 72 |
| Pulkovo_1995_GK_Zone_13 | 20013 | Russia - 72°E to 78°E onshore | 53.17 | 72 | 79.71 | 78 |
| Pulkovo_1995_GK_Zone_13N | 20073 | Russia - 72°E to 78°E onshore | 53.17 | 72 | 79.71 | 78 |
| Pulkovo_1995_GK_Zone_14 | 20014 | Russia - 78°E to 84°E onshore | 50.69 | 78 | 81.03 | 84 |
| Pulkovo_1995_GK_Zone_14N | 20074 | Russia - 78°E to 84°E onshore | 50.69 | 78 | 81.03 | 84 |
| Pulkovo_1995_GK_Zone_15 | 20015 | Russia - 84°E to 90°E onshore | 49.07 | 84 | 81.27 | 90 |
| Pulkovo_1995_GK_Zone_15N | 20075 | Russia - 84°E to 90°E onshore | 49.07 | 84 | 81.27 | 90 |
| Pulkovo_1995_GK_Zone_16 | 20016 | Russia - 90°E to 96°E onshore | 49.89 | 90 | 81.35 | 96 |
| Pulkovo_1995_GK_Zone_16N | 20076 | Russia - 90°E to 96°E onshore | 49.89 | 90 | 81.35 | 96 |
| Pulkovo_1995_GK_Zone_17 | 20017 | Russia - 96°E to 102°E onshore | 49.73 | 96 | 81.32 | 102 |
| Pulkovo_1995_GK_Zone_17N | 20077 | Russia - 96°E to 102°E onshore | 49.73 | 96 | 81.32 | 102 |
| Pulkovo_1995_GK_Zone_18 | 20018 | Russia - 102°E to 108°E onshore | 49.64 | 102 | 79.48 | 108 |
| Pulkovo_1995_GK_Zone_18N | 20078 | Russia - 102°E to 108°E onshore | 49.64 | 102 | 79.48 | 108 |
| Pulkovo_1995_GK_Zone_19 | 20019 | Russia - 108°E to 114°E onshore | 49.14 | 108 | 76.81 | 114 |
| Pulkovo_1995_GK_Zone_19N | 20079 | Russia - 108°E to 114°E onshore | 49.14 | 108 | 76.81 | 114 |
| Pulkovo_1995_GK_Zone_2 | 20002 | Europe - 6°E to 12°E and Pulkovo by country | 50.21 | 9.93 | 54.18 | 12 |
| Pulkovo_1995_GK_Zone_20 | 20020 | Russia - 114°E to 120°E onshore | 49.51 | 114 | 75.96 | 120 |
| Pulkovo_1995_GK_Zone_20N | 20080 | Russia - 114°E to 120°E onshore | 49.51 | 114 | 75.96 | 120 |
| Pulkovo_1995_GK_Zone_21 | 20021 | Russia - 120°E to 126°E onshore | 51.51 | 120 | 74 | 126 |
| Pulkovo_1995_GK_Zone_21N | 20081 | Russia - 120°E to 126°E onshore | 51.51 | 120 | 74 | 126 |
| Pulkovo_1995_GK_Zone_22 | 20022 | Russia - 126°E to 132°E onshore | 42.25 | 126 | 73.61 | 132 |
| Pulkovo_1995_GK_Zone_22N | 20082 | Russia - 126°E to 132°E onshore | 42.25 | 126 | 73.61 | 132 |
| Pulkovo_1995_GK_Zone_23 | 20023 | Russia - 132°E to 138°E onshore | 42.63 | 132 | 76.15 | 138 |
| Pulkovo_1995_GK_Zone_23N | 20083 | Russia - 132°E to 138°E onshore | 42.63 | 132 | 76.15 | 138 |
| Pulkovo_1995_GK_Zone_24 | 20024 | Russia - 138°E to 144°E onshore | 45.84 | 138 | 76.27 | 144 |
| Pulkovo_1995_GK_Zone_24N | 20084 | Russia - 138°E to 144°E onshore | 45.84 | 138 | 76.27 | 144 |
| Pulkovo_1995_GK_Zone_25 | 20025 | Russia - 144°E to 150°E onshore | 43.6 | 144 | 76.82 | 150 |
| Pulkovo_1995_GK_Zone_25N | 20085 | Russia - 144°E to 150°E onshore | 43.6 | 144 | 76.82 | 150 |
| Pulkovo_1995_GK_Zone_26 | 20026 | Russia - 150°E to 156°E onshore | 45.77 | 150 | 76.26 | 156 |
| Pulkovo_1995_GK_Zone_26N | 20086 | Russia - 150°E to 156°E onshore | 45.77 | 150 | 76.26 | 156 |
| Pulkovo_1995_GK_Zone_27 | 20027 | Russia - 156°E to 162°E onshore | 50.27 | 156 | 77.2 | 162 |
| Pulkovo_1995_GK_Zone_27N | 20087 | Russia - 156°E to 162°E onshore | 50.27 | 156 | 77.2 | 162 |
| Pulkovo_1995_GK_Zone_28 | 20028 | Russia - 162°E to 168°E onshore | 54.47 | 162 | 70.03 | 168 |
| Pulkovo_1995_GK_Zone_28N | 20088 | Russia - 162°E to 168°E onshore | 54.47 | 162 | 70.03 | 168 |
| Pulkovo_1995_GK_Zone_29 | 20029 | Russia - 168°E to 174°E onshore | 54.45 | 168 | 70.19 | 174 |
| Pulkovo_1995_GK_Zone_29N | 20089 | Russia - 168°E to 174°E onshore | 54.45 | 168 | 70.19 | 174 |
| Pulkovo_1995_GK_Zone_2N | 20062 | Europe - 6°E to 12°E and Pulkovo by country | 50.21 | 9.93 | 54.18 | 12 |
| Pulkovo_1995_GK_Zone_3 | 20003 | Europe - 12°E to 18°E onshore and S-42(58) by country | 45.78 | 12 | 54.89 | 18 |
| Pulkovo_1995_GK_Zone_30 | 20030 | Russia - 174°E to 180°E onshore | 61.65 | 174 | 71.59 | 180 |
| Pulkovo_1995_GK_Zone_30N | 20090 | Russia - 174°E to 180°E onshore | 61.65 | 174 | 71.59 | 180 |
| Pulkovo_1995_GK_Zone_31 | 20031 | Russia - 180° to 174°W onshore | 64.35 | -180 | 71.65 | -174 |
| Pulkovo_1995_GK_Zone_31N | 20091 | Russia - 180° to 174°W onshore | 64.35 | -180 | 71.65 | -174 |
| Pulkovo_1995_GK_Zone_32 | 20032 | Russia - east of 174°W onshore | 64.2 | -174 | 67.18 | -168.97 |
| Pulkovo_1995_GK_Zone_32N | 20092 | Russia - east of 174°W onshore | 64.2 | -174 | 67.18 | -168.97 |
| Pulkovo_1995_GK_Zone_3N | 20063 | Europe - 12°E to 18°E onshore and S-42(58) by country | 45.78 | 12 | 54.89 | 18 |
| Pulkovo_1995_GK_Zone_4 | 20004 | Russia - west of 24°E onshore | 54.32 | 19.57 | 55.32 | 22.87 |
| Pulkovo_1995_GK_Zone_4N | 20064 | Russia - west of 24°E onshore | 54.32 | 19.57 | 55.32 | 22.87 |
| Pulkovo_1995_GK_Zone_5 | 20005 | Russia - 24°E to 30°E onshore | 55.69 | 26.61 | 69.47 | 30 |
| Pulkovo_1995_GK_Zone_5N | 20065 | Russia - 24°E to 30°E onshore | 55.69 | 26.61 | 69.47 | 30 |
| Pulkovo_1995_GK_Zone_6 | 20006 | Russia - 30°E to 36°E onshore | 50.34 | 30 | 70.02 | 36 |
| Pulkovo_1995_GK_Zone_6N | 20066 | Russia - 30°E to 36°E onshore | 50.34 | 30 | 70.02 | 36 |
| Pulkovo_1995_GK_Zone_7 | 20007 | Russia - 36°E to 42°E onshore | 43.18 | 36 | 69.23 | 42.01 |
| Pulkovo_1995_GK_Zone_7N | 20067 | Russia - 36°E to 42°E onshore | 43.18 | 36 | 69.23 | 42.01 |
| Pulkovo_1995_GK_Zone_8 | 20008 | Russia - 42°E to 48°E onshore | 41.19 | 42 | 80.91 | 48 |
| Pulkovo_1995_GK_Zone_8N | 20068 | Russia - 42°E to 48°E onshore | 41.19 | 42 | 80.91 | 48 |
| Pulkovo_1995_GK_Zone_9 | 20009 | Russia - 48°E to 54°E onshore | 41.39 | 48 | 81.4 | 54 |
| Pulkovo_1995_GK_Zone_9N | 20069 | Russia - 48°E to 54°E onshore | 41.39 | 48 | 81.4 | 54 |
| Qatar_1948_Qatar_Grid | 2099 | Qatar - onshore | 24.55 | 50.69 | 26.2 | 51.68 |
| Qatar_National_Grid | 28600 | Qatar - onshore | 24.55 | 50.69 | 26.2 | 51.68 |
| QND_1995_Qatar_National_Grid | 2932 | Qatar - onshore | 24.55 | 50.69 | 26.2 | 51.68 |
| QND_1995_UTM_39N | 102143 | Qatar | 24.55 | 50.55 | 27.05 | 53.04 |
| Qornoq_1927_UTM_Zone_22N | 2216 | Greenland - southwest coast 54°W to 48°W | 60.63 | -54 | 73.05 | -48 |
| Qornoq_1927_UTM_Zone_23N | 2217 | Greenland - southwest coast east of 48°W | 59.74 | -48 | 62.05 | -42.52 |
| Rassadiran_Nakhl_e_Taqi | 2057 | Iran - Taheri refinery | 27.39 | 52.5 | 27.61 | 52.71 |
| RD/83_3_Degree_GK_Zone_4_E-N | 5668 | Germany - Saxony - west of 13.5°E | 50.2 | 11.89 | 51.66 | 13.51 |
| RD/83_3_Degree_GK_Zone_5_E-N | 5669 | Germany - Saxony - east of 13.5°E | 50.62 | 13.5 | 51.58 | 15.04 |
| RD/83_GK_Zone_4 | 3398 | Germany - Saxony - west of 13.5°E | 50.2 | 11.89 | 51.66 | 13.51 |
| RD/83_GK_Zone_5 | 3399 | Germany - Saxony - east of 13.5°E | 50.62 | 13.5 | 51.58 | 15.04 |
| RDN2008_Italy_zone | 6875 | Italy | 34.76 | 5.93 | 47.1 | 18.99 |
| RDN2008_Italy_zone_(E-N) | 7794 | Italy | 34.76 | 5.93 | 47.1 | 18.99 |
| RDN2008_TM32 | 6707 | Italy - west of 12°E | 36.53 | 5.94 | 47.04 | 12 |
| RDN2008_TM33 | 6708 | Italy - 12°E to 18°E | 34.79 | 12 | 47.1 | 18 |
| RDN2008_TM34 | 6709 | Italy - east of 18°E | 34.76 | 17.99 | 41.64 | 18.99 |
| RDN2008_UTM_zone_32N | 7791 | Italy - west of 12°E | 36.53 | 5.94 | 47.04 | 12 |
| RDN2008_UTM_zone_33N | 7792 | Italy - 12°E to 18°E | 34.79 | 12 | 47.1 | 18 |
| RDN2008_UTM_zone_34N | 7793 | Italy - east of 18°E | 34.76 | 17.99 | 41.64 | 18.99 |
| RDN2008_Zone_12 | 6876 | Italy | 34.76 | 5.93 | 47.1 | 18.99 |
| RDN2008_Zone_12_(E-N) | 7795 | Italy | 34.76 | 5.93 | 47.1 | 18.99 |
| RD_New | 28992 | Netherlands - onshore | 50.75 | 3.2 | 53.7 | 7.22 |
| RD_Old | 28991 | Netherlands - onshore | 50.75 | 3.2 | 53.7 | 7.22 |
| REGCAN95_LAEA_Europe | 5635 | Spain - Canary Islands | 24.6 | -21.93 | 32.76 | -11.75 |
| REGCAN95_LCC_Europe | 5634 | Spain - Canary Islands | 24.6 | -21.93 | 32.76 | -11.75 |
| REGCAN95_UTM_Zone_27N | 4082 | Spain - Canary Islands - west of 18°W | 24.6 | -21.93 | 31.19 | -18 |
| REGCAN95_UTM_Zone_28N | 4083 | Spain - Canary Islands - east of 18°W | 25.25 | -18 | 32.76 | -11.75 |
| REGVEN_UTM_Zone_18N | 2201 | Venezuela - west of 72°W | 7.02 | -73.38 | 11.62 | -71.99 |
| REGVEN_UTM_Zone_19N | 2202 | Venezuela - 72°W and 66°W | 0.73 | -72 | 15.64 | -66 |
| REGVEN_UTM_Zone_20N | 2203 | Venezuela - east of 66°W | 0.64 | -66 | 16.75 | -58.95 |
| Reunion_1947_TM_Reunion | 3727 | Reunion - onshore | -21.42 | 55.16 | -20.81 | 55.91 |
| RGAF09_UTM_Zone_20N | 5490 | Caribbean - French Antilles west of 60°W | 14.08 | -63.66 | 18.31 | -60 |
| RGF_1993_CC42 | 3942 | France - mainland south of 43°N and Corsica | 41.31 | -1.06 | 43.07 | 9.63 |
| RGF_1993_CC43 | 3943 | France - mainland south of 44°N | 42.33 | -1.79 | 44.01 | 7.65 |
| RGF_1993_CC44 | 3944 | France - mainland - 43°N to 45°N | 42.92 | -1.79 | 45 | 7.71 |
| RGF_1993_CC45 | 3945 | France - mainland - 44°N to 46°N | 44 | -1.46 | 46 | 7.71 |
| RGF_1993_CC46 | 3946 | France - mainland - 45°N to 47°N | 45 | -2.21 | 47 | 7.16 |
| RGF_1993_CC47 | 3947 | France - mainland - 46°N to 48°N | 46 | -4.77 | 48 | 7.63 |
| RGF_1993_CC48 | 3948 | France - mainland - 47°N to 49°N | 47 | -4.87 | 49 | 8.23 |
| RGF_1993_CC49 | 3949 | France - mainland - 48°N to 50°N | 48 | -4.87 | 50 | 8.23 |
| RGF_1993_CC50 | 3950 | France - mainland north of 49°N | 49 | -2.03 | 51.14 | 8.08 |
| RGF_1993_Lambert_93 | 2154 | France | 41.15 | -9.86 | 51.56 | 10.38 |
| RGFG_1995_UTM_22N | 2972 | French Guiana - east of 54°W | 2.17 | -54 | 8.88 | -49.45 |
| RGFG_1995_UTM_Zone_21N | 3313 | French Guiana - west of 54°W | 2.11 | -54.61 | 5.69 | -54 |
| RGM_2004_UTM_Zone_38S | 4471 | Mayotte | -14.49 | 43.68 | -11.33 | 46.7 |
| RGNC_1991_93_Lambert_New_ Caledonia | 3163 | New Caledonia - Belep, Grande Terre, Ile des Pins, Loyalty Islands | -22.73 | 163.54 | -19.5 | 168.19 |
| RGNC_1991-93_UTM_Zone_57S | 3169 | New Caledonia - west of 162°E | -26.03 | 156.25 | -15.34 | 162.01 |
| RGNC_1991-93_UTM_Zone_58S | 3170 | New Caledonia - 162°E to 168°E | -26.45 | 162 | -14.83 | 168 |
| RGNC_1991-93_UTM_Zone_59S | 3171 | New Caledonia - east of 168°E | -25.95 | 168 | -19.75 | 174.28 |
| RGNC_1991_Lambert_New_Caledonia | 2984 | New Caledonia | -26.45 | 156.25 | -14.83 | 174.28 |
| RGPF_UTM_Zone_5S | 3296 | French Polynesia - west of 150°W | -26.7 | -158.13 | -12.5 | -150 |
| RGPF_UTM_Zone_6S | 3297 | French Polynesia - 150°W to 144°W | -31.2 | -150 | -7.29 | -144 |
| RGPF_UTM_Zone_7S | 3298 | French Polynesia - 144°W to 138°W | -31.24 | -144 | -4.52 | -138 |
| RGPF_UTM_Zone_8S | 3299 | French Polynesia - east of 138°W | -26.58 | -138 | -5.52 | -131.97 |
| RGR_1992_UTM_39S | 5644 | Reunion - west of 54°E | -24.37 | 51.83 | -18.52 | 54 |
| RGR_1992_UTM_40S | 2975 | Reunion - east of 54°E | -24.72 | 54 | -18.28 | 58.24 |
| RGRDC_2005_Congo_TM_Zone_12 | 4048 | Congo DR (Zaire) - 11°E to 13°E | -6.04 | 11.79 | -4.67 | 13 |
| RGRDC_2005_Congo_TM_Zone_14 | 4049 | Congo DR (Zaire) - 13°E to 15°E | -5.91 | 13 | -4.28 | 15.01 |
| RGRDC_2005_Congo_TM_Zone_16 | 4050 | Congo DR (Zaire) - south and 15°E to 17°E | -7.31 | 15 | -3.41 | 17 |
| RGRDC_2005_Congo_TM_Zone_18 | 4051 | Congo DR (Zaire) - south and 17°E and 19°E | -8.11 | 17 | -3.43 | 19 |
| RGRDC_2005_Congo_TM_Zone_20 | 4056 | Congo DR (Zaire) - south and 19°E to 21°E | -8 | 19 | -3.77 | 21 |
| RGRDC_2005_Congo_TM_Zone_22 | 4057 | Congo DR (Zaire) - south and 21°E to 23°E | -11.24 | 21 | -4.18 | 23.01 |
| RGRDC_2005_Congo_TM_Zone_24 | 4058 | Congo DR (Zaire) - south and 23°E to 25°E | -11.47 | 23 | -4.58 | 25 |
| RGRDC_2005_Congo_TM_Zone_26 | 4059 | Congo DR (Zaire) - south and 25°E to 27°E | -11.99 | 25 | -4.99 | 27 |
| RGRDC_2005_Congo_TM_Zone_28 | 4060 | Congo DR (Zaire) - south and 27°E to 29°E | -13.39 | 27 | -6.43 | 29 |
| RGRDC_2005_Congo_TM_Zone_30 | 5844 | Congo DR (Zaire) - south and 29°E to 31°E | -13.46 | 29 | -12.15 | 29.81 |
| RGRDC_2005_UTM_Zone_33S | 4061 | Congo DR (Zaire) - south and 12°E to 18°E | -8.11 | 12 | -3.41 | 18.01 |
| RGRDC_2005_UTM_Zone_34S | 4062 | Congo DR (Zaire) - south and 18°E to 24°E | -11.24 | 18 | -3.57 | 24 |
| RGRDC_2005_UTM_Zone_35S | 4063 | Congo DR (Zaire) - south and 24°E to 30°E | -13.46 | 24 | -4.79 | 29.81 |
| RGSPM_2006_UTM_Zone_21N | 4467 | St Pierre and Miquelon | 43.41 | -57.1 | 47.37 | -55.9 |
| RGTAAF07_Terre_Adelie_Polar_ Stereographic | 7082 | Antarctica - Adelie Land coastal area | -67.13 | 136 | -65.61 | 142 |
| RGTAAF07_UTM_zone_37S | 7074 | French Southern Territories - Europa | -25.7 | 37.98 | -20.91 | 41.82 |
| RGTAAF07_UTM_zone_38S | 7075 | French Southern Territories - Crozet west of 48°E | -49.38 | 45.37 | -43.12 | 48.01 |
| RGTAAF07_UTM_zone_39S | 7076 | French Southern Territories - Crozet 48°E to 54°E | -49.82 | 48 | -42.61 | 54.01 |
| RGTAAF07_UTM_zone_40S | 7077 | French Southern Territories - Crozet east of 54°E | -49.61 | 54 | -43.3 | 57.16 |
| RGTAAF07_UTM_zone_41S | 7078 | French Southern Territories - 60°E to 66°E | -53.03 | 62.96 | -45.73 | 66 |
| RGTAAF07_UTM_zone_42S | 7079 | French Southern Territories - 66°E to 72°E | -53.24 | 66 | -45.11 | 72.01 |
| RGTAAF07_UTM_zone_43S | 7080 | French Southern Territories - 72°E to 78°E | -51.19 | 72 | -34.47 | 78.01 |
| RGTAAF07_UTM_zone_44S | 7081 | French Southern Territories - east of 78°E | -42.04 | 78 | -34.5 | 81.83 |
| RGTAAF07_UTM_Zone_53S | 8455 | Antarctica - Adelie Land coastal area west of 138°E | -66.73 | 136 | -65.61 | 138.01 |
| RGTAAF07_UTM_Zone_54S | 8456 | Antarctica - Adelie Land coastal area east of 138°E | -67.13 | 138 | -66.1 | 142 |
| RGWF96_UTM_Zone_1S | 8903 | Wallis and Futuna | -15.94 | 179.49 | -9.84 | -174.27 |
| Roma_1940_Gauss_Boaga_Est | 102093 | Italy - east of 12°E | 34.76 | 12 | 47.1 | 18.99 |
| Roma_1940_Gauss_Boaga_Ovest | 102094 | Italy - west of 12°E | 36.53 | 5.94 | 47.04 | 12 |
| RRAF_1991_UTM_20N | 4559 | Caribbean - French Antilles west of 60°W | 14.08 | -63.66 | 18.31 | -60 |
| RSAO13_TM_12_SE | 9159 | Angola - Angola proper - offshore | -17.26 | 8.2 | -6.01 | 13.86 |
| RSAO13_UTM_Zone_32S | 9156 | Angola - west of 12°E | -17.28 | 8.2 | -5.03 | 12.01 |
| RSAO13_UTM_Zone_33S | 9157 | Angola - 12°E to 18°E | -17.44 | 12 | -4.38 | 18 |
| RSAO13_UTM_Zone_34S | 9158 | Angola - east of 18°E | -18.02 | 17.99 | -6.91 | 24.09 |
| RSRGD2000_BCLC2000 | 5480 | Antarctica - Borchgrevink Coast region | -76 | 157 | -73 | 173 |
| RSRGD2000_DGLC2000 | 3852 | Antarctica - Darwin Glacier region | -81 | 145 | -76 | 169 |
| RSRGD2000_MSLC2000 | 5479 | Antarctica - McMurdo Sound region | -81 | 153 | -76 | 173 |
| RSRGD2000_PCLC2000 | 5481 | Antarctica - Pennell Coast region | -73 | 160 | -69.5 | 172 |
| RSRGD2000_RSPS2000 | 5482 | Antarctica - Ross Ice Shelf Region | -90 | 150 | -76 | -150 |
| RT38_0_gon | 3028 | Sweden - 0 gon | 56.86 | 16.08 | 68.54 | 20.22 |
| RT38_25_gon_O | 3029 | Sweden - 2.5 gon E | 63.37 | 18.4 | 69.07 | 22.2 |
| RT38_25_gon_V | 3027 | Sweden - 2.5 gon W | 55.95 | 13.66 | 67.18 | 17.73 |
| RT38_5_gon_O | 3030 | Sweden - 5 gon E | 65.24 | 21.34 | 68.58 | 24.17 |
| RT38_5_gon_V | 3026 | Sweden - 5 gon W | 55.28 | 11.81 | 64.39 | 15.44 |
| RT38_75_gon_V | 3025 | Sweden - 7.5 gon W | 57.29 | 10.93 | 59.73 | 12.91 |
| RT90_0_gon | 3022 | Sweden - 0 gon | 56.86 | 16.08 | 68.54 | 20.22 |
| RT90_25_gon_O | 3023 | Sweden - 2.5 gon E | 63.37 | 18.4 | 69.07 | 22.2 |
| RT90_25_gon_V | 3021 | Sweden - 2.5 gon W | 55.95 | 13.66 | 67.18 | 17.73 |
| RT90_25_gon_W | 2400 | Sweden | 54.96 | 10.03 | 69.07 | 24.17 |
| RT90_5_gon_O | 3024 | Sweden - 5 gon E | 65.24 | 21.34 | 68.58 | 24.17 |
| RT90_5_gon_V | 3020 | Sweden - 5 gon W | 55.28 | 11.81 | 64.39 | 15.44 |
| RT90_75_gon_V | 3019 | Sweden - 7.5 gon W | 57.29 | 10.93 | 59.73 | 12.91 |
| SAD_1969_96_Brazil_Polyconic | 5530 | Brazil - SAD69 | -35.71 | -60.57 | 7.04 | -29.03 |
| SAD_1969_96_UTM_Zone_18S | 5875 | Brazil - west of 72°W | -10.01 | -74.01 | -4.59 | -71.99 |
| SAD_1969_96_UTM_Zone_19S | 5876 | Brazil - 72°W to 66°W | -11.14 | -72 | 2.15 | -65.99 |
| SAD_1969_96_UTM_Zone_20S | 5877 | Brazil - 66°W to 60°W | -16.28 | -66 | 5.28 | -59.99 |
| SAD_1969_96_UTM_Zone_21S | 5531 | Brazil - 60°W to 54°W | -31.91 | -60 | 4.51 | -53.99 |
| SAD_1969_96_UTM_Zone_22S | 5858 | Brazil - 54°W to 48°W and SAD69 | -35.71 | -54.01 | 7.04 | -47.99 |
| SAD_1969_96_UTM_Zone_23S | 5533 | Brazil - 48°W to 42°W | -33.5 | -48 | 5.13 | -42 |
| SAD_1969_96_UTM_Zone_24S | 5534 | Brazil - 42°W to 36°W | -26.35 | -42 | 0.74 | -36 |
| SAD_1969_96_UTM_Zone_25S | 5535 | Brazil - 36°W to 30°W | -23.8 | -36 | 4.19 | -29.99 |
| SAD_1969_Brazil_Polyconic | 29101 | Brazil | -35.71 | -74.01 | 7.04 | -25.28 |
| SAD_1969_UTM_Zone_17N | 5463 | South America - 84°W to 78°W, N hemisphere and SAD69 by country | 0 | -80.18 | 2.7 | -78 |
| SAD_1969_UTM_Zone_17S | 29187 | South America - 84°W to 78°W, S hemisphere and SAD69 by country | -10.53 | -81.41 | 0 | -78 |
| SAD_1969_UTM_Zone_18N | 29168 | South America - 78°W to 72°W, N hemisphere and SAD69 by country | 0 | -78 | 12.31 | -72 |
| SAD_1969_UTM_Zone_18S | 29188 | South America - 78°W to 72°W, S hemisphere and SAD69 by country | -45 | -78 | 0 | -71.99 |
| SAD_1969_UTM_Zone_19N | 29169 | South America - 72°W to 66°W, N hemisphere onshore | 0 | -72 | 12.52 | -66 |
| SAD_1969_UTM_Zone_19S | 29189 | South America - 72°W to 66°W, S hemisphere onshore | -45 | -72 | 2.15 | -65.99 |
| SAD_1969_UTM_Zone_20N | 29170 | South America - 66°W to 60°W, N hemisphere and SAD69 by country | 0.64 | -66 | 11.23 | -59.99 |
| SAD_1969_UTM_Zone_20S | 29190 | South America - 66°W to 60°W, S hemisphere and SAD69 by country | -45 | -66 | 5.28 | -59.99 |
| SAD_1969_UTM_Zone_21N | 29171 | South America - 60°W to 54°W, N hemisphere and SAD69 by country | 1.18 | -60 | 8.6 | -54 |
| SAD_1969_UTM_Zone_21S | 29191 | South America - 60°W to 54°W, S hemisphere and SAD69 by country | -38.91 | -60 | 4.51 | -53.99 |
| SAD_1969_UTM_Zone_22N | 29172 | South America - 54°W to 48°W, N hemisphere and SAD69 by country | 1.68 | -54 | 5.81 | -46.65 |
| SAD_1969_UTM_Zone_22S | 29192 | South America - 54°W to 48°W, S hemisphere and SAD69 by country | -35.71 | -54 | 7.04 | -47.99 |
| SAD_1969_UTM_Zone_23S | 29193 | Brazil - 48°W to 42°W | -33.5 | -48 | 5.13 | -42 |
| SAD_1969_UTM_Zone_24S | 29194 | Brazil - 42°W to 36°W | -26.35 | -42 | 0.74 | -36 |
| SAD_1969_UTM_Zone_25S | 29195 | Brazil - 36°W to 30°W | -23.8 | -36 | 4.19 | -29.99 |
| Sahara | 26193 | Morocco - south of 27.9°N | 21.06 | -17 | 27.9 | -8.67 |
| Sahara_Degree | 102193 | Morocco - south of 27.9°N | 21.06 | -17 | 27.9 | -8.67 |
| Sainte_Anne_UTM_20N | 2970 | Guadeloupe - Grande- Terre and surrounding islands - onshore | 15.8 | -61.85 | 16.55 | -60.97 |
| Saint_Pierre_et_Miquelon_1950_UTM_ 21N | 2987 | St Pierre and Miquelon - onshore | 46.69 | -56.48 | 47.19 | -56.07 |
| Saipan_Az_Eq_1969 | 102238 | Northern Mariana Islands | 12.38 | 141.33 | 23.9 | 149.55 |
| Samboja_UTM_Zone_50S | 2550 | Indonesia - Kalimantan - Mahakam delta | -1.24 | 116.72 | 0 | 117.99 |
| Samoa_1962_Samoa_Lambert | 3102 | American Samoa - 2 main island groups | -14.43 | -170.88 | -14.11 | -169.38 |
| Sao_Braz_UTM_Zone_26N | 102168 | Portugal - Azores E - onshore | 36.87 | -25.92 | 37.96 | -24.62 |
| Sapper_Hill_1943_UTM_Zone_20S | 29220 | Falkland Islands - onshore west of 60°W | -52.33 | -61.55 | -50.96 | -59.99 |
| Sapper_Hill_1943_UTM_Zone_21S | 29221 | Falkland Islands - onshore east of 60°W | -52.51 | -60 | -51.13 | -57.6 |
| Schwarzeck_UTM_Zone_33S | 29333 | Namibia - offshore | -30.64 | 8.24 | -17.24 | 16.46 |
| Selvagem_Grande_1938_UTM_Zone_28N | 2943 | Portugal - Selvagens onshore | 29.98 | -16.11 | 30.21 | -15.79 |
| SHMG2015 | 7887 | St Helena - St Helena Island | -16.08 | -5.85 | -15.85 | -5.58 |
| Sibun_Gorge_1922_Colony_Grid | 5589 | Belize - onshore | 15.88 | -89.22 | 18.49 | -87.72 |
| Sierra_Leone_1924_New_Colony_Grid | 2159 | Sierra Leone - Freetown Peninsula | 8.32 | -13.34 | 8.55 | -13.13 |
| Sierra_Leone_1924_New_War_Office_ Grid | 2160 | Sierra Leone - Freetown Peninsula | 8.32 | -13.34 | 8.55 | -13.13 |
| Sierra_Leone_1968_UTM_Zone_28N | 2161 | Sierra Leone - west of 12°W | 7.15 | -13.35 | 9.94 | -12 |
| Sierra_Leone_1968_UTM_Zone_29N | 2162 | Sierra Leone - east of 12°W | 6.88 | -12 | 10 | -10.26 |
| SIRGAS_2000_Brazil_Mercator | 5641 | Brazil - equatorial margin | -5.74 | -51.64 | 7.04 | -32.43 |
| SIRGAS_2000_Brazil_Polyconic | 5880 | Brazil | -35.71 | -74.01 | 7.04 | -25.28 |
| SIRGAS_2000_UTM_Zone_11N | 31965 | Latin America - 120°W to 114°W | 15.01 | -120 | 32.72 | -114 |
| SIRGAS_2000_UTM_Zone_12N | 31966 | Latin America - 114°W to 108°W | 15.09 | -114 | 32.27 | -108 |
| SIRGAS_2000_UTM_Zone_13N | 31967 | Latin America - 108°W to 102°W | 14.05 | -108 | 31.79 | -102 |
| SIRGAS_2000_UTM_Zone_14N | 31968 | Latin America - 102°W to 96°W | 12.3 | -102.01 | 29.81 | -96 |
| SIRGAS_2000_UTM_Zone_15N | 31969 | Latin America - 96°W to 90°W; N hemisphere and SIRGAS 2000 by country | 0 | -96 | 26 | -90 |
| SIRGAS_2000_UTM_Zone_16N | 31970 | Latin America - 90°W to 84°W; N hemisphere and SIRGAS 2000 by country | 0 | -90 | 25.77 | -83.99 |
| SIRGAS_2000_UTM_Zone_17N | 31971 | Latin America - 84°W to 78°West; N hemisphere and SIRGAS by country | 0 | -84 | 19.54 | -78 |
| SIRGAS_2000_UTM_Zone_17S | 31977 | South America - 84°W to 78°W, S hemisphere | -56.45 | -84 | 0 | -78 |
| SIRGAS_2000_UTM_Zone_18N | 31972 | Latin America - 78°W to 72°West; N hemisphere and SIRGAS by country | 0 | -78 | 15.04 | -72 |
| SIRGAS_2000_UTM_Zone_18S | 31978 | South America - 78°W to 72°W, S hemisphere and SIRGAS 2000 by country | -59.36 | -78 | 0 | -71.99 |
| SIRGAS_2000_UTM_Zone_19N | 31973 | South America - 72°W to 66°W, N hemisphere and SIRGAS 2000 by country | 0 | -72 | 15.64 | -66 |
| SIRGAS_2000_UTM_Zone_19S | 31979 | South America - 72°W to 66°W, S hemisphere and SIRGAS 2000 by country | -59.87 | -72 | 2.15 | -66 |
| SIRGAS_2000_UTM_Zone_20N | 31974 | South America - 66°W to 60°W, N hemisphere and SIRGAS 2000 by country | 0.64 | -66 | 16.75 | -59.99 |
| SIRGAS_2000_UTM_Zone_20S | 31980 | South America - 66°W to 60°W, S hemisphere and SIRGAS 2000 by country | -58.39 | -66 | 5.28 | -60 |
| SIRGAS_2000_UTM_Zone_21N | 31975 | South America - 60°W to 54°W, N hemisphere and SIRGAS 2000 by country | 1.18 | -60 | 12.19 | -54 |
| SIRGAS_2000_UTM_Zone_21S | 31981 | South America - 60°W to 54°W, S hemisphere and SIRGAS 2000 by country | -44.82 | -60 | 4.51 | -54 |
| SIRGAS_2000_UTM_Zone_22N | 31976 | South America - 54°W to 48°W, N hemisphere and SIRGAS 2000 by country | 0 | -54 | 9.24 | -47.99 |
| SIRGAS_2000_UTM_Zone_22S | 31982 | South America - 54°W to 48°W, S hemisphere and SIRGAS 2000 by country | -54.18 | -54 | 7.04 | -47.99 |
| SIRGAS_2000_UTM_Zone_23N | 6210 | Brazil - 48°W to 42°W and north of 0°N | 0 | -48 | 5.13 | -41.99 |
| SIRGAS_2000_UTM_Zone_23S | 31983 | Brazil - 48°W to 42°W | -33.5 | -48 | 5.13 | -42 |
| SIRGAS_2000_UTM_Zone_24N | 6211 | Brazil - 42°W to 36°W and north of 0°N | 0 | -42 | 0.74 | -38.22 |
| SIRGAS_2000_UTM_Zone_24S | 31984 | Brazil - 42°W to 36°W | -26.35 | -42 | 0.74 | -36 |
| SIRGAS_2000_UTM_Zone_25S | 31985 | Brazil - 36°W to 30°W | -23.8 | -36 | 4.19 | -29.99 |
| SIRGAS_2000_UTM_Zone_26S | 5396 | Brazil - east of 30°W | -23.86 | -30 | 4.26 | -25.28 |
| SIRGAS-Chile_2010_UTM_Zone_18S | 8950 | Chile - 78°W to 72°W | -59.36 | -78 | -18.35 | -71.99 |
| SIRGAS-Chile_2010_UTM_Zone_19S | 8951 | Chile - 72°W to 66°W | -59.87 | -72 | -17.5 | -66 |
| SIRGAS-Chile_2013_UTM_Zone_18S | 9149 | Chile - 78°W to 72°W | -59.36 | -78 | -18.35 | -71.99 |
| SIRGAS-Chile_2013_UTM_Zone_19S | 9150 | Chile - 72°W to 66°W | -59.87 | -72 | -17.5 | -66 |
| SIRGAS-Chile_2016_UTM_Zone_18S | 9154 | Chile - 78°W to 72°W | -59.36 | -78 | -18.35 | -71.99 |
| SIRGAS-Chile_2016_UTM_Zone_19S | 9155 | Chile - 72°W to 66°W | -59.87 | -72 | -17.5 | -66 |
| SIRGAS-Chile_UTM_Zone_18S | 5362 | Chile - 78°W to 72°W | -59.36 | -78 | -18.35 | -71.99 |
| SIRGAS-Chile_UTM_Zone_19S | 5361 | Chile - 72°W to 66°W | -59.87 | -72 | -17.5 | -66 |
| SIRGAS-ROU98_UTM_Zone_21S | 5382 | Uruguay - west of 54°W | -36.63 | -58.49 | -30.09 | -54 |
| SIRGAS-ROU98_UTM_Zone_22S | 5383 | Uruguay - east of 54°W | -37.77 | -54 | -31.9 | -50.01 |
| SIRGAS_UTM_Zone_17N | 31986 | South America - 84°W to 78°W, N hemisphere and SIRGAS95 by country | 0.9 | -84 | 15.51 | -78 |
| SIRGAS_UTM_Zone_17S | 31992 | South America - 84°W to 78°W, S hemisphere and SIRGAS95 by country | -56.45 | -84 | 1.45 | -75.21 |
| SIRGAS_UTM_Zone_18N | 31987 | South America - 78°W to 72°W, N hemisphere | 0 | -78 | 15.04 | -72 |
| SIRGAS_UTM_Zone_18S | 31993 | South America - 78°W to 72°W, S hemisphere and SIRGAS 1995 by country | -59.36 | -78 | 0 | -71.99 |
| SIRGAS_UTM_Zone_19N | 31988 | South America - 72°W to 66°W, N hemisphere | 0 | -72 | 15.64 | -66 |
| SIRGAS_UTM_Zone_19S | 31994 | South America - 72°W to 66°W, S hemisphere | -59.87 | -72 | 0 | -66 |
| SIRGAS_UTM_Zone_20N | 31989 | South America - 66°W to 60°W, N hemisphere | 0 | -66 | 16.75 | -60 |
| SIRGAS_UTM_Zone_20S | 31995 | South America - 66°W to 60°W, S hemisphere | -58.39 | -66 | 0 | -60 |
| SIRGAS_UTM_Zone_21N | 31990 | South America - 60°W to 54°W, N hemisphere | 0 | -60 | 10.7 | -54 |
| SIRGAS_UTM_Zone_21S | 31996 | South America - 60°W to 54°W, S hemisphere | -44.82 | -60 | 0 | -54 |
| SIRGAS_UTM_Zone_22N | 31991 | South America - 54°W to 48°W, N hemisphere | 0 | -54 | 9.24 | -48 |
| SIRGAS_UTM_Zone_22S | 31997 | South America - 54°W to 48°W, S hemisphere | -39.95 | -54 | 0 | -48 |
| SIRGAS_UTM_Zone_23S | 31998 | South America - 48°W to 42°W | -33.5 | -48 | 0 | -42 |
| SIRGAS_UTM_Zone_24S | 31999 | South America - 42°W to 36°W | -26.35 | -42 | 0 | -36 |
| SIRGAS_UTM_Zone_25S | 32000 | South America - 36°W to 30°W | -20.11 | -36 | 0 | -30 |
| Sister_Islands_National_Grid_1961 | 6129 | Cayman Islands - Little Cayman and Cayman Brac | 19.63 | -80.14 | 19.78 | -79.69 |
| S-JTSK_Ferro_Krovak | 2065 | Europe - Czechoslovakia | 47.73 | 12.09 | 51.06 | 22.56 |
| S-JTSK_Ferro_Krovak_East_North | 5221 | Europe - Czechoslovakia | 47.73 | 12.09 | 51.06 | 22.56 |
| S-JTSK_Krovak | 5513 | Europe - Czechoslovakia | 47.73 | 12.09 | 51.06 | 22.56 |
| S-JTSK_Krovak_East_North | 5514 | Europe - Czechoslovakia | 47.73 | 12.09 | 51.06 | 22.56 |
| S-JTSK_[JTSK03]_Krovak | 8352 | Slovakia | 47.73 | 16.84 | 49.61 | 22.56 |
| S-JTSK_[JTSK03]_Krovak_East_North | 8353 | Slovakia | 47.73 | 16.84 | 49.61 | 22.56 |
| SLD99_Sri_Lanka_Grid_1999 | 5235 | Sri Lanka - onshore | 5.86 | 79.64 | 9.88 | 81.95 |
| Slovenia_1996_Slovene_National_Grid | 3794 | Slovenia | 45.42 | 13.38 | 46.88 | 16.61 |
| Slovenia_1996_UTM_Zone_33N | 8687 | Slovenia | 45.42 | 13.38 | 46.88 | 16.61 |
| South_America_Albers_Equal_Area_ Conic | 102033 | South America | -60 | -90 | 15 | -30 |
| South_America_Equidistant_Conic | 102032 | South America | -60 | -90 | 15 | -30 |
| South_America_Lambert_Conformal_ Conic | 102015 | South America | -60 | -90 | 15 | -30 |
| South_East_Island_1943_UTM_Zone_ 40N | 6915 | Seychelles - Seychelles Bank | -4.86 | 55.15 | -3.66 | 56.01 |
| South_Pole_Azimuthal_Equidistant | 102019 | World - south of 0°N | -90 | -180 | 0 | 180 |
| South_Pole_Gnomonic | 102036 | World - south of 0°N | -90 | -180 | 0 | 180 |
| South_Pole_Lambert_Azimuthal_Equal_ Area | 102020 | World - south of 0°N | -90 | -180 | 0 | 180 |
| South_Pole_Orthographic | 102037 | World - south of 0°N | -90 | -180 | 0 | 180 |
| South_Pole_Stereographic | 102021 | World - south of 0°N | -90 | -180 | 0 | 180 |
| South_Yemen_GK_Zone_8 | 2395 | Yemen - South Yemen - mainland west of 48°E | 12.54 | 43.37 | 17.95 | 48.01 |
| South_Yemen_GK_Zone_9 | 2396 | Yemen - South Yemen - mainland east of 48°E | 13.94 | 48 | 19 | 53.14 |
| Sphere_Aitoff | 53043 | World | -90 | -180 | 90 | 180 |
| Sphere_Azimuthal_Equidistant | 53032 | World | -90 | -180 | 90 | 180 |
| Sphere_Behrmann | 53017 | World | -90 | -180 | 90 | 180 |
| Sphere_Bonne | 53024 | World | -90 | -180 | 90 | 180 |
| Sphere_Cassini | 53028 | World | -90 | -180 | 90 | 180 |
| Sphere_Compact_Miller | 53080 | World | -90 | -180 | 90 | 180 |
| Sphere_Craster_Parabolic | 53046 | World | -90 | -180 | 90 | 180 |
| Sphere_Cylindrical_Equal_Area | 53034 | World | -90 | -180 | 90 | 180 |
| Sphere_Eckert_I | 53015 | World | -90 | -180 | 90 | 180 |
| Sphere_Eckert_II | 53014 | World | -90 | -180 | 90 | 180 |
| Sphere_Eckert_III | 53013 | World | -90 | -180 | 90 | 180 |
| Sphere_Eckert_IV | 53012 | World | -90 | -180 | 90 | 180 |
| Sphere_Eckert_V | 53011 | World | -90 | -180 | 90 | 180 |
| Sphere_Eckert_VI | 53010 | World | -90 | -180 | 90 | 180 |
| Sphere_Equal_Earth_Greenwich | 53035 | World | -90 | -180 | 90 | 180 |
| Sphere_Equal_Earth_Americas | 53036 | World | -90 | -180 | 90 | 180 |
| Sphere_Equal_Earth_Asia_Pacific | 53037 | World | -90 | -180 | 90 | 180 |
| Sphere_Equidistant_Conic | 53027 | World | -90 | -180 | 90 | 180 |
| Sphere_Equidistant_Cylindrical | 53002 | World | -90 | -180 | 90 | 180 |
| Sphere_Flat_Polar_Quartic | 53045 | World | -90 | -180 | 90 | 180 |
| Sphere_Gall_Stereographic | 53016 | World | -90 | -180 | 90 | 180 |
| Sphere_Hammer_Aitoff | 53044 | World | -90 | -180 | 90 | 180 |
| Sphere_Hotine | 53025 | World | -90 | -180 | 90 | 180 |
| Sphere_Loximuthal | 53023 | World | -90 | -180 | 90 | 180 |
| Sphere_Mercator | 53004 | World | -90 | -180 | 90 | 180 |
| Sphere_Miller_Cylindrical | 53003 | World | -90 | -180 | 90 | 180 |
| Sphere_Mollweide | 53009 | World | -90 | -180 | 90 | 180 |
| Sphere_Natural_Earth | 53077 | World | -90 | -180 | 90 | 180 |
| Sphere_Natural_Earth_II | 53078 | World | -90 | -180 | 90 | 180 |
| Sphere_Patterson | 53079 | World | -90 | -180 | 90 | 180 |
| Sphere_Plate_Carree | 53001 | World | -90 | -180 | 90 | 180 |
| Sphere_Polyconic | 53021 | World | -90 | -180 | 90 | 180 |
| Sphere_Quartic_Authalic | 53022 | World | -90 | -180 | 90 | 180 |
| Sphere_Robinson | 53030 | World | -90 | -180 | 90 | 180 |
| Sphere_Sinusoidal | 53008 | World | -90 | -180 | 90 | 180 |
| Sphere_Stereographic | 53026 | World | -90 | -180 | 90 | 180 |
| Sphere_Times | 53048 | World | -90 | -180 | 90 | 180 |
| Sphere_Two_Point_Equidistant | 53031 | World | -90 | -180 | 90 | 180 |
| Sphere_Van_der_Grinten_I | 53029 | World | -90 | -180 | 90 | 180 |
| Sphere_Vertical_Perspective | 53049 | World | -90 | -180 | 90 | 180 |
| Sphere_Wagner_IV | 53074 | World | -90 | -180 | 90 | 180 |
| Sphere_Wagner_V | 53075 | World | -90 | -180 | 90 | 180 |
| Sphere_Wagner_VII | 53076 | World | -90 | -180 | 90 | 180 |
| Sphere_Winkel_I | 53018 | World | -90 | -180 | 90 | 180 |
| Sphere_Winkel_II | 53019 | World | -90 | -180 | 90 | 180 |
| Sphere_Winkel_Tripel_NGS | 53042 | World | -90 | -180 | 90 | 180 |
| SRB_ETRS89_UTM_zone_34N | 8682 | Serbia and Kosovo | 41.85 | 18.81 | 46.19 | 23.01 |
| ST71_Belep_UTM_58S | 2997 | New Caledonia - Belep | -19.85 | 163.54 | -19.5 | 163.75 |
| ST84_Ile_des_Pins_UTM_58S | 2996 | New Caledonia - Ile des Pins | -22.73 | 167.36 | -22.49 | 167.61 |
| ST87_Ouvea_UTM_58S | 3164 | New Caledonia - Ouvea | -20.77 | 166.44 | -20.34 | 166.71 |
| Stereo_33 | 31600 | Romania - onshore | 43.62 | 20.26 | 48.27 | 29.74 |
| Stereo_70 | 31700 | Romania | 43.44 | 20.26 | 48.27 | 31.41 |
| St_Helena_Tritan_SHLG(Tritan) | 7882 | St Helena - St Helena Island | -16.08 | -5.85 | -15.85 | -5.58 |
| St_Helena_Tritan_UTM_zone_30S | 7883 | St Helena - St Helena Island | -16.08 | -5.85 | -15.85 | -5.58 |
| St_Kitts_1955_British_West_Indies_Grid | 2005 | St Kitts and Nevis - onshore | 17.06 | -62.92 | 17.46 | -62.5 |
| St_Lucia_1955_British_West_Indies_Grid | 2006 | St Lucia - onshore | 13.66 | -61.13 | 14.16 | -60.82 |
| St_Vincent_1945_British_West_Indies_ Grid | 2007 | St Vincent and the Grenadines - onshore | 12.54 | -61.52 | 13.44 | -61.07 |
| Sud_Algerie_Ancienne | 30492 | Algeria - 31°30'N to 34°39'N | 31.49 | -3.85 | 34.66 | 9.22 |
| Sud_Algerie_Ancienne_Degree | 102492 | Algeria | 18.97 | -8.67 | 38.8 | 11.99 |
| Sudan_UTM_Zone_35N | 29635 | Sudan - south - west of 30°E | 3 | 22 | 22 | 30 |
| Sudan_UTM_Zone_36N | 29636 | Sudan - south - east of 30°E | 3 | 30 | 22 | 38.5 |
| Sud_Maroc | 26192 | Morocco - south of 31.5°N | 27.66 | -13.24 | 31.51 | -3.59 |
| Sud_Maroc_Degree | 102192 | Morocco - south of 31.5°N | 27.66 | -13.24 | 31.51 | -3.59 |
| Sud_Tunisie | 22392 | Tunisia - south of 34°39'N | 30.23 | 7.49 | 34.66 | 11.59 |
| SVY21_Singapore_TM | 3414 | Singapore | 1.13 | 103.59 | 1.47 | 104.07 |
| SWEREF99_12_00 | 3007 | Sweden - 12 00 | 56.74 | 10.93 | 60.13 | 13.11 |
| SWEREF99_13_30 | 3008 | Sweden - 13 30 | 55.28 | 12.12 | 62.28 | 14.79 |
| SWEREF99_14_15 | 3012 | Sweden - 14 15 | 61.55 | 11.93 | 64.39 | 15.55 |
| SWEREF99_15_00 | 3009 | Sweden - 15 00 | 55.95 | 13.54 | 61.62 | 16.15 |
| SWEREF99_15_45 | 3013 | Sweden - 15 45 | 60.44 | 13.66 | 65.13 | 17.01 |
| SWEREF99_16_30 | 3010 | Sweden - 16 30 | 56.15 | 15.41 | 62.26 | 17.63 |
| SWEREF99_17_15 | 3014 | Sweden - 17 15 | 62.12 | 14.31 | 67.19 | 19.04 |
| SWEREF99_18_00 | 3011 | Sweden - 18 00 | 58.66 | 17.08 | 60.7 | 19.61 |
| SWEREF99_18_45 | 3015 | Sweden - 18 45 | 56.86 | 17.18 | 66.17 | 20.22 |
| SWEREF99_20_15 | 3016 | Sweden - 20 15 | 63.45 | 16.08 | 69.07 | 23.28 |
| SWEREF99_21_45 | 3017 | Sweden - 21 45 | 65.01 | 19.63 | 66.43 | 22.91 |
| SWEREF99_23_15 | 3018 | Sweden - 23 15 | 65.49 | 21.85 | 68.14 | 24.17 |
| SWEREF99_County_ST74 | 3854 | Sweden - Stockholm county | 58.69 | 17.25 | 60.27 | 19.61 |
| SWEREF99_RT90_0_gon_emulation | 3848 | Sweden - 0 gon | 56.86 | 16.08 | 68.54 | 20.22 |
| SWEREF99_RT90_2.5_gon_O_emulation | 3849 | Sweden - 2.5 gon E | 63.37 | 18.4 | 69.07 | 22.2 |
| SWEREF99_RT90_2.5_gon_V_emulation | 3847 | Sweden - 2.5 gon W | 55.95 | 13.66 | 67.18 | 17.73 |
| SWEREF99_RT90_5_gon_O_emulation | 3850 | Sweden - 5 gon E | 65.24 | 21.34 | 68.58 | 24.17 |
| SWEREF99_RT90_5_gon_V_emulation | 3846 | Sweden - 5 gon W | 55.28 | 11.81 | 64.39 | 15.44 |
| SWEREF99_RT90_7.5_gon_V_emulation | 3845 | Sweden - 7.5 gon W | 57.29 | 10.93 | 59.73 | 12.91 |
| SWEREF99_TM | 3006 | Sweden | 54.96 | 10.03 | 69.07 | 24.17 |
| Tahaa_1954_UTM_5S | 2977 | French Polynesia - Society Islands - Bora Bora, Huahine, Raiatea, Tahaa | -16.96 | -151.91 | -16.17 | -150.89 |
| Tahiti_1952_UTM_6S | 2976 | French Polynesia - Society Islands - Moorea and Tahiti | -17.93 | -150 | -17.41 | -149.11 |
| Tahiti_1979_UTM_Zone_6S | 3304 | French Polynesia - Society Islands - Tahiti | -17.93 | -149.7 | -17.44 | -149.09 |
| Tananarive_1925_Laborde_Grid | 8441 | Madagascar - onshore | -25.64 | 43.18 | -11.89 | 50.56 |
| Tananarive_1925_Paris_Laborde_Grid | 29701 | Madagascar - onshore | -25.64 | 43.18 | -11.89 | 50.56 |
| Tananarive_1925_UTM_Zone_38S | 29738 | Madagascar - nearshore - west of 48°E | -26.59 | 42.53 | -13 | 48 |
| Tananarive_1925_UTM_Zone_39S | 29739 | Madagascar - nearshore - east of 48°E | -24.21 | 48 | -11.69 | 51.03 |
| Tapi_Aike_Argentina_1 | 9249 | Argentina - south Santa Cruz west of 70.5°W | -52 | -73.28 | -50.33 | -70.5 |
| Tapi_Aike_Argentina_2 | 9250 | Argentina - south Santa Cruz east of 70.5°W | -52.43 | -70.5 | -50.33 | -68.3 |
| TC_1948_UTM_Zone_39N | 30339 | UAE - Abu Dhabi - onshore west of 54°E | 22.76 | 51.56 | 24.32 | 54.01 |
| TC_1948_UTM_Zone_40N | 30340 | UAE - Abu Dhabi and Dubai - onshore east of 54°E | 22.63 | 53.99 | 25.34 | 56.03 |
| Tete_UTM_Zone_36S | 2736 | Mozambique - onshore west of 36°E | -26.87 | 30.21 | -11.41 | 36 |
| Tete_UTM_Zone_37S | 2737 | Mozambique - onshore east of 36°E | -18.98 | 35.99 | -10.42 | 40.9 |
| TGD2005_Tonga_Map_Grid | 5887 | Tonga | -25.68 | -179.08 | -14.14 | -171.28 |
| The_World_From_Space | 102038 | World | -90 | -180 | 90 | 180 |
| Timbalai_1948_RSO_Borneo_Chains | 29871 | Asia - Brunei and East Malaysia | 0.85 | 109.31 | 7.67 | 119.61 |
| Timbalai_1948_RSO_Borneo_Feet | 29872 | Malaysia - East Malaysia onshore | 0.85 | 109.54 | 7.41 | 119.33 |
| Timbalai_1948_RSO_Borneo_Meters | 29873 | Asia - Brunei and East Malaysia | 0.85 | 109.31 | 7.67 | 119.61 |
| Timbalai_1948_UTM_Zone_49N | 29849 | Asia - Brunei and East Malaysia - 108°E to 114°E | 0.85 | 109.31 | 7.37 | 114 |
| Timbalai_1948_UTM_Zone_50N | 29850 | Asia - Brunei and East Malaysia - 114°E to 120°E | 1.43 | 114 | 7.67 | 119.61 |
| TM65_Irish_Grid | 29902 | Ireland - onshore | 51.39 | -10.56 | 55.43 | -5.93 |
| TM75_Irish_Grid | 29903 | Europe - Ireland (Republic and Ulster) - onshore | 51.39 | -10.56 | 55.43 | -5.34 |
| Tokyo_UTM_Zone_51N | 3092 | Japan - 120°E to 126°E onshore | 23.98 | 123.62 | 24.94 | 125.51 |
| Tokyo_UTM_Zone_52N | 3093 | Japan - 126°E to 132°E onshore | 24.4 | 126.63 | 34.9 | 132 |
| Tokyo_UTM_Zone_53N | 3094 | Japan - 132°E to 138°E onshore | 20.37 | 132 | 37.58 | 138 |
| Tokyo_UTM_Zone_54N | 3095 | Japan - 138°E to 144°E onshore | 24.67 | 138 | 45.54 | 144 |
| Tokyo_UTM_Zone_55N | 3096 | Japan - 144°E to 150°E onshore | 42.84 | 144 | 44.4 | 145.87 |
| Tokyo_UTM_Zone_56N | 102156 | World - N hemisphere - 150°E to 156°E | 0 | 150 | 84 | 156 |
| TPEN11_Grid | 9367 | UK - Liverpool to Leeds | 53.32 | -3.14 | 53.9 | -1.35 |
| Trinidad_1903_Trinidad_Grid | 30200 | Trinidad and Tobago - Trinidad | 9.83 | -62.09 | 11.51 | -60 |
| Trinidad_1903_Trinidad_Grid_Feet_ Clarke | 2314 | Trinidad and Tobago - Trinidad | 9.83 | -62.09 | 11.51 | -60 |
| TUREF_3_Degree_GK_Zone_10 | 5270 | Turkey - 28.5°E to 31.5°E onshore | 36.06 | 28.5 | 41.46 | 31.5 |
| TUREF_3_Degree_GK_Zone_11 | 5271 | Turkey - 31.5°E to 34.5°E onshore | 35.97 | 31.5 | 42.07 | 34.5 |
| TUREF_3_Degree_GK_Zone_12 | 5272 | Turkey - 34.5°E to 37.5°E onshore | 35.81 | 34.5 | 42.15 | 37.5 |
| TUREF_3_Degree_GK_Zone_13 | 5273 | Turkey - 37.5°E to 40.5°E onshore | 36.66 | 37.5 | 41.19 | 40.5 |
| TUREF_3_Degree_GK_Zone_14 | 5274 | Turkey - 40.5°E to 43.5°E onshore | 37.02 | 40.5 | 41.6 | 43.5 |
| TUREF_3_Degree_GK_Zone_15 | 5275 | Turkey - east of 43.5°E | 36.97 | 43.5 | 41.02 | 44.83 |
| TUREF_3_Degree_GK_Zone_9 | 5269 | Turkey - west of 28.5°E onshore | 36.5 | 25.62 | 42.11 | 28.5 |
| TUREF_LAEA_Europe | 5636 | Turkey | 34.42 | 25.62 | 43.45 | 44.83 |
| TUREF_LCC_Europe | 5637 | Turkey | 34.42 | 25.62 | 43.45 | 44.83 |
| TUREF_TM27 | 5253 | Turkey - west of 28.5°E onshore | 36.5 | 25.62 | 42.11 | 28.5 |
| TUREF_TM30 | 5254 | Turkey - 28.5°E to 31.5°E onshore | 36.06 | 28.5 | 41.46 | 31.5 |
| TUREF_TM33 | 5255 | Turkey - 31.5°E to 34.5°E onshore | 35.97 | 31.5 | 42.07 | 34.5 |
| TUREF_TM36 | 5256 | Turkey - 34.5°E to 37.5°E onshore | 35.81 | 34.5 | 42.15 | 37.5 |
| TUREF_TM39 | 5257 | Turkey - 37.5°E to 40.5°E onshore | 36.66 | 37.5 | 41.19 | 40.5 |
| TUREF_TM42 | 5258 | Turkey - 40.5°E to 43.5°E onshore | 37.02 | 40.5 | 41.6 | 43.5 |
| TUREF_TM45 | 5259 | Turkey - east of 43.5°E | 36.97 | 43.5 | 41.02 | 44.83 |
| TWD_1967_TM_Penghu | 3827 | Taiwan - onshore - Penghu | 23.12 | 119.25 | 23.82 | 119.78 |
| TWD_1967_TM_Taiwan | 3828 | Taiwan - onshore - mainland | 21.87 | 119.99 | 25.34 | 122.06 |
| TWD_1997_TM_Penghu | 3825 | Taiwan - 118°E to 120°E | 18.63 | 118 | 24.65 | 120 |
| TWD_1997_TM_Taiwan | 3826 | Taiwan - 120°E to 122°E | 20.41 | 119.99 | 26.72 | 122.06 |
| Ukraine_2000_3_Degree_GK_CM_21E | 5577 | Ukraine - west of 22.5°E | 48.24 | 22.15 | 48.98 | 22.5 |
| Ukraine_2000_3_Degree_GK_CM_24E | 5578 | Ukraine - 22.5°E to 25.5°E | 47.71 | 22.5 | 51.96 | 25.5 |
| Ukraine_2000_3_Degree_GK_CM_27E | 5579 | Ukraine - 25.5°E to 28.5°E | 45.26 | 25.5 | 51.94 | 28.5 |
| Ukraine_2000_3_Degree_GK_CM_30E | 5580 | Ukraine - 28.5°E to 31.5°E | 43.42 | 28.5 | 52.12 | 31.5 |
| Ukraine_2000_3_Degree_GK_CM_33E | 5581 | Ukraine - 31.5°E to 34.5°E | 43.18 | 31.5 | 52.38 | 34.5 |
| Ukraine_2000_3_Degree_GK_CM_36E | 5582 | Ukraine - 34.5°E to 37.5°E | 43.24 | 34.5 | 51.25 | 37.5 |
| Ukraine_2000_3_Degree_GK_CM_39E | 5583 | Ukraine - east of 37.5°E | 46.77 | 37.5 | 50.39 | 40.18 |
| Ukraine_2000_3_Degree_GK_Zone_10 | 5573 | Ukraine - 28.5°E to 31.5°E | 43.42 | 28.5 | 52.12 | 31.5 |
| Ukraine_2000_3_Degree_GK_Zone_11 | 5574 | Ukraine - 31.5°E to 34.5°E | 43.18 | 31.5 | 52.38 | 34.5 |
| Ukraine_2000_3_Degree_GK_Zone_12 | 5575 | Ukraine - 34.5°E to 37.5°E | 43.24 | 34.5 | 51.25 | 37.5 |
| Ukraine_2000_3_Degree_GK_Zone_13 | 5576 | Ukraine - east of 37.5°E | 46.77 | 37.5 | 50.39 | 40.18 |
| Ukraine_2000_3_Degree_GK_Zone_7 | 5570 | Ukraine - west of 22.5°E | 48.24 | 22.15 | 48.98 | 22.5 |
| Ukraine_2000_3_Degree_GK_Zone_8 | 5571 | Ukraine - 22.5°E to 25.5°E | 47.71 | 22.5 | 51.96 | 25.5 |
| Ukraine_2000_3_Degree_GK_Zone_9 | 5572 | Ukraine - 25.5°E to 28.5°E | 45.26 | 25.5 | 51.94 | 28.5 |
| Ukraine_2000_GK_CM_21E | 5566 | Ukraine - west of 24°E | 47.95 | 22.15 | 51.66 | 24 |
| Ukraine_2000_GK_CM_27E | 5567 | Ukraine - 24°E to 30°E | 45.1 | 24 | 51.96 | 30 |
| Ukraine_2000_GK_CM_33E | 5568 | Ukraine - 30°E to 36°E | 43.18 | 30 | 52.38 | 36 |
| Ukraine_2000_GK_CM_39E | 5569 | Ukraine - east of 36°E | 43.43 | 36 | 50.44 | 40.18 |
| Ukraine_2000_GK_Zone_4 | 5562 | Ukraine - west of 24°E | 47.95 | 22.15 | 51.66 | 24 |
| Ukraine_2000_GK_Zone_5 | 5563 | Ukraine - 24°E to 30°E | 45.1 | 24 | 51.96 | 30 |
| Ukraine_2000_GK_Zone_6 | 5564 | Ukraine - 30°E to 36°E | 43.18 | 30 | 52.38 | 36 |
| Ukraine_2000_GK_Zone_7 | 5565 | Ukraine - east of 36°E | 43.43 | 36 | 50.44 | 40.18 |
| Ukraine_2000_TM_Zone_10 | 6384 | Ukraine - 28.5°E to 31.5°E | 43.42 | 28.5 | 52.12 | 31.5 |
| Ukraine_2000_TM_Zone_11 | 6385 | Ukraine - 31.5°E to 34.5°E | 43.18 | 31.5 | 52.38 | 34.5 |
| Ukraine_2000_TM_Zone_12 | 6386 | Ukraine - 34.5°E to 37.5°E | 43.24 | 34.5 | 51.25 | 37.5 |
| Ukraine_2000_TM_Zone_13 | 6387 | Ukraine - east of 37.5°E | 46.77 | 37.5 | 50.39 | 40.18 |
| Ukraine_2000_TM_Zone_7 | 6381 | Ukraine - west of 22.5°E | 48.24 | 22.15 | 48.98 | 22.5 |
| Ukraine_2000_TM_Zone_8 | 6382 | Ukraine - 22.5°E to 25.5°E | 47.71 | 22.5 | 51.96 | 25.5 |
| Ukraine_2000_TM_Zone_9 | 6383 | Ukraine - 25.5°E to 28.5°E | 45.26 | 25.5 | 51.94 | 28.5 |
| UPS_North | 32661 | World - N hemisphere - north of 60°N | 60 | -180 | 90 | 180 |
| UPS_South | 32761 | World - S hemisphere - south of 60°S | -90 | -180 | -60 | 180 |
| USA_Contiguous_Albers_Equal_Area_ Conic | 102003 | USA - CONUS - onshore | 24.41 | -124.79 | 49.38 | -66.91 |
| USA_Contiguous_Albers_Equal_Area_ Conic_USGS_version | 102039 | USA - CONUS - onshore | 24.41 | -124.79 | 49.38 | -66.91 |
| USA_Contiguous_Equidistant_Conic | 102005 | USA - CONUS - onshore | 24.41 | -124.79 | 49.38 | -66.91 |
| USA_Contiguous_Lambert_Conformal_ Conic | 102004 | USA - CONUS - onshore | 24.41 | -124.79 | 49.38 | -66.91 |
| US_National_Atlas_Equal_Area | 2163 | USA | 15.56 | 167.65 | 74.71 | -65.69 |
| UTM_Bangladesh_(BTM) | 102953 | Bangladesh | 18.56 | 88.01 | 26.64 | 92.67 |
| UTM_Gulshan | 102955 | Bangladesh | 18.56 | 88.01 | 26.64 | 92.67 |
| UWPP_1992 | 102194 | Poland | 49 | 14.14 | 55.93 | 24.15 |
| UWPP_2000_PAS_5 | 102195 | Poland - west of 16.5°E | 50.26 | 14.14 | 55.35 | 16.5 |
| UWPP_2000_PAS_6 | 102196 | Poland - 16.5°E to 19.5°E | 49.39 | 16.5 | 55.93 | 19.5 |
| UWPP_2000_PAS_7 | 102197 | Poland - 19.5°E to 22.5°E | 49.09 | 19.5 | 54.55 | 22.5 |
| UWPP_2000_PAS_8 | 102198 | Poland - east of 22.5°E | 49 | 22.5 | 54.41 | 24.15 |
| VN-2000_TM-3_103-00 | 9205 | Vietnam - Dien Bien and Lai Chau | 20.89 | 102.14 | 22.82 | 103.99 |
| VN-2000_TM-3_104-00 | 9206 | Vietnam - Son La | 20.57 | 103.21 | 22.04 | 105.03 |
| VN-2000_TM-3_104-30 | 9207 | Vietnam - Ca Mau and Kien Giang | 8.33 | 103.4 | 10.55 | 105.54 |
| VN-2000_TM-3_104-45 | 9208 | Vietnam - An Giang, Lao Cai, Nghe An, Phu Tho, Yen Bai | 10.18 | 103.53 | 22.85 | 105.86 |
| VN-2000_TM-3_105-30 | 9209 | Vietnam - 104°20'E to 106°40'E by province | 9.19 | 104.33 | 23.4 | 106.69 |
| VN-2000_TM-3_105-45 | 9210 | Vietnam - 105°15'E to 107°50'E by province - HCMC | 9.75 | 105.26 | 23.12 | 107.8 |
| VN-2000_TM-3_106-00 | 9211 | Vietnam - Hoa Binh, Quang Binh and Tuyen Quang | 16.92 | 104.83 | 22.7 | 107.03 |
| VN-2000_TM-3_106-15 | 9212 | Vietnam - Binh Phuoc and Quang Tri | 11.3 | 106.41 | 17.22 | 107.43 |
| VN-2000_TM-3_106-30 | 9213 | Vietnam - Bac Kan and Thai Nguyen | 21.32 | 105.43 | 22.75 | 106.25 |
| VN-2000_TM-3_107-00 | 9214 | Vietnam - Bac Giang and Thua Thien-Hue | 15.99 | 105.88 | 21.63 | 108.24 |
| VN-2000_TM-3_107-15 | 9215 | Vietnam - Lang Son | 21.32 | 106.09 | 22.47 | 107.37 |
| VN-2000_TM-3_107-30 | 9216 | Vietnam - Kon Tum | 13.92 | 107.33 | 15.42 | 108.55 |
| VN_2000_TM-3_107-45 | 5899 | Vietnam - Quang Ninh; Da Nang, Quang Nam; Ba Ria-Vung Tau, Dong Nai, Lam Dong | 8.57 | 106.43 | 21.67 | 108.76 |
| VN-2000_TM-3_108-15 | 9217 | Vietnam - Binh Dinh, Khanh Hoa, Ninh Thuan | 11.25 | 108.55 | 14.71 | 109.53 |
| VN-2000_TM-3_108-30 | 9218 | Vietnam - Binh Thuan, Dak Lak, Dak Nong, Gia Lai, Phu Yen | 10.43 | 107.2 | 14.61 | 109.52 |
| VN_2000_TM-3_zone_481 | 5896 | Vietnam - west of 103°30'E onshore | 9.2 | 102.14 | 22.82 | 103.51 |
| VN_2000_TM-3_zone_482 | 5897 | Vietnam - 103.5°E to 106.5°E onshore | 8.33 | 103.5 | 23.4 | 106.51 |
| VN_2000_TM-3_zone_491 | 5898 | Vietnam - east of 106.5°E onshore | 8.57 | 106.5 | 22.95 | 109.53 |
| VN_2000_UTM_Zone_48N | 3405 | Vietnam - west of 108°E onshore | 8.33 | 102.14 | 23.4 | 108 |
| VN_2000_UTM_Zone_49N | 3406 | Vietnam - east of 108°E onshore | 10.43 | 108 | 21.56 | 109.53 |
| Voirol_1879_Nord_Algerie_Ancienne | 30493 | Algeria - north of 34°39'N | 34.64 | -2.22 | 37.14 | 8.64 |
| Voirol_1879_Sud_Algerie_Ancienne | 30494 | Algeria - 31°30'N to 34°39'N | 31.49 | -3.85 | 34.66 | 9.22 |
| WGS_1972_BE_South_China_Sea_ Lambert | 3415 | China - offshore - Pearl River basin | 18.31 | 110.13 | 22.89 | 116.76 |
| WGS_1972_BE_TM_106_NE | 2094 | Vietnam - offshore Cuu Long basin | 7.99 | 106.54 | 11.15 | 110 |
| WGS_1972_UTM_Zone_10N | 32210 | World - N hemisphere - 126°W to 120°W | 0 | -126 | 84 | -120 |
| WGS_1972_UTM_Zone_10S | 32310 | World - S hemisphere - 126°W to 120°W | -80 | -126 | 0 | -120 |
| WGS_1972_UTM_Zone_11N | 32211 | World - N hemisphere - 120°W to 114°W | 0 | -120 | 84 | -114 |
| WGS_1972_UTM_Zone_11S | 32311 | World - S hemisphere - 120°W to 114°W | -80 | -120 | 0 | -114 |
| WGS_1972_UTM_Zone_12N | 32212 | World - N hemisphere - 114°W to 108°W | 0 | -114 | 84 | -108 |
| WGS_1972_UTM_Zone_12S | 32312 | World - S hemisphere - 114°W to 108°W | -80 | -114 | 0 | -108 |
| WGS_1972_UTM_Zone_13N | 32213 | World - N hemisphere - 108°W to 102°W | 0 | -108 | 84 | -102 |
| WGS_1972_UTM_Zone_13S | 32313 | World - S hemisphere - 108°W to 102°W | -80 | -108 | 0 | -102 |
| WGS_1972_UTM_Zone_14N | 32214 | World - N hemisphere - 102°W to 96°W | 0 | -102 | 84 | -96 |
| WGS_1972_UTM_Zone_14S | 32314 | World - S hemisphere - 102°W to 96°W | -80 | -102 | 0 | -96 |
| WGS_1972_UTM_Zone_15N | 32215 | World - N hemisphere - 96°W to 90°W | 0 | -96 | 84 | -90 |
| WGS_1972_UTM_Zone_15S | 32315 | World - S hemisphere - 96°W to 90°W | -80 | -96 | 0 | -90 |
| WGS_1972_UTM_Zone_16N | 32216 | World - N hemisphere - 90°W to 84°W | 0 | -90 | 84 | -84 |
| WGS_1972_UTM_Zone_16S | 32316 | World - S hemisphere - 90°W to 84°W | -80 | -90 | 0 | -84 |
| WGS_1972_UTM_Zone_17N | 32217 | World - N hemisphere - 84°W to 78°W | 0 | -84 | 84 | -78 |
| WGS_1972_UTM_Zone_17S | 32317 | World - S hemisphere - 84°W to 78°W | -80 | -84 | 0 | -78 |
| WGS_1972_UTM_Zone_18N | 32218 | World - N hemisphere - 78°W to 72°W | 0 | -78 | 84 | -72 |
| WGS_1972_UTM_Zone_18S | 32318 | World - S hemisphere - 78°W to 72°W | -80 | -78 | 0 | -72 |
| WGS_1972_UTM_Zone_19N | 32219 | World - N hemisphere - 72°W to 66°W | 0 | -72 | 84 | -66 |
| WGS_1972_UTM_Zone_19S | 32319 | World - S hemisphere - 72°W to 66°W | -80 | -72 | 0 | -66 |
| WGS_1972_UTM_Zone_1N | 32201 | World - N hemisphere - 180°W to 174°W | 0 | -180 | 84 | -174 |
| WGS_1972_UTM_Zone_1S | 32301 | World - S hemisphere - 180°W to 174°W | -80 | -180 | 0 | -174 |
| WGS_1972_UTM_Zone_20N | 32220 | World - N hemisphere - 66°W to 60°W | 0 | -66 | 84 | -60 |
| WGS_1972_UTM_Zone_20S | 32320 | World - S hemisphere - 66°W to 60°W | -80 | -66 | 0 | -60 |
| WGS_1972_UTM_Zone_21N | 32221 | World - N hemisphere - 60°W to 54°W | 0 | -60 | 84 | -54 |
| WGS_1972_UTM_Zone_21S | 32321 | World - S hemisphere - 60°W to 54°W | -80 | -60 | 0 | -54 |
| WGS_1972_UTM_Zone_22N | 32222 | World - N hemisphere - 54°W to 48°W | 0 | -54 | 84 | -48 |
| WGS_1972_UTM_Zone_22S | 32322 | World - S hemisphere - 54°W to 48°W | -80 | -54 | 0 | -48 |
| WGS_1972_UTM_Zone_23N | 32223 | World - N hemisphere - 48°W to 42°W | 0 | -48 | 84 | -42 |
| WGS_1972_UTM_Zone_23S | 32323 | World - S hemisphere - 48°W to 42°W | -80 | -48 | 0 | -42 |
| WGS_1972_UTM_Zone_24N | 32224 | World - N hemisphere - 42°W to 36°W | 0 | -42 | 84 | -36 |
| WGS_1972_UTM_Zone_24S | 32324 | World - S hemisphere - 42°W to 36°W | -80 | -42 | 0 | -36 |
| WGS_1972_UTM_Zone_25N | 32225 | World - N hemisphere - 36°W to 30°W | 0 | -36 | 84 | -30 |
| WGS_1972_UTM_Zone_25S | 32325 | World - S hemisphere - 36°W to 30°W | -80 | -36 | 0 | -30 |
| WGS_1972_UTM_Zone_26N | 32226 | World - N hemisphere - 30°W to 24°W | 0 | -30 | 84 | -24 |
| WGS_1972_UTM_Zone_26S | 32326 | World - S hemisphere - 30°W to 24°W | -80 | -30 | 0 | -24 |
| WGS_1972_UTM_Zone_27N | 32227 | World - N hemisphere - 24°W to 18°W | 0 | -24 | 84 | -18 |
| WGS_1972_UTM_Zone_27S | 32327 | World - S hemisphere - 24°W to 18°W | -80 | -24 | 0 | -18 |
| WGS_1972_UTM_Zone_28N | 32228 | World - N hemisphere - 18°W to 12°W | 0 | -18 | 84 | -12 |
| WGS_1972_UTM_Zone_28S | 32328 | World - S hemisphere - 18°W to 12°W | -80 | -18 | 0 | -12 |
| WGS_1972_UTM_Zone_29N | 32229 | World - N hemisphere - 12°W to 6°W | 0 | -12 | 84 | -6 |
| WGS_1972_UTM_Zone_29S | 32329 | World - S hemisphere - 12°W to 6°W | -80 | -12 | 0 | -6 |
| WGS_1972_UTM_Zone_2N | 32202 | World - N hemisphere - 174°W to 168°W | 0 | -174 | 84 | -168 |
| WGS_1972_UTM_Zone_2S | 32302 | World - S hemisphere - 174°W to 168°W | -80 | -174 | 0 | -168 |
| WGS_1972_UTM_Zone_30N | 32230 | World - N hemisphere - 6°W to 0°W | 0 | -6 | 84 | 0 |
| WGS_1972_UTM_Zone_30S | 32330 | World - S hemisphere - 6°W to 0°W | -80 | -6 | 0 | 0 |
| WGS_1972_UTM_Zone_31N | 32231 | World - N hemisphere - 0°E to 6°E | 0 | 0 | 84 | 6 |
| WGS_1972_UTM_Zone_31S | 32331 | World - S hemisphere - 0°E to 6°E | -80 | 0 | 0 | 6 |
| WGS_1972_UTM_Zone_32N | 32232 | World - N hemisphere - 6°E to 12°E | 0 | 6 | 84 | 12 |
| WGS_1972_UTM_Zone_32S | 32332 | World - S hemisphere - 6°E to 12°E | -80 | 6 | 0 | 12 |
| WGS_1972_UTM_Zone_33N | 32233 | World - N hemisphere - 12°E to 18°E | 0 | 12 | 84 | 18 |
| WGS_1972_UTM_Zone_33S | 32333 | World - S hemisphere - 12°E to 18°E | -80 | 12 | 0 | 18 |
| WGS_1972_UTM_Zone_34N | 32234 | World - N hemisphere - 18°E to 24°E | 0 | 18 | 84 | 24 |
| WGS_1972_UTM_Zone_34S | 32334 | World - S hemisphere - 18°E to 24°E | -80 | 18 | 0 | 24 |
| WGS_1972_UTM_Zone_35N | 32235 | World - N hemisphere - 24°E to 30°E | 0 | 24 | 84 | 30 |
| WGS_1972_UTM_Zone_35S | 32335 | World - S hemisphere - 24°E to 30°E | -80 | 24 | 0 | 30 |
| WGS_1972_UTM_Zone_36N | 32236 | World - N hemisphere - 30°E to 36°E | 0 | 30 | 84 | 36 |
| WGS_1972_UTM_Zone_36S | 32336 | World - S hemisphere - 30°E to 36°E | -80 | 30 | 0 | 36 |
| WGS_1972_UTM_Zone_37N | 32237 | World - N hemisphere - 36°E to 42°E | 0 | 36 | 84 | 42 |
| WGS_1972_UTM_Zone_37S | 32337 | World - S hemisphere - 36°E to 42°E | -80 | 36 | 0 | 42 |
| WGS_1972_UTM_Zone_38N | 32238 | World - N hemisphere - 42°E to 48°E | 0 | 42 | 84 | 48 |
| WGS_1972_UTM_Zone_38S | 32338 | World - S hemisphere - 42°E to 48°E | -80 | 42 | 0 | 48 |
| WGS_1972_UTM_Zone_39N | 32239 | World - N hemisphere - 48°E to 54°E | 0 | 48 | 84 | 54 |
| WGS_1972_UTM_Zone_39S | 32339 | World - S hemisphere - 48°E to 54°E | -80 | 48 | 0 | 54 |
| WGS_1972_UTM_Zone_3N | 32203 | World - N hemisphere - 168°W to 162°W | 0 | -168 | 84 | -162 |
| WGS_1972_UTM_Zone_3S | 32303 | World - S hemisphere - 168°W to 162°W | -80 | -168 | 0 | -162 |
| WGS_1972_UTM_Zone_40N | 32240 | World - N hemisphere - 54°E to 60°E | 0 | 54 | 84 | 60 |
| WGS_1972_UTM_Zone_40S | 32340 | World - S hemisphere - 54°E to 60°E | -80 | 54 | 0 | 60 |
| WGS_1972_UTM_Zone_41N | 32241 | World - N hemisphere - 60°E to 66°E | 0 | 60 | 84 | 66 |
| WGS_1972_UTM_Zone_41S | 32341 | World - S hemisphere - 60°E to 66°E | -80 | 60 | 0 | 66 |
| WGS_1972_UTM_Zone_42N | 32242 | World - N hemisphere - 66°E to 72°E | 0 | 66 | 84 | 72 |
| WGS_1972_UTM_Zone_42S | 32342 | World - S hemisphere - 66°E to 72°E | -80 | 66 | 0 | 72 |
| WGS_1972_UTM_Zone_43N | 32243 | World - N hemisphere - 72°E to 78°E | 0 | 72 | 84 | 78 |
| WGS_1972_UTM_Zone_43S | 32343 | World - S hemisphere - 72°E to 78°E | -80 | 72 | 0 | 78 |
| WGS_1972_UTM_Zone_44N | 32244 | World - N hemisphere - 78°E to 84°E | 0 | 78 | 84 | 84 |
| WGS_1972_UTM_Zone_44S | 32344 | World - S hemisphere - 78°E to 84°E | -80 | 78 | 0 | 84 |
| WGS_1972_UTM_Zone_45N | 32245 | World - N hemisphere - 84°E to 90°E | 0 | 84 | 84 | 90 |
| WGS_1972_UTM_Zone_45S | 32345 | World - S hemisphere - 84°E to 90°E | -80 | 84 | 0 | 90 |
| WGS_1972_UTM_Zone_46N | 32246 | World - N hemisphere - 90°E to 96°E | 0 | 90 | 84 | 96 |
| WGS_1972_UTM_Zone_46S | 32346 | World - S hemisphere - 90°E to 96°E | -80 | 90 | 0 | 96 |
| WGS_1972_UTM_Zone_47N | 32247 | World - N hemisphere - 96°E to 102°E | 0 | 96 | 84 | 102 |
| WGS_1972_UTM_Zone_47S | 32347 | World - S hemisphere - 96°E to 102°E | -80 | 96 | 0 | 102 |
| WGS_1972_UTM_Zone_48N | 32248 | World - N hemisphere - 102°E to 108°E | 0 | 102 | 84 | 108 |
| WGS_1972_UTM_Zone_48S | 32348 | World - S hemisphere - 102°E to 108°E | -80 | 102 | 0 | 108 |
| WGS_1972_UTM_Zone_49N | 32249 | World - N hemisphere - 108°E to 114°E | 0 | 108 | 84 | 114 |
| WGS_1972_UTM_Zone_49S | 32349 | World - S hemisphere - 108°E to 114°E | -80 | 108 | 0 | 114 |
| WGS_1972_UTM_Zone_4N | 32204 | World - N hemisphere - 162°W to 156°W | 0 | -162 | 84 | -156 |
| WGS_1972_UTM_Zone_4S | 32304 | World - S hemisphere - 162°W to 156°W | -80 | -162 | 0 | -156 |
| WGS_1972_UTM_Zone_50N | 32250 | World - N hemisphere - 114°E to 120°E | 0 | 114 | 84 | 120 |
| WGS_1972_UTM_Zone_50S | 32350 | World - S hemisphere - 114°E to 120°E | -80 | 114 | 0 | 120 |
| WGS_1972_UTM_Zone_51N | 32251 | World - N hemisphere - 120°E to 126°E | 0 | 120 | 84 | 126 |
| WGS_1972_UTM_Zone_51S | 32351 | World - S hemisphere - 120°E to 126°E | -80 | 120 | 0 | 126 |
| WGS_1972_UTM_Zone_52N | 32252 | World - N hemisphere - 126°E to 132°E | 0 | 126 | 84 | 132 |
| WGS_1972_UTM_Zone_52S | 32352 | World - S hemisphere - 126°E to 132°E | -80 | 126 | 0 | 132 |
| WGS_1972_UTM_Zone_53N | 32253 | World - N hemisphere - 132°E to 138°E | 0 | 132 | 84 | 138 |
| WGS_1972_UTM_Zone_53S | 32353 | World - S hemisphere - 132°E to 138°E | -80 | 132 | 0 | 138 |
| WGS_1972_UTM_Zone_54N | 32254 | World - N hemisphere - 138°E to 144°E | 0 | 138 | 84 | 144 |
| WGS_1972_UTM_Zone_54S | 32354 | World - S hemisphere - 138°E to 144°E | -80 | 138 | 0 | 144 |
| WGS_1972_UTM_Zone_55N | 32255 | World - N hemisphere - 144°E to 150°E | 0 | 144 | 84 | 150 |
| WGS_1972_UTM_Zone_55S | 32355 | World - S hemisphere - 144°E to 150°E | -80 | 144 | 0 | 150 |
| WGS_1972_UTM_Zone_56N | 32256 | World - N hemisphere - 150°E to 156°E | 0 | 150 | 84 | 156 |
| WGS_1972_UTM_Zone_56S | 32356 | World - S hemisphere - 150°E to 156°E | -80 | 150 | 0 | 156 |
| WGS_1972_UTM_Zone_57N | 32257 | World - N hemisphere - 156°E to 162°E | 0 | 156 | 84 | 162 |
| WGS_1972_UTM_Zone_57S | 32357 | World - S hemisphere - 156°E to 162°E | -80 | 156 | 0 | 162 |
| WGS_1972_UTM_Zone_58N | 32258 | World - N hemisphere - 162°E to 168°E | 0 | 162 | 84 | 168 |
| WGS_1972_UTM_Zone_58S | 32358 | World - S hemisphere - 162°E to 168°E | -80 | 162 | 0 | 168 |
| WGS_1972_UTM_Zone_59N | 32259 | World - N hemisphere - 168°E to 174°E | 0 | 168 | 84 | 174 |
| WGS_1972_UTM_Zone_59S | 32359 | World - S hemisphere - 168°E to 174°E | -80 | 168 | 0 | 174 |
| WGS_1972_UTM_Zone_5N | 32205 | World - N hemisphere - 156°W to 150°W | 0 | -156 | 84 | -150 |
| WGS_1972_UTM_Zone_5S | 32305 | World - S hemisphere - 156°W to 150°W | -80 | -156 | 0 | -150 |
| WGS_1972_UTM_Zone_60N | 32260 | World - N hemisphere - 174°E to 180°E | 0 | 174 | 84 | 180 |
| WGS_1972_UTM_Zone_60S | 32360 | World - S hemisphere - 174°E to 180°E | -80 | 174 | 0 | 180 |
| WGS_1972_UTM_Zone_6N | 32206 | World - N hemisphere - 150°W to 144°W | 0 | -150 | 84 | -144 |
| WGS_1972_UTM_Zone_6S | 32306 | World - S hemisphere - 150°W to 144°W | -80 | -150 | 0 | -144 |
| WGS_1972_UTM_Zone_7N | 32207 | World - N hemisphere - 144°W to 138°W | 0 | -144 | 84 | -138 |
| WGS_1972_UTM_Zone_7S | 32307 | World - S hemisphere - 144°W to 138°W | -80 | -144 | 0 | -138 |
| WGS_1972_UTM_Zone_8N | 32208 | World - N hemisphere - 138°W to 132°W | 0 | -138 | 84 | -132 |
| WGS_1972_UTM_Zone_8S | 32308 | World - S hemisphere - 138°W to 132°W | -80 | -138 | 0 | -132 |
| WGS_1972_UTM_Zone_9N | 32209 | World - N hemisphere - 132°W to 126°W | 0 | -132 | 84 | -126 |
| WGS_1972_UTM_Zone_9S | 32309 | World - S hemisphere - 132°W to 126°W | -80 | -132 | 0 | -126 |
| WGS_1984_Adams_Square_II | 54098 | World | -90 | -180 | 90 | 180 |
| WGS_1984_Andaman_and_Nicobar_ Islands | 7777 | India - Andaman and Nicobar Islands | 6.7 | 92.15 | 13.73 | 94.33 |
| WGS_1984_Andhra_Pradesh | 7756 | India - Andhra Pradesh and Telangana | 12.61 | 76.75 | 19.92 | 84.81 |
| WGS_1984_Antarctic_Polar_ Stereographic | 3031 | Antarctica | -90 | -180 | -60 | 180 |
| WGS_1984_ARC_System_Zone_01 | 102421 | ARC System - Zone 1 | 0 | -180 | 32 | 180 |
| WGS_1984_ARC_System_Zone_02 | 102422 | ARC System - Zone 2 | 32 | -180 | 48 | 180 |
| WGS_1984_ARC_System_Zone_03 | 102423 | ARC System - Zone 3 | 48 | -180 | 56 | 180 |
| WGS_1984_ARC_System_Zone_04 | 102424 | ARC System - Zone 4 | 56 | -180 | 64 | 180 |
| WGS_1984_ARC_System_Zone_05 | 102425 | ARC System - Zone 5 | 64 | -180 | 68 | 180 |
| WGS_1984_ARC_System_Zone_06 | 102426 | ARC System - Zone 6 | 68 | -180 | 72 | 180 |
| WGS_1984_ARC_System_Zone_07 | 102427 | ARC System - Zone 7 | 72 | -180 | 76 | 180 |
| WGS_1984_ARC_System_Zone_08 | 102428 | ARC System - Zone 8 | 76 | -180 | 80 | 180 |
| WGS_1984_ARC_System_Zone_09 | 102429 | ARC System - Zone 9 | 80 | -180 | 90 | 180 |
| WGS_1984_ARC_System_Zone_10 | 102430 | ARC System - Zone 10 | -32 | -180 | 0 | 180 |
| WGS_1984_ARC_System_Zone_11 | 102431 | ARC System - Zone 11 | -48 | -180 | -32 | 180 |
| WGS_1984_ARC_System_Zone_12 | 102432 | ARC System - Zone 12 | -56 | -180 | -48 | 180 |
| WGS_1984_ARC_System_Zone_13 | 102433 | ARC System - Zone 13 | -64 | -180 | -56 | 180 |
| WGS_1984_ARC_System_Zone_14 | 102434 | ARC System - Zone 14 | -68 | -180 | -64 | 180 |
| WGS_1984_ARC_System_Zone_15 | 102435 | ARC System - Zone 15 | -72 | -180 | -68 | 180 |
| WGS_1984_ARC_System_Zone_16 | 102436 | ARC System - Zone 16 | -76 | -180 | -72 | 180 |
| WGS_1984_ARC_System_Zone_17 | 102437 | ARC System - Zone 17 | -80 | -180 | -76 | 180 |
| WGS_1984_ARC_System_Zone_18 | 102438 | ARC System - Zone 18 | -90 | -180 | -80 | 180 |
| WGS_1984_Arctic_Polar_Stereographic | 3995 | World - N hemisphere - north of 60°N | 60 | -180 | 90 | 180 |
| WGS_1984_Arunachal_Pradesh | 7757 | India - Arunachal Pradesh | 26.65 | 91.55 | 29.47 | 97.42 |
| WGS_1984_Assam | 7758 | India - Assam | 24.13 | 89.69 | 27.98 | 96.03 |
| WGS_1984_Australian_Antarctic_ Lambert | 3033 | Antarctica - Australian sector north of 80°S | -80 | 45 | -60 | 160 |
| WGS_1984_Australian_Antarctic_Polar_ Stereographic | 3032 | Antarctica - Australian sector | -90 | 45 | -60 | 160 |
| WGS_1984_Australian_Centre_for_ Remote_Sensing_Lambert | 4462 | Australia - onshore | -43.7 | 112.85 | -9.86 | 153.69 |
| WGS_1984_Bihar | 7759 | India - Bihar | 24.28 | 83.31 | 27.86 | 88.3 |
| WGS_1984_BLM_Zone_14N_ftUS | 32664 | USA - GoM OCS - west of 96°W | 25.97 | -97.22 | 28.43 | -95.87 |
| WGS_1984_BLM_Zone_15N_ftUS | 32665 | USA - GoM OCS - 96°W to 90°W | 25.61 | -96 | 29.73 | -89.86 |
| WGS_1984_BLM_Zone_16N_ftUS | 32666 | USA - GoM OCS - 90°W to 84°W | 23.95 | -90.01 | 30.25 | -83.91 |
| WGS_1984_BLM_Zone_17N_ftUS | 32667 | USA - GoM OCS - east of 84°W | 23.82 | -84.09 | 29.94 | -81.17 |
| WGS_1984_California_Teale_Albers_Ft_I ntl | 102759 | USA - California | 32.53 | -124.45 | 42.01 | -114.12 |
| WGS_1984_California_Teale_Albers_FtUS | 102599 | USA - California | 32.53 | -124.45 | 42.01 | -114.12 |
| WGS_1984_Canada_Atlas_LCC | 102215 | Canada | 38.21 | -141.01 | 86.46 | -40.73 |
| WGS_1984_Cape_Verde_Grid | 4826 | Cape Verde | 11.47 | -28.85 | 20.54 | -19.53 |
| WGS_1984_Chhattisgarh | 7778 | India - Chhattisgarh | 17.78 | 80.23 | 24.11 | 84.39 |
| WGS_1984_CIG92 | 6720 | Christmas Island - onshore | -10.63 | 105.48 | -10.36 | 105.77 |
| WGS_1984_CKIG92 | 6722 | Cocos (Keeling) Islands - onshore | -12.27 | 96.76 | -11.76 | 96.99 |
| WGS_1984_Complex_UTM_Zone_20N | 102570 | World - N hemisphere - 66°W to 60°W | 0 | -66 | 84 | -60 |
| WGS_1984_Complex_UTM_Zone_21N | 102571 | World - N hemisphere - 60°W to 54°W | 0 | -60 | 84 | -54 |
| WGS_1984_Complex_UTM_Zone_22N | 102572 | World - N hemisphere - 54°W to 48°W | 0 | -54 | 84 | -48 |
| WGS_1984_Complex_UTM_Zone_23N | 102573 | World - N hemisphere - 48°W to 42°W | 0 | -48 | 84 | -42 |
| WGS_1984_Complex_UTM_Zone_24N | 102574 | World - N hemisphere - 42°W to 36°W | 0 | -42 | 84 | -36 |
| WGS_1984_Complex_UTM_Zone_25N | 102575 | World - N hemisphere - 36°W to 30°W | 0 | -36 | 84 | -30 |
| WGS_1984_Complex_UTM_Zone_26N | 102576 | World - N hemisphere - 30°W to 24°W | 0 | -30 | 84 | -24 |
| WGS_1984_Complex_UTM_Zone_27N | 102577 | World - N hemisphere - 24°W to 18°W | 0 | -24 | 84 | -18 |
| WGS_1984_Complex_UTM_Zone_28N | 102578 | World - N hemisphere - 18°W to 12°W | 0 | -18 | 84 | -12 |
| WGS_1984_Complex_UTM_Zone_29N | 102579 | World - N hemisphere - 12°W to 6°W | 0 | -12 | 84 | -6 |
| WGS_1984_Complex_UTM_Zone_30N | 102580 | World - N hemisphere - 6°W to 0°W | 0 | -6 | 84 | 0 |
| WGS_1984_Costa_Rica_TM_90 | 102223 | Costa Rica | 2.15 | -90.45 | 11.77 | -81.43 |
| WGS_1984_Delhi | 7760 | India - Delhi | 28.4 | 76.83 | 28.89 | 77.34 |
| WGS_1984_Dubai_Local_TM | 3997 | UAE - Dubai municipality | 24.85 | 54.84 | 25.34 | 55.55 |
| WGS_1984_EASE-Grid_2.0_Global | 6933 | World - 86°S to 86°N | -86 | -180 | 86 | 180 |
| WGS_1984_EASE-Grid_2.0_North | 6931 | World - north of 0°N | 0 | -180 | 90 | 180 |
| WGS_1984_EASE-Grid_2.0_South | 6932 | World - south of 0°N | -90 | -180 | 0 | 180 |
| WGS_1984_EASE_Grid_Global | 3975 | World - 86°S to 86°N | -86 | -180 | 86 | 180 |
| WGS_1984_EASE_Grid_North | 3973 | World - north of 0°N | 0 | -180 | 90 | 180 |
| WGS_1984_EASE_Grid_South | 3974 | World - south of 0°N | -90 | -180 | 0 | 180 |
| WGS_1984_EPSG_Alaska_Polar_ Stereographic | 5936 | World - N hemisphere - north of 60°N | 60 | -180 | 90 | 180 |
| WGS_1984_EPSG_Arctic_Regional_zone_ A1 | 5921 | Arctic - 87°N to 75°N, 156°W to 66°W | 75 | -156 | 87.01 | -66 |
| WGS_1984_EPSG_Arctic_Regional_zone_ A2 | 5922 | Arctic - 87°N to 75°N, 84°W to 6°E | 75 | -84 | 87.01 | 6.01 |
| WGS_1984_EPSG_Arctic_Regional_zone_ A3 | 5923 | Arctic - 87°N to 75°N, 12°W to 78°E | 75 | -12 | 87.01 | 78.01 |
| WGS_1984_EPSG_Arctic_Regional_zone_ A4 | 5924 | Arctic - 87°N to 75°N, 60°E to 150°E | 75 | 60 | 87.01 | 150.01 |
| WGS_1984_EPSG_Arctic_Regional_zone_ A5 | 5925 | Arctic - 87°N to 75°N, 132°E to 138°W | 75 | 132 | 87.01 | -138 |
| WGS_1984_EPSG_Arctic_Regional_zone_ B1 | 5926 | Arctic - 79°N to 67°N, 156°W to 66°W | 67 | -156 | 79.01 | -66 |
| WGS_1984_EPSG_Arctic_Regional_zone_ B2 | 5927 | Arctic - 79°N to 67°N, 84°W to 6°E | 67 | -84 | 79.01 | 6.01 |
| WGS_1984_EPSG_Arctic_Regional_zone_ B3 | 5928 | Arctic - 79°N to 67°N, 12°W to 78°E | 67 | -12 | 79.01 | 78.01 |
| WGS_1984_EPSG_Arctic_Regional_zone_ B4 | 5929 | Arctic - 79°N to 67°N, 60°E to 150°E | 67 | 60 | 79.01 | 150.01 |
| WGS_1984_EPSG_Arctic_Regional_zone_ B5 | 5930 | Arctic - 79°N to 67°N, 132°E to 138°W | 67 | 132 | 79.01 | -138 |
| WGS_1984_EPSG_Arctic_Regional_zone_ C1 | 5931 | Arctic - 71°N to 59°N, 156°W to 66°W | 59 | -156 | 71 | -66 |
| WGS_1984_EPSG_Arctic_Regional_zone_ C2 | 5932 | Arctic - 71°N to 59°N, 84°W to 6°E | 59 | -84 | 71 | 6 |
| WGS_1984_EPSG_Arctic_Regional_zone_ C3 | 5933 | Arctic - 71°N to 59°N, 12°W to 78°E | 59 | -12 | 71 | 78.01 |
| WGS_1984_EPSG_Arctic_Regional_zone_ C4 | 5934 | Arctic - 71°N to 59°N, 60°E to 150°E | 59 | 60 | 71 | 150.01 |
| WGS_1984_EPSG_Arctic_Regional_zone_ C5 | 5935 | Arctic - 71°N to 59°N, 132°E to 138°W | 59 | 132 | 71 | -138 |
| WGS_1984_EPSG_Arctic_zone_1-21 | 6118 | Arctic - 87°50'N to 82°50'N, 180°W to 120°W | 82.83 | -180 | 87.84 | -120 |
| WGS_1984_EPSG_Arctic_zone_1-27 | 6115 | Arctic - 87°50'N to 82°50'N, 0°E to 60°E | 82.83 | 0 | 87.84 | 60.01 |
| WGS_1984_EPSG_Arctic_zone_1-29 | 6116 | Arctic - 87°50'N to 82°50'N, 60°E to 120°E | 82.83 | 60 | 87.84 | 120.01 |
| WGS_1984_EPSG_Arctic_zone_1-31 | 6117 | Arctic - 87°50'N to 82°50'N, 120°E to 180°E | 82.83 | 120 | 87.83 | 180 |
| WGS_1984_EPSG_Arctic_zone_2-10 | 6120 | Arctic - 84°30'N to 79°30'N, 146°E to 174°W | 79.5 | 146 | 84.51 | -173.99 |
| WGS_1984_EPSG_Arctic_zone_2-12 | 6121 | Arctic - 84°30'N to 79°30'N, 174°W to 135°W | 79.5 | -174 | 84.51 | -134.99 |
| WGS_1984_EPSG_Arctic_zone_2-24 | 6075 | Arctic - 84°30'N to 79°30'N, 33°E to 73°E | 79.5 | 33 | 84.51 | 73.01 |
| WGS_1984_EPSG_Arctic_zone_2-26 | 6076 | Arctic - 84°30'N to 79°30'N, 73°E to 113°E | 79.5 | 73 | 84.51 | 113.01 |
| WGS_1984_EPSG_Arctic_zone_2-28 | 6119 | Arctic - 84°30'N to 79°30'N, 113°E to 153°E | 79.5 | 113 | 84.51 | 153.01 |
| WGS_1984_EPSG_Arctic_zone_3-13 | 6077 | Arctic - 81°10'N to 76°10'N, 35°E to 67°E | 76.16 | 34.99 | 81.17 | 67.01 |
| WGS_1984_EPSG_Arctic_zone_3-15 | 6078 | Arctic - 81°10'N to 76°10'N, 67°E to 98°E | 76.16 | 67 | 81.17 | 98.01 |
| WGS_1984_EPSG_Arctic_zone_3-17 | 6079 | Arctic - 81°10'N to 76°10'N, 98°E to 129°E | 76.16 | 98 | 81.17 | 129.01 |
| WGS_1984_EPSG_Arctic_zone_3-19 | 6080 | Arctic - 81°10'N to 76°10'N, 129°E to 160°E | 76.16 | 129 | 81.17 | 160.01 |
| WGS_1984_EPSG_Arctic_zone_3-21 | 6122 | Arctic - 81°10'N to 76°10'N, 160°E to 169°W | 76.16 | 160 | 81.17 | -168.99 |
| WGS_1984_EPSG_Arctic_zone_3-23 | 6123 | Arctic - 81°10'N to 76°10'N, 169°W to 138°W | 76.16 | -169 | 81.17 | -138 |
| WGS_1984_EPSG_Arctic_zone_4-12 | 6124 | Arctic - 77°50'N to 72°50'N, 169°W to 141°W | 72.83 | -169 | 77.84 | -141 |
| WGS_1984_EPSG_Arctic_zone_4-30 | 6081 | Arctic - 77°50'N to 72°50'N, 46°E to 70°E | 72.83 | 46 | 77.84 | 70.01 |
| WGS_1984_EPSG_Arctic_zone_4-32 | 6082 | Arctic - 77°50'N to 72°50'N, 70°E to 94°E | 72.83 | 70 | 77.84 | 94.01 |
| WGS_1984_EPSG_Arctic_zone_4-34 | 6083 | Arctic - 77°50'N to 72°50'N, 94°E to 118°E | 72.83 | 94 | 77.84 | 118.01 |
| WGS_1984_EPSG_Arctic_zone_4-36 | 6084 | Arctic - 77°50'N to 72°50'N, 118°E to 142°E | 72.83 | 118 | 77.84 | 142.01 |
| WGS_1984_EPSG_Arctic_zone_4-38 | 6085 | Arctic - 77°50'N to 72°50'N, 142°E to 166°E | 72.83 | 142 | 77.84 | 166.01 |
| WGS_1984_EPSG_Arctic_zone_4-40 | 6086 | Arctic - 77°50'N to 72°50'N, 166°E to 169°W | 72.83 | 166 | 77.84 | -168.99 |
| WGS_1984_EPSG_Arctic_zone_5-15 | 6087 | Arctic - 74°30'N to 69°30'N, 44°E to 64°E | 69.5 | 44 | 74.51 | 64.01 |
| WGS_1984_EPSG_Arctic_zone_5-17 | 6088 | Arctic - 74°30'N to 69°30'N, 64°E to 85°E | 69.5 | 64 | 74.51 | 85.01 |
| WGS_1984_EPSG_Arctic_zone_5-19 | 6089 | Arctic - 74°30'N to 69°30'N, 85°E to 106°E | 69.5 | 85 | 74.51 | 106.01 |
| WGS_1984_EPSG_Arctic_zone_5-21 | 6090 | Arctic - 74°30'N to 69°30'N, 106°E to 127°E | 69.5 | 106 | 74.51 | 127.01 |
| WGS_1984_EPSG_Arctic_zone_5-23 | 6091 | Arctic - 74°30'N to 69°30'N, 127°E to 148°E | 69.5 | 127 | 74.51 | 148 |
| WGS_1984_EPSG_Arctic_zone_5-25 | 6092 | Arctic - 74°30'N to 69°30'N, 148°E to 169°E | 69.5 | 148 | 74.51 | 169.01 |
| WGS_1984_EPSG_Arctic_zone_5-27 | 6093 | Arctic - 74°30'N to 69°30'N, 169°E to 169°W | 69.5 | 169 | 74.51 | -169 |
| WGS_1984_EPSG_Canada_Polar_ Stereographic | 5937 | World - N hemisphere - north of 60°N | 60 | -180 | 90 | 180 |
| WGS_1984_EPSG_Greenland_Polar_ Stereographic | 5938 | World - N hemisphere - north of 60°N | 60 | -180 | 90 | 180 |
| WGS_1984_EPSG_Norway_Polar_ Stereographic | 5939 | World - N hemisphere - north of 60°N | 60 | -180 | 90 | 180 |
| WGS_1984_EPSG_Russia_Polar_ Stereographic | 5940 | World - N hemisphere - north of 60°N | 60 | -180 | 90 | 180 |
| WGS_1984_Equal_Earth_Greenwich | 8857 | World | -90 | -180 | 90 | 180 |
| WGS_1984_Equal_Earth_Americas | 8858 | World | -90 | -180 | 90 | 180 |
| WGS_1984_Equal_Earth_Asia_Pacific | 8859 | World | -90 | -180 | 90 | 180 |
| WGS_1984_Goa | 7779 | India - Goa | 14.86 | 73.61 | 15.8 | 74.35 |
| WGS_1984_Gujarat | 7761 | India - Gujarat | 20.05 | 68.13 | 24.71 | 74.48 |
| WGS_1984_Haryana | 7762 | India - Haryana | 27.65 | 74.46 | 30.94 | 77.6 |
| WGS_1984_Himachal_Pradesh | 7763 | India - Himachal Pradesh | 30.38 | 75.57 | 33.26 | 79 |
| WGS_1984_IBCAO_Polar_Stereographic | 3996 | World - N hemisphere - north of 60°N | 60 | -180 | 90 | 180 |
| WGS_1984_India_Northeast | 7771 | India - northeast | 21.94 | 89.69 | 29.47 | 97.42 |
| WGS_1984_India_NSF_LCC | 7755 | India | 3.87 | 65.6 | 35.51 | 97.42 |
| WGS_1984_Jammu_and_Kashmir | 7764 | India - Jammu and Kashmir | 32.27 | 73.76 | 35.51 | 79.57 |
| WGS_1984_Jharkhand | 7765 | India - Jharkhand | 21.96 | 83.32 | 25.35 | 87.98 |
| WGS_1984_Karnataka | 7780 | India - Karnataka | 11.57 | 74 | 18.46 | 78.58 |
| WGS_1984_Kerala | 7781 | India - Kerala | 8.25 | 74.81 | 12.8 | 77.4 |
| WGS_1984_Lakshadweep | 7782 | India - Lakshadweep | 8.21 | 72.04 | 11.76 | 73.76 |
| WGS_1984_Madhya_Pradesh | 7766 | India - Madhya Pradesh | 21.07 | 74.03 | 26.88 | 82.81 |
| WGS_1984_Maharashtra | 7767 | India - Maharashtra | 15.6 | 72.6 | 22.04 | 80.9 |
| WGS_1984_Manipur | 7768 | India - Manipur | 23.84 | 92.97 | 25.7 | 94.76 |
| WGS_1984_Meghalaya | 7769 | India - Meghalaya | 25.03 | 89.82 | 26.12 | 92.81 |
| WGS_1984_Mercator_41 | 3994 | New Zealand - offshore Pacific Ocean, Southern Ocean | -60 | 155 | -25 | -170 |
| WGS_1984_Mizoram | 7783 | India - Mizoram | 21.94 | 92.25 | 24.53 | 93.45 |
| WGS_1984_Nagaland | 7770 | India - Nagaland | 25.2 | 93.33 | 27.05 | 95.25 |
| WGS_1984_NIWA_Albers | 9191 | New Zealand - offshore Pacific Ocean, Southern Ocean | -60 | 155 | -25 | -170 |
| WGS_1984_North_Pole_LAEA_Alaska | 3572 | World - north of 45°N | 45 | -180 | 90 | 180 |
| WGS_1984_North_Pole_LAEA_Atlantic | 3574 | World - north of 45°N | 45 | -180 | 90 | 180 |
| WGS_1984_North_Pole_LAEA_Bering_ Sea | 3571 | World - north of 45°N | 45 | -180 | 90 | 180 |
| WGS_1984_North_Pole_LAEA_Canada | 3573 | World - north of 45°N | 45 | -180 | 90 | 180 |
| WGS_1984_North_Pole_LAEA_Europe | 3575 | World - north of 45°N | 45 | -180 | 90 | 180 |
| WGS_1984_North_Pole_LAEA_Russia | 3576 | World - north of 45°N | 45 | -180 | 90 | 180 |
| WGS_1984_NSIDC_Sea_Ice_Polar_ Stereographic_North | 3413 | World - N hemisphere - north of 60°N | 60 | -180 | 90 | 180 |
| WGS_1984_NSIDC_Sea_Ice_Polar_ Stereographic_South | 3976 | World - S hemisphere - south of 60°S | -90 | -180 | -60 | 180 |
| WGS_1984_Orissa | 7772 | India - Odisha | 17.8 | 81.38 | 22.57 | 87.5 |
| WGS_1984_PDC_Mercator | 3832 | Pacific Ocean | -60 | 98.69 | 66.67 | -68 |
| WGS_1984_Peirce_quincuncial_North_ Pole_diamond | 54091 | World | -90 | -180 | 90 | 180 |
| WGS_1984_Peirce_quincuncial_North_ Pole_square | 54090 | World | -90 | -180 | 90 | 180 |
| WGS_1984_Plate_Carree | 32662 | World | -90 | -180 | 90 | 180 |
| WGS_1984_Punjab | 7773 | India - Punjab | 29.54 | 73.87 | 32.58 | 76.94 |
| WGS_1984_Rajasthan | 7774 | India - Rajasthan | 23.06 | 69.48 | 30.2 | 78.27 |
| WGS_1984_Sikkim | 7784 | India - Sikkim | 27.08 | 88.01 | 28.14 | 88.92 |
| WGS_1984_South_Georgia_Lambert | 3762 | South Georgia - onshore | -54.95 | -38.08 | -53.93 | -35.74 |
| WGS_1984_Spilhaus_Ocean_Map_in_ Square | 54099 | World | -90 | -180 | 90 | 180 |
| WGS_1984_Tamil_Nadu | 7785 | India - Tamil Nadu | 8.02 | 76.22 | 13.59 | 80.4 |
| WGS_1984_TM_116_SE | 2309 | Indonesia - Bali Sea west | -8.46 | 112.8 | -6.8 | 117.01 |
| WGS_1984_TM_12_SE | 5842 | Angola - offshore north of 8°S | -8.01 | 10.41 | -5.05 | 12.84 |
| WGS_1984_TM_132_SE | 2310 | Indonesia - West Papua - Tangguh | -2.94 | 131.89 | -1.97 | 133.82 |
| WGS_1984_TM_36_SE | 32766 | Mozambique - offshore | -27.71 | 32.64 | -10.09 | 43.03 |
| WGS_1984_TM_60_SW | 6703 | Falkland Islands - offshore 63°W to 57°W | -56.25 | -63.01 | -47.68 | -56.99 |
| WGS_1984_TM_6_NE | 2311 | Nigeria - offshore | 1.92 | 2.66 | 6.38 | 8.49 |
| WGS_1984_TM_Zone_20N_(US_Feet) | 8035 | Trinidad and Tobago - offshore west of 60°W | 9.83 | -62.09 | 12.34 | -59.99 |
| WGS_1984_TM_Zone_21N_(US_Feet) | 8036 | Trinidad and Tobago - offshore east of 60°W | 9.95 | -60 | 12.19 | -57.28 |
| WGS_1984_TMzn35N | 4037 | Moldova - west of 30°E | 45.44 | 26.63 | 48.47 | 30 |
| WGS_1984_TMzn36N | 4038 | Moldova - east of 30°E | 46.37 | 30 | 46.47 | 30.13 |
| WGS_1984_Tobler_Cylindrical_I | 54100 | World | -90 | -180 | 90 | 180 |
| WGS_1984_Tobler_Cylindrical_II | 54101 | World | -90 | -180 | 90 | 180 |
| WGS_1984_Tripura | 7786 | India - Tripura | 22.94 | 91.15 | 24.54 | 92.34 |
| WGS_1984_USGS_Transantarctic_ Mountains | 3294 | Antarctica - Transantarctic mountains north of 80°S | -80 | 149.83 | -68.6 | 174.01 |
| WGS_1984_UTM_Gabon_TM | 5223 | Gabon - onshore | -3.98 | 8.65 | 2.32 | 14.52 |
| WGS_1984_UTM_Gabon_TM_2011 | 5523 | Gabon | -6.37 | 7.03 | 2.32 | 14.52 |
| WGS_1984_UTM_Zone_10N | 32610 | World - N hemisphere - 126°W to 120°W - by country | 0 | -126 | 84 | -120 |
| WGS_1984_UTM_Zone_10S | 32710 | World - S hemisphere - 126°W to 120°W - by country | -80 | -126 | 0 | -120 |
| WGS_1984_UTM_Zone_11N | 32611 | World - N hemisphere - 120°W to 114°W - by country | 0 | -120 | 84 | -114 |
| WGS_1984_UTM_Zone_11S | 32711 | World - S hemisphere - 120°W to 114°W - by country | -80 | -120 | 0 | -114 |
| WGS_1984_UTM_Zone_12N | 32612 | World - N hemisphere - 114°W to 108°W - by country | 0 | -114 | 84 | -108 |
| WGS_1984_UTM_Zone_12S | 32712 | World - S hemisphere - 114°W to 108°W - by country | -80 | -114 | 0 | -108 |
| WGS_1984_UTM_Zone_13N | 32613 | World - N hemisphere - 108°W to 102°W - by country | 0 | -108 | 84 | -102 |
| WGS_1984_UTM_Zone_13S | 32713 | World - S hemisphere - 108°W to 102°W - by country | -80 | -108 | 0 | -102 |
| WGS_1984_UTM_Zone_14N | 32614 | World - N hemisphere - 102°W to 96°W - by country | 0 | -102 | 84 | -96 |
| WGS_1984_UTM_Zone_14S | 32714 | World - S hemisphere - 102°W to 96°W - by country | -80 | -102 | 0 | -96 |
| WGS_1984_UTM_Zone_15N | 32615 | World - N hemisphere - 96°W to 90°W - by country | 0 | -96 | 84 | -90 |
| WGS_1984_UTM_Zone_15S | 32715 | World - S hemisphere - 96°W to 90°W - by country | -80 | -96 | 0 | -90 |
| WGS_1984_UTM_Zone_16N | 32616 | World - N hemisphere - 90°W to 84°W - by country | 0 | -90 | 84 | -84 |
| WGS_1984_UTM_Zone_16S | 32716 | World - S hemisphere - 90°W to 84°W - by country | -80 | -90 | 0 | -84 |
| WGS_1984_UTM_Zone_17N | 32617 | World - N hemisphere - 84°W to 78°W - by country | 0 | -84 | 84 | -78 |
| WGS_1984_UTM_Zone_17S | 32717 | World - S hemisphere - 84°W to 78°W - by country | -80 | -84 | 0 | -78 |
| WGS_1984_UTM_Zone_18N | 32618 | World - N hemisphere - 78°W to 72°W - by country | 0 | -78 | 84 | -72 |
| WGS_1984_UTM_Zone_18S | 32718 | World - S hemisphere - 78°W to 72°W - by country | -80 | -78 | 0 | -72 |
| WGS_1984_UTM_Zone_19N | 32619 | World - N hemisphere - 72°W to 66°W - by country | 0 | -72 | 84 | -66 |
| WGS_1984_UTM_Zone_19S | 32719 | World - S hemisphere - 72°W to 66°W - by country | -80 | -72 | 0 | -66 |
| WGS_1984_UTM_Zone_1N | 32601 | World - N hemisphere - 180°W to 174°W - by country | 0 | -180 | 84 | -174 |
| WGS_1984_UTM_Zone_1S | 32701 | World - S hemisphere - 180°W to 174°W - by country | -80 | -180 | 0 | -174 |
| WGS_1984_UTM_Zone_20N | 32620 | World - N hemisphere - 66°W to 60°W - by country | 0 | -66 | 84 | -60 |
| WGS_1984_UTM_Zone_20S | 32720 | World - S hemisphere - 66°W to 60°W - by country | -80 | -66 | 0 | -60 |
| WGS_1984_UTM_Zone_21N | 32621 | World - N hemisphere - 60°W to 54°W - by country | 0 | -60 | 84 | -54 |
| WGS_1984_UTM_Zone_21S | 32721 | World - S hemisphere - 60°W to 54°W - by country | -80 | -60 | 0 | -54 |
| WGS_1984_UTM_Zone_22N | 32622 | World - N hemisphere - 54°W to 48°W - by country | 0 | -54 | 84 | -48 |
| WGS_1984_UTM_Zone_22S | 32722 | World - S hemisphere - 54°W to 48°W - by country | -80 | -54 | 0 | -48 |
| WGS_1984_UTM_Zone_23N | 32623 | World - N hemisphere - 48°W to 42°W - by country | 0 | -48 | 84 | -42 |
| WGS_1984_UTM_Zone_23S | 32723 | World - S hemisphere - 48°W to 42°W - by country | -80 | -48 | 0 | -42 |
| WGS_1984_UTM_Zone_24N | 32624 | World - N hemisphere - 42°W to 36°W - by country | 0 | -42 | 84 | -36 |
| WGS_1984_UTM_Zone_24S | 32724 | World - S hemisphere - 42°W to 36°W - by country | -80 | -42 | 0 | -36 |
| WGS_1984_UTM_Zone_25N | 32625 | World - N hemisphere - 36°W to 30°W - by country | 0 | -36 | 84 | -30 |
| WGS_1984_UTM_Zone_25S | 32725 | World - S hemisphere - 36°W to 30°W - by country | -80 | -36 | 0 | -30 |
| WGS_1984_UTM_Zone_26N | 32626 | World - N hemisphere - 30°W to 24°W - by country | 0 | -30 | 84 | -24 |
| WGS_1984_UTM_Zone_26S | 32726 | World - S hemisphere - 30°W to 24°W - by country | -80 | -30 | 0 | -24 |
| WGS_1984_UTM_Zone_27N | 32627 | World - N hemisphere - 24°W to 18°W - by country | 0 | -24 | 84 | -18 |
| WGS_1984_UTM_Zone_27S | 32727 | World - S hemisphere - 24°W to 18°W - by country | -80 | -24 | 0 | -18 |
| WGS_1984_UTM_Zone_28N | 32628 | World - N hemisphere - 18°W to 12°W - by country | 0 | -18 | 84 | -12 |
| WGS_1984_UTM_Zone_28S | 32728 | World - S hemisphere - 18°W to 12°W - by country | -80 | -18 | 0 | -12 |
| WGS_1984_UTM_Zone_29N | 32629 | World - N hemisphere - 12°W to 6°W - by country | 0 | -12 | 84 | -6 |
| WGS_1984_UTM_Zone_29S | 32729 | World - S hemisphere - 12°W to 6°W - by country | -80 | -12 | 0 | -6 |
| WGS_1984_UTM_Zone_2N | 32602 | World - N hemisphere - 174°W to 168°W - by country | 0 | -174 | 84 | -168 |
| WGS_1984_UTM_Zone_2S | 32702 | World - S hemisphere - 174°W to 168°W - by country | -80 | -174 | 0 | -168 |
| WGS_1984_UTM_Zone_30N | 32630 | World - N hemisphere - 6°W to 0°W - by country | 0 | -6 | 84 | 0 |
| WGS_1984_UTM_Zone_30S | 32730 | World - S hemisphere - 6°W to 0°W - by country | -80 | -6 | 0 | 0 |
| WGS_1984_UTM_Zone_31N | 32631 | World - N hemisphere - 0°E to 6°E - by country | 0 | 0 | 84 | 6 |
| WGS_1984_UTM_Zone_31S | 32731 | World - S hemisphere - 0°E to 6°E - by country | -80 | 0 | 0 | 6 |
| WGS_1984_UTM_Zone_32N | 32632 | World - N hemisphere - 6°E to 12°E - by country | 0 | 6 | 84 | 12 |
| WGS_1984_UTM_Zone_32S | 32732 | World - S hemisphere - 6°E to 12°E - by country | -80 | 6 | 0 | 12 |
| WGS_1984_UTM_Zone_33N | 32633 | World - N hemisphere - 12°E to 18°E - by country | 0 | 12 | 84 | 18 |
| WGS_1984_UTM_Zone_33S | 32733 | World - S hemisphere - 12°E to 18°E - by country | -80 | 12 | 0 | 18 |
| WGS_1984_UTM_Zone_34N | 32634 | World - N hemisphere - 18°E to 24°E - by country | 0 | 18 | 84 | 24 |
| WGS_1984_UTM_Zone_34S | 32734 | World - S hemisphere - 18°E to 24°E - by country | -80 | 18 | 0 | 24 |
| WGS_1984_UTM_Zone_35N | 32635 | World - N hemisphere - 24°E to 30°E - by country | 0 | 24 | 84 | 30 |
| WGS_1984_UTM_Zone_35S | 32735 | World - S hemisphere - 24°E to 30°E - by country | -80 | 24 | 0 | 30 |
| WGS_1984_UTM_Zone_36N | 32636 | World - N hemisphere - 30°E to 36°E - by country | 0 | 30 | 84 | 36 |
| WGS_1984_UTM_Zone_36S | 32736 | World - S hemisphere - 30°E to 36°E - by country | -80 | 30 | 0 | 36 |
| WGS_1984_UTM_Zone_37N | 32637 | World - N hemisphere - 36°E to 42°E - by country | 0 | 36 | 84 | 42 |
| WGS_1984_UTM_Zone_37S | 32737 | World - S hemisphere - 36°E to 42°E - by country | -80 | 36 | 0 | 42 |
| WGS_1984_UTM_Zone_38N | 32638 | World - N hemisphere - 42°E to 48°E - by country | 0 | 42 | 84 | 48 |
| WGS_1984_UTM_Zone_38S | 32738 | World - S hemisphere - 42°E to 48°E - by country | -80 | 42 | 0 | 48 |
| WGS_1984_UTM_Zone_39N | 32639 | World - N hemisphere - 48°E to 54°E - by country | 0 | 48 | 84 | 54 |
| WGS_1984_UTM_Zone_39S | 32739 | World - S hemisphere - 48°E to 54°E - by country | -80 | 48 | 0 | 54 |
| WGS_1984_UTM_Zone_3N | 32603 | World - N hemisphere - 168°W to 162°W - by country | 0 | -168 | 84 | -162 |
| WGS_1984_UTM_Zone_3S | 32703 | World - S hemisphere - 168°W to 162°W - by country | -80 | -168 | 0 | -162 |
| WGS_1984_UTM_Zone_40N | 32640 | World - N hemisphere - 54°E to 60°E - by country | 0 | 54 | 84 | 60 |
| WGS_1984_UTM_Zone_40S | 32740 | World - S hemisphere - 54°E to 60°E - by country | -80 | 54 | 0 | 60 |
| WGS_1984_UTM_Zone_41N | 32641 | World - N hemisphere - 60°E to 66°E - by country | 0 | 60 | 84 | 66 |
| WGS_1984_UTM_Zone_41S | 32741 | World - S hemisphere - 60°E to 66°E - by country | -80 | 60 | 0 | 66 |
| WGS_1984_UTM_Zone_42N | 32642 | World - N hemisphere - 66°E to 72°E - by country | 0 | 66 | 84 | 72 |
| WGS_1984_UTM_Zone_42S | 32742 | World - S hemisphere - 66°E to 72°E - by country | -80 | 66 | 0 | 72 |
| WGS_1984_UTM_Zone_43N | 32643 | World - N hemisphere - 72°E to 78°E - by country | 0 | 72 | 84 | 78 |
| WGS_1984_UTM_Zone_43S | 32743 | World - S hemisphere - 72°E to 78°E - by country | -80 | 72 | 0 | 78 |
| WGS_1984_UTM_Zone_44N | 32644 | World - N hemisphere - 78°E to 84°E - by country | 0 | 78 | 84 | 84 |
| WGS_1984_UTM_Zone_44S | 32744 | World - S hemisphere - 78°E to 84°E - by country | -80 | 78 | 0 | 84 |
| WGS_1984_UTM_Zone_45N | 32645 | World - N hemisphere - 84°E to 90°E - by country | 0 | 84 | 84 | 90 |
| WGS_1984_UTM_Zone_45S | 32745 | World - S hemisphere - 84°E to 90°E - by country | -80 | 84 | 0 | 90 |
| WGS_1984_UTM_Zone_46N | 32646 | World - N hemisphere - 90°E to 96°E - by country | 0 | 90 | 84 | 96 |
| WGS_1984_UTM_Zone_46S | 32746 | World - S hemisphere - 90°E to 96°E - by country | -80 | 90 | 0 | 96 |
| WGS_1984_UTM_Zone_47N | 32647 | World - N hemisphere - 96°E to 102°E - by country | 0 | 96 | 84 | 102 |
| WGS_1984_UTM_Zone_47S | 32747 | World - S hemisphere - 96°E to 102°E - by country | -80 | 96 | 0 | 102 |
| WGS_1984_UTM_Zone_48N | 32648 | World - N hemisphere - 102°E to 108°E - by country | 0 | 102 | 84 | 108 |
| WGS_1984_UTM_Zone_48S | 32748 | World - S hemisphere - 102°E to 108°E - by country | -80 | 102 | 0 | 108 |
| WGS_1984_UTM_Zone_49N | 32649 | World - N hemisphere - 108°E to 114°E - by country | 0 | 108 | 84 | 114 |
| WGS_1984_UTM_Zone_49S | 32749 | World - S hemisphere - 108°E to 114°E - by country | -80 | 108 | 0 | 114 |
| WGS_1984_UTM_Zone_4N | 32604 | World - N hemisphere - 162°W to 156°W - by country | 0 | -162 | 84 | -156 |
| WGS_1984_UTM_Zone_4S | 32704 | World - S hemisphere - 162°W to 156°W - by country | -80 | -162 | 0 | -156 |
| WGS_1984_UTM_Zone_50N | 32650 | World - N hemisphere - 114°E to 120°E - by country | 0 | 114 | 84 | 120 |
| WGS_1984_UTM_Zone_50S | 32750 | World - S hemisphere - 114°E to 120°E - by country | -80 | 114 | 0 | 120 |
| WGS_1984_UTM_Zone_51N | 32651 | World - N hemisphere - 120°E to 126°E - by country | 0 | 120 | 84 | 126 |
| WGS_1984_UTM_Zone_51S | 32751 | World - S hemisphere - 120°E to 126°E - by country | -80 | 120 | 0 | 126 |
| WGS_1984_UTM_Zone_52N | 32652 | World - N hemisphere - 126°E to 132°E - by country | 0 | 126 | 84 | 132 |
| WGS_1984_UTM_Zone_52S | 32752 | World - S hemisphere - 126°E to 132°E - by country | -80 | 126 | 0 | 132 |
| WGS_1984_UTM_Zone_53N | 32653 | World - N hemisphere - 132°E to 138°E - by country | 0 | 132 | 84 | 138 |
| WGS_1984_UTM_Zone_53S | 32753 | World - S hemisphere - 132°E to 138°E - by country | -80 | 132 | 0 | 138 |
| WGS_1984_UTM_Zone_54N | 32654 | World - N hemisphere - 138°E to 144°E - by country | 0 | 138 | 84 | 144 |
| WGS_1984_UTM_Zone_54S | 32754 | World - S hemisphere - 138°E to 144°E - by country | -80 | 138 | 0 | 144 |
| WGS_1984_UTM_Zone_55N | 32655 | World - N hemisphere - 144°E to 150°E - by country | 0 | 144 | 84 | 150 |
| WGS_1984_UTM_Zone_55S | 32755 | World - S hemisphere - 144°E to 150°E - by country | -80 | 144 | 0 | 150 |
| WGS_1984_UTM_Zone_56N | 32656 | World - N hemisphere - 150°E to 156°E - by country | 0 | 150 | 84 | 156 |
| WGS_1984_UTM_Zone_56S | 32756 | World - S hemisphere - 150°E to 156°E - by country | -80 | 150 | 0 | 156 |
| WGS_1984_UTM_Zone_57N | 32657 | World - N hemisphere - 156°E to 162°E - by country | 0 | 156 | 84 | 162 |
| WGS_1984_UTM_Zone_57S | 32757 | World - S hemisphere - 156°E to 162°E - by country | -80 | 156 | 0 | 162 |
| WGS_1984_UTM_Zone_58N | 32658 | World - N hemisphere - 162°E to 168°E - by country | 0 | 162 | 84 | 168 |
| WGS_1984_UTM_Zone_58S | 32758 | World - S hemisphere - 162°E to 168°E - by country | -80 | 162 | 0 | 168 |
| WGS_1984_UTM_Zone_59N | 32659 | World - N hemisphere - 168°E to 174°E - by country | 0 | 168 | 84 | 174 |
| WGS_1984_UTM_Zone_59S | 32759 | World - S hemisphere - 168°E to 174°E - by country | -80 | 168 | 0 | 174 |
| WGS_1984_UTM_Zone_5N | 32605 | World - N hemisphere - 156°W to 150°W - by country | 0 | -156 | 84 | -150 |
| WGS_1984_UTM_Zone_5S | 32705 | World - S hemisphere - 156°W to 150°W - by country | -80 | -156 | 0 | -150 |
| WGS_1984_UTM_Zone_60N | 32660 | World - N hemisphere - 174°E to 180°E - by country | 0 | 174 | 84 | 180 |
| WGS_1984_UTM_Zone_60S | 32760 | World - S hemisphere - 174°E to 180°E - by country | -80 | 174 | 0 | 180 |
| WGS_1984_UTM_Zone_6N | 32606 | World - N hemisphere - 150°W to 144°W - by country | 0 | -150 | 84 | -144 |
| WGS_1984_UTM_Zone_6S | 32706 | World - S hemisphere - 150°W to 144°W - by country | -80 | -150 | 0 | -144 |
| WGS_1984_UTM_Zone_7N | 32607 | World - N hemisphere - 144°W to 138°W - by country | 0 | -144 | 84 | -138 |
| WGS_1984_UTM_Zone_7S | 32707 | World - S hemisphere - 144°W to 138°W - by country | -80 | -144 | 0 | -138 |
| WGS_1984_UTM_Zone_8N | 32608 | World - N hemisphere - 138°W to 132°W - by country | 0 | -138 | 84 | -132 |
| WGS_1984_UTM_Zone_8S | 32708 | World - S hemisphere - 138°W to 132°W - by country | -80 | -138 | 0 | -132 |
| WGS_1984_UTM_Zone_9N | 32609 | World - N hemisphere - 132°W to 126°W - by country | 0 | -132 | 84 | -126 |
| WGS_1984_UTM_Zone_9S | 32709 | World - S hemisphere - 132°W to 126°W - by country | -80 | -132 | 0 | -126 |
| WGS_1984_Uttaranchal | 7776 | India - Uttarakhand | 28.71 | 77.56 | 31.48 | 81.02 |
| WGS_1984_Uttar_Pradesh | 7775 | India - Uttar Pradesh | 23.87 | 77.08 | 30.42 | 84.64 |
| WGS_1984_World_Equidistant_ Cylindrical | 4087 | World | -90 | -180 | 90 | 180 |
| WGS_1984_Web_Mercator_Auxiliary_ Sphere | 3857 | World - 85°S to 85°N | -85.06 | -180 | 85.06 | 180 |
| WGS_1984_West_Bengal | 7787 | India - West Bengal | 21.49 | 85.82 | 27.23 | 89.88 |
| WGS_1984_World_Mercator | 3395 | World - between 80°S and 84°N | -80 | -180 | 84 | 180 |
| World_Aitoff | 54043 | World | -90 | -180 | 90 | 180 |
| World_Azimuthal_Equidistant | 54032 | World | -90 | -180 | 90 | 180 |
| World_Behrmann | 54017 | World | -90 | -180 | 90 | 180 |
| World_Bonne | 54024 | World | -90 | -180 | 90 | 180 |
| World_Cassini | 54028 | World | -90 | -180 | 90 | 180 |
| World_Compact_Miller | 54080 | World | -90 | -180 | 90 | 180 |
| World_Craster_Parabolic | 54046 | World | -90 | -180 | 90 | 180 |
| World_Cube | 54051 | World | -90 | -180 | 90 | 180 |
| World_Cylindrical_Equal_Area | 54034 | World | -90 | -180 | 90 | 180 |
| World_Eckert_I | 54015 | World | -90 | -180 | 90 | 180 |
| World_Eckert_II | 54014 | World | -90 | -180 | 90 | 180 |
| World_Eckert_III | 54013 | World | -90 | -180 | 90 | 180 |
| World_Eckert_IV | 54012 | World | -90 | -180 | 90 | 180 |
| World_Eckert_V | 54011 | World | -90 | -180 | 90 | 180 |
| World_Eckert_VI | 54010 | World | -90 | -180 | 90 | 180 |
| WGS_1984_Equal_Earth_Greenwich | 8857 | World | -90 | -180 | 90 | 180 |
| WGS_1984_Equal_Earth_Americas | 8858 | World | -90 | -180 | 90 | 180 |
| WGS_1984_Equal_Earth_Asia_Pacific | 8859 | World | -90 | -180 | 90 | 180 |
| World_Equidistant_Conic | 54027 | World | -90 | -180 | 90 | 180 |
| World_Equidistant_Cylindrical | 54002 | World | -90 | -180 | 90 | 180 |
| World_Equidistant_Cylindrical_(Sphere) | 4088 | World | -90 | -180 | 90 | 180 |
| World_Flat_Polar_Quartic | 54045 | World | -90 | -180 | 90 | 180 |
| World_Fuller | 54050 | World | -90 | -180 | 90 | 180 |
| World_Gall_Stereographic | 54016 | World | -90 | -180 | 90 | 180 |
| World_Goode_Homolosine_Land | 54052 | World | -90 | -180 | 90 | 180 |
| World_Goode_Homolosine_Ocean | 54053 | World | -90 | -180 | 90 | 180 |
| World_Hammer_Aitoff | 54044 | World | -90 | -180 | 90 | 180 |
| World_Hotine | 54025 | World | -90 | -180 | 90 | 180 |
| World_Loximuthal | 54023 | World | -90 | -180 | 90 | 180 |
| World_Mercator | 54004 | World | -90 | -180 | 90 | 180 |
| World_Miller_Cylindrical | 54003 | World | -90 | -180 | 90 | 180 |
| World_Mollweide | 54009 | World | -90 | -180 | 90 | 180 |
| World_Natural_Earth | 54077 | World | -90 | -180 | 90 | 180 |
| World_Natural_Earth_II | 54078 | World | -90 | -180 | 90 | 180 |
| World_Patterson | 54079 | World | -90 | -180 | 90 | 180 |
| World_Plate_Carree | 54001 | World | -90 | -180 | 90 | 180 |
| World_Polyconic | 54021 | World | -90 | -180 | 90 | 180 |
| World_Quartic_Authalic | 54022 | World | -90 | -180 | 90 | 180 |
| World_Robinson | 54030 | World | -90 | -180 | 90 | 180 |
| World_Sinusoidal | 54008 | World | -90 | -180 | 90 | 180 |
| World_Stereographic | 54026 | World | -90 | -180 | 90 | 180 |
| World_Times | 54048 | World | -90 | -180 | 90 | 180 |
| World_Two_Point_Equidistant | 54031 | World | -90 | -180 | 90 | 180 |
| World_Van_der_Grinten_I | 54029 | World | -90 | -180 | 90 | 180 |
| World_Vertical_Perspective | 54049 | World | -90 | -180 | 90 | 180 |
| World_Wagner_IV | 54074 | World | -90 | -180 | 90 | 180 |
| World_Wagner_V | 54075 | World | -90 | -180 | 90 | 180 |
| World_Wagner_VII | 54076 | World | -90 | -180 | 90 | 180 |
| World_Winkel_I | 54018 | World | -90 | -180 | 90 | 180 |
| World_Winkel_II | 54019 | World | -90 | -180 | 90 | 180 |
| World_Winkel_Tripel_NGS | 54042 | World | -90 | -180 | 90 | 180 |
| Xian_1980_3_Degree_GK_CM_102E | 2379 | China - 100.5°E to 103.5°E | 21.13 | 100.5 | 42.69 | 103.5 |
| Xian_1980_3_Degree_GK_CM_105E | 2380 | China - 103.5°E to 106.5°E | 22.5 | 103.5 | 42.21 | 106.51 |
| Xian_1980_3_Degree_GK_CM_108E | 2381 | China - 106.5°E to 109.5°E onshore | 18.19 | 106.5 | 42.47 | 109.51 |
| Xian_1980_3_Degree_GK_CM_111E | 2382 | China - 109.5°E to 112.5°E onshore | 18.11 | 109.5 | 45.11 | 112.5 |
| Xian_1980_3_Degree_GK_CM_114E | 2383 | China - 112.5°E to 115.5°E onshore | 21.52 | 112.5 | 45.45 | 115.5 |
| Xian_1980_3_Degree_GK_CM_117E | 2384 | China - 115.5°E to 118.5°E onshore | 22.6 | 115.5 | 49.88 | 118.5 |
| Xian_1980_3_Degree_GK_CM_120E | 2385 | China - 118.5°E to 121.5°E onshore | 24.43 | 118.5 | 53.33 | 121.5 |
| Xian_1980_3_Degree_GK_CM_123E | 2386 | China - 121.5°E to 124.5°E onshore | 28.22 | 121.5 | 53.56 | 124.5 |
| Xian_1980_3_Degree_GK_CM_126E | 2387 | China - 124.5°E to 127.5°E onshore | 40.19 | 124.5 | 53.2 | 127.5 |
| Xian_1980_3_Degree_GK_CM_129E | 2388 | China - 127.5°E to 130.5°E | 41.37 | 127.5 | 50.25 | 130.5 |
| Xian_1980_3_Degree_GK_CM_132E | 2389 | China - 130.5°E to 133.5°E | 42.42 | 130.5 | 48.88 | 133.5 |
| Xian_1980_3_Degree_GK_CM_135E | 2390 | China - east of 133.5°E | 45.85 | 133.5 | 48.4 | 134.77 |
| Xian_1980_3_Degree_GK_CM_75E | 2370 | China - west of 76.5°E | 35.81 | 73.62 | 40.65 | 76.5 |
| Xian_1980_3_Degree_GK_CM_78E | 2371 | China - 76.5°E to 79.5°E | 31.03 | 76.5 | 41.83 | 79.5 |
| Xian_1980_3_Degree_GK_CM_81E | 2372 | China - 79.5°E to 82.5°E | 29.95 | 79.5 | 45.88 | 82.51 |
| Xian_1980_3_Degree_GK_CM_84E | 2373 | China - 82.5°E to 85.5°E | 28.26 | 82.5 | 47.23 | 85.5 |
| Xian_1980_3_Degree_GK_CM_87E | 2374 | China - 85.5°E to 88.5°E | 27.8 | 85.5 | 49.18 | 88.5 |
| Xian_1980_3_Degree_GK_CM_90E | 2375 | China - 88.5°E to 91.5°E | 27.32 | 88.49 | 48.42 | 91.51 |
| Xian_1980_3_Degree_GK_CM_93E | 2376 | China - 91.5°E to 94.5°E | 27.71 | 91.5 | 45.13 | 94.5 |
| Xian_1980_3_Degree_GK_CM_96E | 2377 | China - 94.5°E to 97.5°E | 28.23 | 94.5 | 44.5 | 97.51 |
| Xian_1980_3_Degree_GK_CM_99E | 2378 | China - 97.5°E to 100.5°E | 21.43 | 97.5 | 42.76 | 100.5 |
| Xian_1980_3_Degree_GK_Zone_25 | 2349 | China - west of 76.5°E | 35.81 | 73.62 | 40.65 | 76.5 |
| Xian_1980_3_Degree_GK_Zone_26 | 2350 | China - 76.5°E to 79.5°E | 31.03 | 76.5 | 41.83 | 79.5 |
| Xian_1980_3_Degree_GK_Zone_27 | 2351 | China - 79.5°E to 82.5°E | 29.95 | 79.5 | 45.88 | 82.51 |
| Xian_1980_3_Degree_GK_Zone_28 | 2352 | China - 82.5°E to 85.5°E | 28.26 | 82.5 | 47.23 | 85.5 |
| Xian_1980_3_Degree_GK_Zone_29 | 2353 | China - 85.5°E to 88.5°E | 27.8 | 85.5 | 49.18 | 88.5 |
| Xian_1980_3_Degree_GK_Zone_30 | 2354 | China - 88.5°E to 91.5°E | 27.32 | 88.49 | 48.42 | 91.51 |
| Xian_1980_3_Degree_GK_Zone_31 | 2355 | China - 91.5°E to 94.5°E | 27.71 | 91.5 | 45.13 | 94.5 |
| Xian_1980_3_Degree_GK_Zone_32 | 2356 | China - 94.5°E to 97.5°E | 28.23 | 94.5 | 44.5 | 97.51 |
| Xian_1980_3_Degree_GK_Zone_33 | 2357 | China - 97.5°E to 100.5°E | 21.43 | 97.5 | 42.76 | 100.5 |
| Xian_1980_3_Degree_GK_Zone_34 | 2358 | China - 100.5°E to 103.5°E | 21.13 | 100.5 | 42.69 | 103.5 |
| Xian_1980_3_Degree_GK_Zone_35 | 2359 | China - 103.5°E to 106.5°E | 22.5 | 103.5 | 42.21 | 106.51 |
| Xian_1980_3_Degree_GK_Zone_36 | 2360 | China - 106.5°E to 109.5°E onshore | 18.19 | 106.5 | 42.47 | 109.51 |
| Xian_1980_3_Degree_GK_Zone_37 | 2361 | China - 109.5°E to 112.5°E onshore | 18.11 | 109.5 | 45.11 | 112.5 |
| Xian_1980_3_Degree_GK_Zone_38 | 2362 | China - 112.5°E to 115.5°E onshore | 21.52 | 112.5 | 45.45 | 115.5 |
| Xian_1980_3_Degree_GK_Zone_39 | 2363 | China - 115.5°E to 118.5°E onshore | 22.6 | 115.5 | 49.88 | 118.5 |
| Xian_1980_3_Degree_GK_Zone_40 | 2364 | China - 118.5°E to 121.5°E onshore | 24.43 | 118.5 | 53.33 | 121.5 |
| Xian_1980_3_Degree_GK_Zone_41 | 2365 | China - 121.5°E to 124.5°E onshore | 28.22 | 121.5 | 53.56 | 124.5 |
| Xian_1980_3_Degree_GK_Zone_42 | 2366 | China - 124.5°E to 127.5°E onshore | 40.19 | 124.5 | 53.2 | 127.5 |
| Xian_1980_3_Degree_GK_Zone_43 | 2367 | China - 127.5°E to 130.5°E | 41.37 | 127.5 | 50.25 | 130.5 |
| Xian_1980_3_Degree_GK_Zone_44 | 2368 | China - 130.5°E to 133.5°E | 42.42 | 130.5 | 48.88 | 133.5 |
| Xian_1980_3_Degree_GK_Zone_45 | 2369 | China - east of 133.5°E | 45.85 | 133.5 | 48.4 | 134.77 |
| Xian_1980_GK_CM_105E | 2343 | China - 102°E to 108°E onshore | 21.53 | 102 | 42.47 | 108 |
| Xian_1980_GK_CM_111E | 2344 | China - 108°E to 114°E onshore | 18.11 | 108 | 45.11 | 114 |
| Xian_1980_GK_CM_117E | 2345 | China - 114°E to 120°E onshore | 22.14 | 114 | 51.52 | 120 |
| Xian_1980_GK_CM_123E | 2346 | China - 120°E to 126°E onshore | 26.34 | 120 | 53.56 | 126 |
| Xian_1980_GK_CM_129E | 2347 | China - 126°E to 132°E onshore | 40.89 | 126 | 52.79 | 132 |
| Xian_1980_GK_CM_135E | 2348 | China - east of 132°E | 45.02 | 132 | 48.4 | 134.77 |
| Xian_1980_GK_CM_75E | 2338 | China - west of 78°E | 35.42 | 73.62 | 41.07 | 78.01 |
| Xian_1980_GK_CM_81E | 2339 | China - 78°E to 84°E | 29.16 | 77.98 | 47.23 | 84 |
| Xian_1980_GK_CM_87E | 2340 | China - 84°E to 90°E | 27.32 | 84 | 49.18 | 90 |
| Xian_1980_GK_CM_93E | 2341 | China - 90°E to 96°E | 27.71 | 90 | 47.9 | 96.01 |
| Xian_1980_GK_CM_99E | 2342 | China - 96°E to 102°E | 21.13 | 96 | 43.18 | 102.01 |
| Xian_1980_GK_Zone_13 | 2327 | China - west of 78°E | 35.42 | 73.62 | 41.07 | 78.01 |
| Xian_1980_GK_Zone_14 | 2328 | China - 78°E to 84°E | 29.16 | 77.98 | 47.23 | 84 |
| Xian_1980_GK_Zone_15 | 2329 | China - 84°E to 90°E | 27.32 | 84 | 49.18 | 90 |
| Xian_1980_GK_Zone_16 | 2330 | China - 90°E to 96°E | 27.71 | 90 | 47.9 | 96.01 |
| Xian_1980_GK_Zone_17 | 2331 | China - 96°E to 102°E | 21.13 | 96 | 43.18 | 102.01 |
| Xian_1980_GK_Zone_18 | 2332 | China - 102°E to 108°E onshore | 21.53 | 102 | 42.47 | 108 |
| Xian_1980_GK_Zone_19 | 2333 | China - 108°E to 114°E onshore | 18.11 | 108 | 45.11 | 114 |
| Xian_1980_GK_Zone_20 | 2334 | China - 114°E to 120°E onshore | 22.14 | 114 | 51.52 | 120 |
| Xian_1980_GK_Zone_21 | 2335 | China - 120°E to 126°E onshore | 26.34 | 120 | 53.56 | 126 |
| Xian_1980_GK_Zone_22 | 2336 | China - 126°E to 132°E onshore | 40.89 | 126 | 52.79 | 132 |
| Xian_1980_GK_Zone_23 | 2337 | China - east of 132°E | 45.02 | 132 | 48.4 | 134.77 |
| Yemen_NGN_1996_UTM_Zone_37N | 5836 | Yemen - west of 42°E | 14.73 | 41.08 | 16.36 | 42 |
| Yemen_NGN_1996_UTM_Zone_38N | 2089 | Yemen - 42°E to 48°E | 11.57 | 42 | 17.95 | 48.01 |
| Yemen_NGN_1996_UTM_Zone_39N | 2090 | Yemen - 48°E to 54°E | 9.45 | 48 | 19 | 54.01 |
| Yemen_NGN_1996_UTM_Zone_40N | 5837 | Yemen - east of 54°E | 8.95 | 54 | 14.95 | 57.96 |
| Yoff_1972_UTM_Zone_28N | 31028 | Senegal | 10.64 | -20.22 | 16.7 | -11.36 |
| Zanderij_1972_UTM_Zone_21N | 31121 | Suriname | 1.83 | -58.08 | 9.35 | -52.66 |
| Zanderij_Suriname_Old_TM | 31170 | Suriname - onshore | 1.83 | -58.08 | 6.06 | -53.95 |
| Zanderij_Suriname_TM | 31171 | Suriname - onshore | 1.83 | -58.08 | 6.06 | -53.95 |
| Zanderij_TM_54_NW | 31154 | Suriname - offshore | 5.34 | -57.25 | 9.35 | -52.66 |