Data models, or establishing and using a defined method of data organization, are one of the most important factors when working with GIS and are often overlooked in introductory classes. In GIS, the term data model can refer to both spatial data models, which define how geographic features are represented (vector, raster, and data tables), and organizational data models, which govern how data is structured, stored, and managed within a system. When you take a job with a company or the government, they will have required methods of file nomenclature—rules about properly naming files and folders to fit within a pre-determined organizational data model—as well as standards for structuring and managing spatial and non-spatial data to ensure consistency, efficiency, and accessibility.
A spatial data model focuses on how geographic features are represented, such as using vector models for discrete features (points, lines, and polygons), raster models for continuous surfaces, and data tables for storing non-spatial attributes. These models define how GIS software interprets and processes spatial data. However, a well-designed organizational data model is equally crucial, ensuring that spatial and non-spatial data interact seamlessly, are stored efficiently, and can be accessed and analyzed without confusion. It includes rules for data relationships, metadata management, version control, and security—helping organizations maintain data integrity and usability over time.
When working in GIS, understanding both types of data models is essential. The spatial data model determines how the data is structured for analysis, while the organizational data model ensures that the data remains well-managed and accessible. Organizations rely on these models to streamline workflows, prevent data loss or duplication, and ensure that GIS data integrates properly with other systems. Learning to use structured file nomenclature and applying both spatial and organizational data models early in your GIS journey will help you develop strong habits that will benefit you throughout your career.
4.2.2: Methods of Data Organization
While there are possibly endless ways to name and organize files and folders in GIS Geographic Information Systems the software used to create, store, and manage spatial data Data that deals with location, such as lists of addresses, the footprint of a building, the boundaries of cities and counties, etc. , analyze spatial problems, and display the data in cartographic layouts Geographic Information Sciences , when you start your first GIS Geographic Information Systems the software used to create, store, and manage spatial data Data that deals with location, such as lists of addresses, the footprint of a building, the boundaries of cities and counties, etc. , analyze spatial problems, and display the data in cartographic layouts Geographic Information Sciences analyst job, there will almost always be some basic structure in place, as defined by the company or agency for whom you are employed. Using a top-down structure, most GIS Geographic Information Systems the software used to create, store, and manage spatial data Data that deals with location, such as lists of addresses, the footprint of a building, the boundaries of cities and counties, etc. , analyze spatial problems, and display the data in cartographic layouts Geographic Information Sciences shops will use a data model based on cascading folders, with the name of the largest unit of measure at the top and working down to the smallest. For example, some GIS Geographic Information Systems the software used to create, store, and manage spatial data Data that deals with location, such as lists of addresses, the footprint of a building, the boundaries of cities and counties, etc. , analyze spatial problems, and display the data in cartographic layouts Geographic Information Sciences shops may use a model of time, where the highest level of folders will be years, and each of those years will contain 12-months of folders (January - December or July - June, depending on if you work for an agency which goes by the calendar year or the federal fiscal year). Within each month folder, there will be project names, and within each project name folder, there will be some sort of storage folder structure, for example, Data, Working Folder, and Maps. Other GIS Geographic Information Systems the software used to create, store, and manage spatial data Data that deals with location, such as lists of addresses, the footprint of a building, the boundaries of cities and counties, etc. , analyze spatial problems, and display the data in cartographic layouts Geographic Information Sciences shops might use a structure of project names as the highest folder in the structure, others may use administrative boundaries, such as counties or management units, and still others may use contract names or numbers. Sub-folders may be broken down by time, coordinate system, or manager, just to name a few. The system used by the company or agency you work for will be determined as the best-fit model for their day-to-day operations.
Using data models as described by each agency or company creates a timeless system of data organization, where a person from any department can access data at any time (given they have a basic understanding of the defined model) without much trouble. Along with documentation (stored in the Output Maps and Documentation folder) and some understanding of the overall goals of a project, someone should be able to follow you into a project and not spend hours and hours of time just trying to figure out what is what and how you did what you did because you followed some willy-nilly data model or project specific nomenclature.
For this class, we too, will follow a top-down structure with our class as the highest level and the results of our tools as the lowest. We will practice a method where we keep the original data in a separate folder from the data we create from scratch or by running tools, which protects the original data from damage or being overwritten. We will also practice a method of storing all of our MXD files (ArcMap document files) in one folder and our output maps and lab documentation in another. This clearly labeled folder structure allows for you to find what you need without searching endlessly through "New Folder" and "New Folder(2)", not just right after lab material is due, but in six months when you want to look back on your materials and methods (the Sci does stand for 'science', after all!).
| Figure 4.1: An Example Data Model Method for GIS Geographic Information Systems the software used to create, store, and manage spatial data Data that deals with location, such as lists of addresses, the footprint of a building, the boundaries of cities and counties, etc. , analyze spatial problems, and display the data in cartographic layouts Geographic Information Sciences 1040 |
|---|
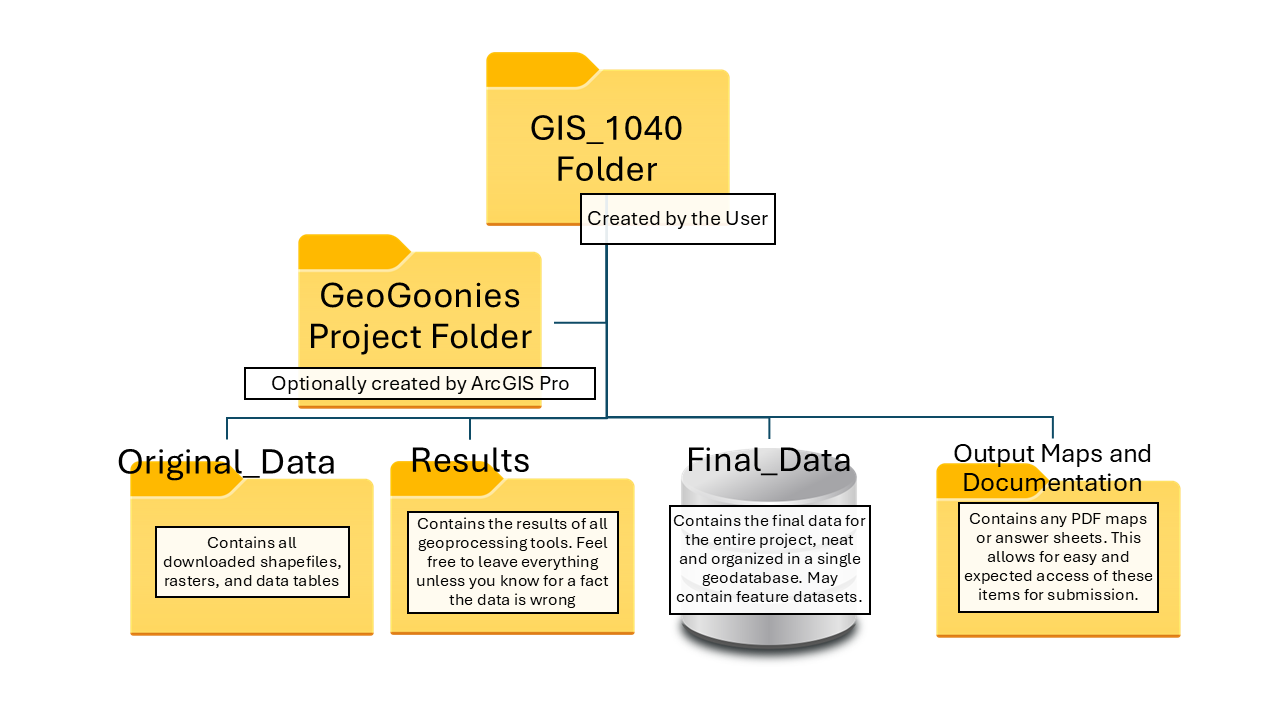 |
| This diagram shows the basic data model used in GIS Geographic Information Systems the software used to create, store, and manage spatial data Data that deals with location, such as lists of addresses, the footprint of a building, the boundaries of cities and counties, etc. , analyze spatial problems, and display the data in cartographic layouts Geographic Information Sciences 1040. |
4.2.3: Folders in the Class Data Model
GIS Geographic Information Systems the software used to create, store, and manage spatial data Data that deals with location, such as lists of addresses, the footprint of a building, the boundaries of cities and counties, etc. , analyze spatial problems, and display the data in cartographic layouts Geographic Information Sciences 1040 Folder
The top folder will be your GIS Geographic Information Systems the software used to create, store, and manage spatial data Data that deals with location, such as lists of addresses, the footprint of a building, the boundaries of cities and counties, etc. , analyze spatial problems, and display the data in cartographic layouts Geographic Information Sciences 1040 folder. This folder will contain all the folders associated with the work you accomplish in this class. To keep things organized, this folder will, for the purpose of this class, contain only other folders. As you move forward in your GIS Geographic Information Systems the software used to create, store, and manage spatial data Data that deals with location, such as lists of addresses, the footprint of a building, the boundaries of cities and counties, etc. , analyze spatial problems, and display the data in cartographic layouts Geographic Information Sciences career, the " GIS Geographic Information Systems the software used to create, store, and manage spatial data Data that deals with location, such as lists of addresses, the footprint of a building, the boundaries of cities and counties, etc. , analyze spatial problems, and display the data in cartographic layouts Geographic Information Sciences 1040" folder will be replaced, initially, by your other courses, and as you move into the work force, it will become things as defined by your companies/agencies data model, like project names, client names, administrative boundaries, etc.
Lab Folder(s)/GeoGoonies Folder/ArcGIS Pro Project Folder
Depending on the structure of the course you are taking, there may be one or several lab folders. For the purposes of GIS Geographic Information Systems the software used to create, store, and manage spatial data Data that deals with location, such as lists of addresses, the footprint of a building, the boundaries of cities and counties, etc. , analyze spatial problems, and display the data in cartographic layouts Geographic Information Sciences 1040, we have one set of data which will last us from lab one to lab eight. This is because all of the labs are portions of a larger project, where each lab builds upon the end of the previous one. In other classes, you may have new data for each lab, thus you might want to have a different lab folder for each lab. Clever names include the lab number and the lab topic. Including the lab topic might be important because you will remember the things you learned but, most likely, not the lab in which you did the work (spoiler alert: all of your classes will have a "Lab One", "Lab Two", etc).
Since all the labs in GIS Geographic Information Systems the software used to create, store, and manage spatial data Data that deals with location, such as lists of addresses, the footprint of a building, the boundaries of cities and counties, etc. , analyze spatial problems, and display the data in cartographic layouts Geographic Information Sciences 1040 are really one big project by the name of "GeoGoonies", the main project folder will not be called "Labs", but instead "GeoGoonies". When the lab sessions begin, the initial project folder/four organizational folder structure will be the first thing we create.
Original Data
The "Original Data" folder is the first of five folders contained by the Lab Folder. Original data will hold the raw data downloaded for use with the lab. The purpose of having an original data folder is to preserve the data and prevent unintentional damage, removal, or overwriting. While permanent damage to your project is unlikely in a classroom setting, - you can re-download the data, copy it from a friend, or ask the instructor for a new copy - in the real world damage could be detrimental. If you are working with data you just collected, and you accidentally overwrite it or erase it, there is no back up source to call upon (also, a side lesson about backing up your work before you make any sort of edits, but sometimes that doesn't happen and you find yourself in quite a pickle). To solve future problems, we practice placing our original data in folder clearly marked as such to prevent any sort of problem.
Results
The second folder of the five folders contained in the Lab folder is the "Results" folder. This folder serves two purposes; one is a place to put a copy of any original data before your make any edits and two is it is a place to save the output from any tool you may run. Making copies of original data prior to edits is explained above and saving all of your tool result files creates a clearly marked spot for "Where did I save that file?" (admit it, you've thought that exact thought a bunch of times before this class).
Within the results folder, it's advised to create further folders as needed. The lab work we do in this class is minimal, and one folder is often plenty, but as you move on in your GIS Geographic Information Systems the software used to create, store, and manage spatial data Data that deals with location, such as lists of addresses, the footprint of a building, the boundaries of cities and counties, etc. , analyze spatial problems, and display the data in cartographic layouts Geographic Information Sciences education and into your career, you will be completing large scale projects that have many steps and lots of output. Creating several folders within the "Results" folder will help organize your data more completely.
Output Maps And Documentation
The Output Maps and Documentation folder is intended to hold the results of creating cartographic layouts and to store your "Methods Documents". At the end of many labs, in GIS Geographic Information Systems the software used to create, store, and manage spatial data Data that deals with location, such as lists of addresses, the footprint of a building, the boundaries of cities and counties, etc. , analyze spatial problems, and display the data in cartographic layouts Geographic Information Sciences 1040 as well as other classes, you are asked to create a cartographic layout of the results of the lab. The ability to present your analyzed data is an important one in GIS Geographic Information Systems the software used to create, store, and manage spatial data Data that deals with location, such as lists of addresses, the footprint of a building, the boundaries of cities and counties, etc. , analyze spatial problems, and display the data in cartographic layouts Geographic Information Sciences , to the point A GIS vector data in any sort of digital science or art, is simply denoting a type of graphical representation using straight lines to construct the outlines of objects geometry type which is made up of just one vertex pl. vertices One of a set of ordered x,y coordinate pairs that defines the shape of a line or polygon feature. , marking a single XY location in any given geographic or projected coordinate system. that most programs include an entire course in Cartography, and those skills are practiced in many classes. Saving all of the output maps (the digital file created by the GIS Geographic Information Systems the software used to create, store, and manage spatial data Data that deals with location, such as lists of addresses, the footprint of a building, the boundaries of cities and counties, etc. , analyze spatial problems, and display the data in cartographic layouts Geographic Information Sciences after the export step of the cartographic process) in a single folder keeps the at hand and you know exactly where to look for them.
Most courses will not ask for you to submit the intermediary or final spatial files, but instead the answer sheet and/or the cartographic layout. Saving your documentation and output (most often PDF) maps in the "Results" folder will lead to you looking and looking through endless rows of data names because remember that Windows sees spatial data Data that deals with location, such as lists of addresses, the footprint of a building, the boundaries of cities and counties, etc. as 3-8 files each, meaning that the data you need to sift through in your "Results" folder will be eight-fold. Windows see windows files (Word docs and PDFs) as single files, and assignment submission software (like MyCourses) is a Windows-based software (regardless of the browser you open it in, but that is a lesson for a whole other class), meaning it sees the Windows files as single files and spatial data Data that deals with location, such as lists of addresses, the footprint of a building, the boundaries of cities and counties, etc. as 3-8 files.
The "Methods" document is a requirement for all of the labs completed in this class, as well as an excellent GIS Geographic Information Systems the software used to create, store, and manage spatial data Data that deals with location, such as lists of addresses, the footprint of a building, the boundaries of cities and counties, etc. , analyze spatial problems, and display the data in cartographic layouts Geographic Information Sciences habit to get into (as it will be expected of you in the "real world"). This document is a series of notes explaining how you went about your work. With simpler projects, the document is pretty straight forward - the tools your ran and the outcome. More complex project benefit greatly from the Methods document, not only for yourself looking back, but also for anyone who picks up where you left off.
Another benefit of the Methods document during your GIS Geographic Information Systems the software used to create, store, and manage spatial data Data that deals with location, such as lists of addresses, the footprint of a building, the boundaries of cities and counties, etc. , analyze spatial problems, and display the data in cartographic layouts Geographic Information Sciences educational path is that while you're in school, almost all the concepts and practices during lab work is new to you. Writing out your methods in notation form solidifies the concepts and practices, helping you learn it better and feel more prepared for practical exams you will face in each class.
This class will provide you a simple framework of a methods document to be filled in and submitted. This makes it easier on the student, as they do not need to develop independent Methods documentation skills along side ArcGIS skills and it makes it easier on the grading instructor if everyone is following a single, define data model.
| Figure 4.2: Examples of an Introductory Level Methods Document and an Advanced Level Methods Document | |
|---|---|
....
.... | ....
...... |
Final Data
After you have completed a project, the Final Data (as opposed to "Original Data") is the place to save all of the data you plan to use in the final cartography or for permanent storage. As we work our way through the text and labs, you will see the steps taken to create final data, so for now, just understand that GIS Geographic Information Systems the software used to create, store, and manage spatial data Data that deals with location, such as lists of addresses, the footprint of a building, the boundaries of cities and counties, etc. , analyze spatial problems, and display the data in cartographic layouts Geographic Information Sciences produces a large quantity of intermediate data ("Results"), especially as you move through your career to more complex projects. Keeping with the idea that the best way to organize your data is in a manner that someone who doesn't know you should be able to understand your structure, the Final Data folder prevents that person from having to sift through your Results folder, attempting to follow your Methods document to establish what files are the "final" ones.