Glossary
| altitude | the height of an independent object, such as an aircraft, above ground level (AGL) |
| angular unit of measure | the selected units for measuring angles. Choices include degree and radians. |
| attribute table editing | The process of modifying the non-spatial information associated with features, such as changing field values, adding new attributes, or updating descriptive data in the table. |
| aspect | [geographic coordinate systems] The direction the developable surface faces in relation to the geographic coordinate system. Normal; transverse, oblique [topography] The cardinal direction a slope faces (NSEW) |
| benchmarks | Benchmarks are real-world locations which have been carefully surveyed with locations to match a specific geoid.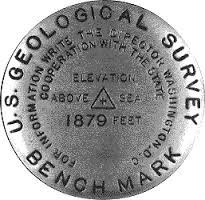 |
| basemaps | A foundational layer on a map that is the basis of GIS visual and geographic context. A basemap may include background reference information such as landforms, roads, landmarks, and administrative boundaries. It displays below any other layers and is typically excluded from the legend. A basemap is used for locational or spatial data reference. |
| bit depth | See pixel depth |
| Cartesian coordinate system | An equally spaced grid that exists in a single geometric plane where intersections of perpendicular lines are labeled with the count of units from a specified origin (0,0) point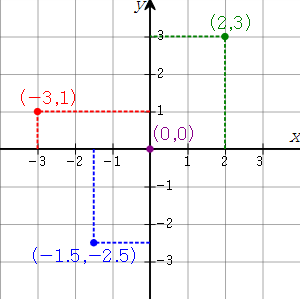 |
| compromise | projections attempt to balance all of the distortions in one map. This means that none of the six are "perfect", but each one is is balance with the others, the idea being that no one place is grossly distorted in comparison to any other place on the map |
| conformal | serve the purpose of preserving shape, distance, and bearing, at the expense of area and scale |
| control point | aka: tie point mathematically derived points that connect a two spatial objects together, such as a geoid and a reference ellipsoid |
| crowdsourcing | Geospatial Science: Refers to the collection, creation, or validation of geographic data by a large group of distributed contributors, typically volunteers, rather than by professional cartographers or official agencies. |
| continuous data | A continuous surface represents phenomena in which each location on the surface is a measure of the concentration level or its relationship from a fixed point in space or from an emitting source. Continuous data is also referred to as field, non-discrete, or surface data. One type of continuous surface is derived from those characteristics that define a surface, in which each location is measured from a fixed registration point. These include elevation (the fixed point being sea level) and aspect (the fixed point being direction: north, east, south, and west). |
| digitizing | The action of creating vector data by defining the location of each vertex utilizing drawing pad and puck (manual or hardcopy digitizing) or a computer with a mouse (heads-up or on-screen digitizing) while, most often, looking at and tracing aerial or satellite imagery. |
| Distance Decay | A concept where the intensity of an effect (e.g., a crime's severity) decreases as the distance from the origin increases. |
| digitized | A term to describe data which was created through the act of digitizing |
| discrete data | Discrete data, which is sometimes called thematic, categorical, or discontinuous data, most often represents objects in both the feature (vector) and raster data storage systems. A discrete object has known and definable boundaries: it is easy to define precisely where the object begins and where it ends. |
| direct feature editing | The process of modifying the geometry (shape, location, or vertices) of spatial features directly on a map, such as moving a point, reshaping a polygon, or adjusting line vertices. |
| derived data | New spatial datasets created by processing or analyzing existing primary or secondary data through geoprocessing operations, spatial analysis, or modeling techniques Derived data includes:
The key characteristic of derived data is that it doesn't exist until you create it through analysis - it represents a transformation or synthesis of the source data. Derived datasets inherit the accuracy, resolution, and limitations of their source data, so understanding data lineage is critical. Documentation should always trace derived data back to its primary or secondary sources and specify the methods used to create it. also see: primary data; secondary data |
| database | electronic storage container with a top-down structure in which the items contained are related to each other and that relationship allows for the data to be quickly and efficiently queried and retrieved for use. |
| digital number | The numeric value stored with a single pixel in raster data (see glossary for more). The numeric value stored with a single pixel in raster data. The digital number, or 'DN', is the numeric value - either float or integer - which represents the object seen in the raster image. Examples of digital numbers can be the red/green/blue value in a color image or the representaion of elevation in a digital elevation model. |
| datum shift | when control points are adjusted via better mathematical calculations or real-world surveying. Benchmarks cannot move, but control points can change via datum shifts. ''Major'' Large effort; many points change; expensive and time-consuming. Noted with a two-digit year (ie NAD83) ''Minor'' Just a few points change. Less expensive; less involved. Noted with a four-digit year (ie. NAD83(1985)) |
| degrees | measurement of plane angle, representing 1⁄360 of a full rotation (circle). In full, a degree of arc or arc degree. Usually denoted by ° |
| developable surface | a geometric shape which will not be distorted when flattened. Used as the base shape to transfer features during projections. Most often a cone, cylinder, or plane (azimuthal) |
| distortion ellipses | start as circles placed on the globe. As the projection is created, the distortion ellipses distort in a manner equal to the map's distortion at the place upon which they are centered. This method allows for a user to visualize the map's distortion without any measuring equipment. |
| Earth-centered, Earth-fixed System | Earth-centered, Earth-fixed systems use the center of the Earth as a start point for measurements, while local-north systems use a smaller area affixed to the Earth's surface as the start point |
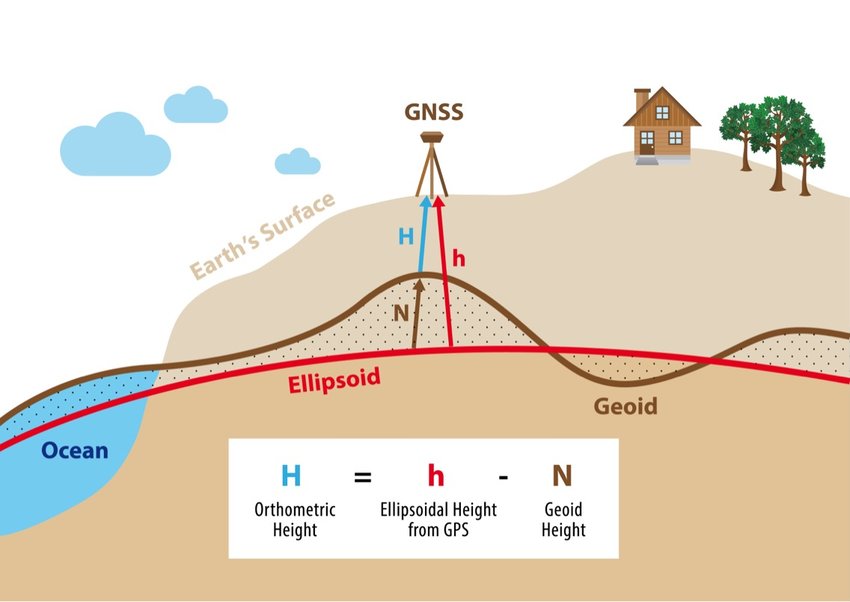
| elevation | the vertical distance between local mean sea level and a single point on the Earth's surface |
| feature class | One of the two main types of vector data we learn in this class (there are more than two vector data types in GIS). Feature classes are each only one geometry type, either a point, a polyline, or a polygon. Feature classes are stored in geodatabases and are most often used when data relationships are important. |
| geographic transformation | The mathematical process of converting coordinates from one geographic coordinate system to another when they use different datums, accounting for differences in how Earth's shape and position are modeled. |
| geoid separation/geoid height | the measured difference between the ellipsoid and the geoid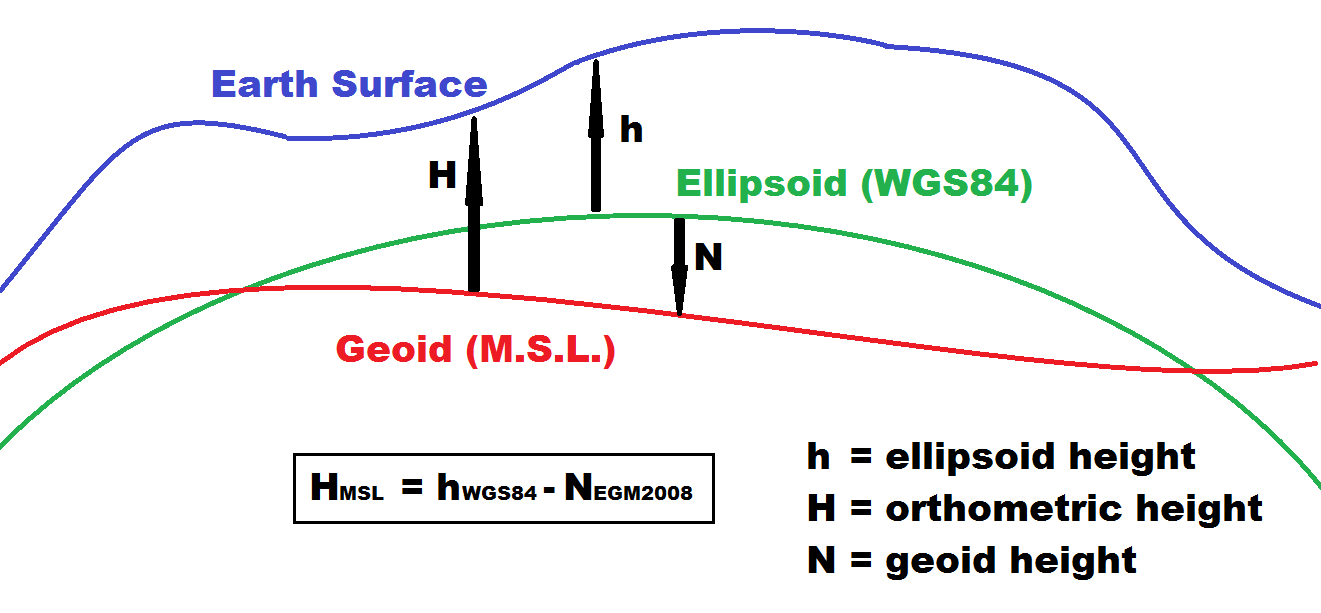
|
| geoid | a model of the variation between global mean (average) sea level and local mean sea level, which is used to measure precise elevations on the topographic surface |
| Geometry Type | the specific shape or form a spatial feature takes, such as a point (single location), a line (connecting multiple points), or a polygon (closed area defined by multiple lines), which are used to represent real-world objects on a map and are defined by their coordinates within a spatial reference system. |
| Geographic Information Systems | the software used to create, store, and manage spatial data, analyze spatial problems, and display the data in cartographic layouts |
| geodesist | a scientist who studies the size, shape, and changing surface of the Earth |
| geocoding | The process of converting text-based location descriptions (typically street addresses) into geographic coordinates (latitude/longitude). An address locator uses reference data and matching algorithms to find the spatial position corresponding to an address like "123 Main Street, Denver, CO 80202." |
| geospatial sciences | A discipline that focuses on using information technology to understand people, places, and processes of the earth. Spatial analysis of human and physically variables is fundamental to the discipline. |
| geodetic | an action relating to geodesy |
| GNSS | Global Navigation Satellite System: A general term for the technology of using satellites and a signal receiver to pin-point a location anywhere on the surface of the Earth |
| geodesy | the science of measuring and monitoring the size and shape of the Earth and the location of points on its surface |
| GPS | Global Positioning System: A satellite-based navigation system owned and operated by the United States Department of Defense that provides location and time information anywhere on Earth. GPS is the USA's version of GNSS (Global Navigation Satellite System) - a broader term that encompasses all global satellite positioning systems, including Russia's GLONASS, Europe's Galileo, and China's BeiDou. GPS uses a constellation of satellites transmitting radio signals that receivers use to calculate their precise position through trilateration. |
| Geographic Profiling | A process that uses the locations of a connected series of crimes to determine the most likely area of offender residence. |
| Geographic Information Sciences (GIScience) | the branch of geospatial sciences concerned with the underlying structure of how to collect and analyze data |
| global mean sea level | the average of the sea level as affected by the pull of gravity when there is a finite amount of water upon a model of the Earth. |
| geodetic datum | the result of attaching a "free-floating" reference ellipsoid to a specifically measured geoid via control points and benchmarks. |
| geographic grid | the result of using an established angular unit of measure to label the intersections of north-south and east-west lines on the surface of the Earth starting the labels at a principal meridian |
| geodatabase | electronic storage container specifically used to store geographic/spatial data with a top-down structure in which the items contained are related to each other and that relationship allows for the data to be quickly and efficiently queried and retrieved for use. |
| Hot Spot Analysis | Identification of areas with a high concentration of features. |
| horizontal datums | used to reference location on the Earth's surface, regardless of elevation |
| local mean sea level | the measurement above or below the global average at a single point on the Earth's surface used for recording the elevation of topographic surface's relief |
| latitude | also known as 'parallels' the east-west portion of a geographic grid measured with angles between 0 and 90° |
| large scale map | a map where the representative fraction is close to one and the objects in the map are relatively large (zoomed in) |
| Lambert Conformal Conic Projection | projection developed by Johann Heinrich Lambert in 1772 utilizing a conic developable surface designed to preserve shape and size (to conform) of land masses. |
| landforms | the descriptive words for individual features on the topographic surface, such as "hills", "valley", and "ridgelines" |
| Mercator Projection | a projection developed by Gerardus Mercator in 1569 utilizing a cylindrical developable surface and a normal aspect tangent at the Equator and designed to produce a map with parallel lines of longitude and latitude. The main purpose of this projection is navigation in the mid-latitudes for east-west travel. |
| modern geodesy | precise global and regional locations, both horizontal and vertical (along the Earth and above the Earth), mapping the land sea, and ice, and determining the variations in the Earth’s gravitational pull and how this effects measurements |
| Multiple Ring Buffers | A series of concentric rings used in spatial analysis to represent distances from a point. |
| minutes | "arc minute" 1/60th of a degree. Usually denoted by " |
| map scale | a mathematical representation expressing distance on a map vs distance on the ground |
| map distortion | In GIS, the unavoidable inaccuracies which occur when transferring features from a geographic coordinate system to a developable surface. Comes in six flavors:
|
| mixed pixel | A raster pixel which contains two or more items when the image is captured. The software will decide how to handle mixed pixels upon storage, most often the majority of the pixel determines the digital number. For example, if a single pixel contains both grass and asphalt upon collection, whichever takes up more of the pixel will end up being the digital number. To resolve more items in an image, the spatial resolution must be increased (the pixel size must become smaller so more pixels can contain more granular information). |
| non-spatial data | Attributes related to a location but not describing its physical placement in space, such as information about a tree's age, type, and health. |
| normal aspect | when a developable surface is tangent or secant with a line of latitude (parallel) Polar: when an azimuthal developable surface is tangent with either of the poles Equatorial: Specifically tangent with the Equator |
| oblate spheroid | a sphere-like object which is wider than it is tall |
| orthometric height | the measured distance between the geoid and the topographic surface. |
| orthometric datums | shows the changes in the Earth's gravitational pull from 0 - any height referenced to the Earth's gravity field can be called as "geopotential heights" |
| oblique aspect | all other orientations after normal and transverse. Not tangent/secant with either a line of latitude or a line of longitude |
| polyline | A GIS vector data geometry type which is made up of two or more vertices connected by straight lines. Often used to represent objects such as roads, river, and boundaries. |
| point | A GIS vector data geometry type which is made up of just one vertex, marking a single XY location in any given geographic or projected coordinate system. |
| pixel | The smallest unit of information in a digital image or raster map, usually square or rectangular. Often used synonymously with cell. Pixel is an abbreviation of "picture element". |
| prolate spheroid | a sphere-like object which is taller than it is wide |
| planar coordinate system | the result of converting an angular unit of measure used to locate objects on a geographic coordinate system to a linear unit of measure via a Cartesian Coordinate System. Planar Coordinate Systems utilize linear units such as feet, meters, and international feet. |
| pixel depth | The range of possible values that can be assigned to a pixel in a raster, measured in bits (e.g., 8-bit, 16-bit, 32-bit). Also called bit depth or pixel type. |
| pixel type | See pixel depth |
| Prime Meridian | the name of the principal meridian in the latitude/longitude system |
| principal meridian | the north-south line from which the labeling begins. East-west lines have a very obvious start point: the equator. North-south lines must start somewhere, so when it is established for a particular geographic grid, it can be considered the principal meridian. |
| projection | technically: the result of using one of variety of methods to transfer the geographic locations of features from a geographic coordinate system to a developable surface everyday use: any coordinate system, geographic or projected |
| primary data | Spatial information that you collect directly from original sources for a specific purpose, rather than using data that someone else has already gathered Primary data includes:
The key distinction is that with primary data, you control the collection methodology, timing, and parameters. You're creating new spatial information rather than repurposing existing datasets. This contrasts with secondary data - pre-existing datasets like census boundaries, publicly available satellite imagery, downloaded DEMs, or any geospatial data originally collected by others that you're now using for your analysis. Primary data is often more expensive and time-consuming to obtain, but it's tailored to your specific research questions and you understand its limitations and quality because you collected it yourself. see also: secondary data, derived data |
| Predictive Analysis | A process of analyzing current and historical facts to make predictions about future or otherwise unknown events. |
| representative fraction | expression of map scale in ratio form utilizing non-specific linear unit, such as 1 map unit equals 250,000 real world units, or 1:250,000 |
| raster data | Raster data is a type of digital data that stores information about a location using a grid of pixels or cells. All spatial rasters are raster files, but not all raster files are spatial rasters. |
| reference ellipsoid | an ellipsoid that is drawn to best-fit an area. World reference ellipsoids are drawn to best-fit the entire geoid; local ellipsoids are best fit on one side to a single place of the geoid |
| relief | the difference between the highest and lowest point within a particular area while landforms are the descriptive words for individual features |
| raster pyramids | Several re-sampled, reduced resolution versions of the original data that allows you to work with raster data faster by only showing the low resolution images (longer ground distance per pixel edge) when you are zoomed out, and the higher resolution image when you are zoomed in. |
| reverse geocoding | Converting geographic coordinates into a human-readable address An address locator takes a point location (latitude/longitude) and identifies the nearest or most appropriate street address or place name for those coordinates. |
| radiometric resolution | One of four resolutions (or the resolving power) used to describe raster data (spatial resolution, spectral resolution, temporal resolution, and radiometric resolution) Radiometric resolution, also known as pixel depth or bit depth (or pixel type, in Esri's little world), is the number of available values for any given pixel. For example, each pixel within a single raster with 8-bit radiometric resolution or 8-bit pixel depth can store any one of the values between 0-255 (or 256 available values). An 8-bit raster/8-bit pixel is not capable of storing any number outside of this range (ie. it can never store the value 257). |
| secondary data | In geospatial science, secondary data refers to spatial information that was originally collected by someone else for a different purpose, which you are now using for your own analysis or research. Secondary data includes:
The defining characteristic of secondary data is that you didn't control its collection - you inherit the original collector's methodology, accuracy standards, temporal coverage, and any limitations or biases in how it was gathered. also see: primary data, derived data |
| slope | A numeric value - either in percent or degree - expressing the steepness or the rise/run of the landscape. |
| spatial resolution | Spatial resolution refers to the level of detail or granularity in an image or a spatial dataset. One of four resolutions (or the resolving power) used to describe raster data (spatial resolution, spectral resolution, temporal resolution, and radiometric resolution). It is a measure of the smallest discernible or resolvable features in the spatial domain, typically expressed as the distance between two adjacent pixels or data points. Spatial resolution is most often described by the actual linear distance along the side of a pixel ("this raster has a spatial resolution of 30 meters") or with the terms "high" and "low" ("I need a raster with a high spatial resolution to really resolve or understand what I'm seeing in this image" or "I can get away with a raster which has a low spatial resolution since I'm zoomed out pretty far anyway"). |
| spectral resolution | One of four resolutions (or the resolving power) used to describe raster data (spatial resolution, spectral resolution, temporal resolution, and radiometric resolution) Spectral resolution describes the range of spectral values from the electromagnetic spectrum available for one spatial raster. The range of the spectrum that each band captures and the number of bands is the spectral resolution. |
| spatial raster | Spatial raster data is a type of digital data that stores information about a location using a grid of pixels or cells AND has stored coordinate information based on any given geographic or projected coordinate system. Spatial rasters have a defined spatial resolution and the pixel represent objects or areas on the Earth's surface. Spatial rasters are described using four resolutions - spatial resolution, spectral resolution, temporal resolution, and radiometric resolution. |
| shapefile | One of the two main types of vector data we learn in this class (there are more than two vector data types in GIS). Shapefiles are each only one geometry type, either a point, a polyline, or a polygon. Shapefiles are stored in folders and most often do not have relationships with other data. |
| spatial aspect | Associating the idea or property of where with data to be analyzed. |
| Spatial Statistics | Probability and distribution of spatial data to determine patterns. |
| Spatial Thinking | The ability to draw upon past experiences and apply them to a new problem utilizing space, the distribution of objects in the real world, and a means of representing those objects. |
| spatial data | Data that deals with location, such as lists of addresses, the footprint of a building, the boundaries of cities and counties, etc. |
| Seven Part Model of GIS |
|
| statement of equivalency | (also known as ''verbal scale''): the relative scale is expressly defined on a map: 1 cm = 1 kilometer; 1 inch = 10 miles |
| State Plane Coordinate System (SPCS) | a planar coordinate system for the United States which breaks states into zones and uses either a Lambert Conformal Conic projection (east-west trending states) or a Transverse Mercator projection (north-south trending states) to create small pieces with little distortion. The zones are stitched together to create a US wide map. |
| spheroid | a sphere-like 3D object where the radius in one direction is longer than the radius in a direction at a right angle to the first |
| small scale map | a map where the representative fraction is far from one and the objects in the map are relatively small (zoomed out) |
| seconds | arc minute. 1/60th of an arc minute; 1/3600 of a degree. Usually denoted by ' |
| transverse aspect | when a developable surface is tangent or secant with a meridian |
| temporal resolution | One of four resolutions (or the resolving power) used to describe raster data (spatial resolution, spectral resolution, temporal resolution, and radiometric resolution) Temporal resolution refers either the the time period a single raster is valid for (if applicable) or the return interval of a particular sensor which captures remotely sensed data. For example, LandSat collected imagery of a location every 14 days. |
| true direction maps | equidistant maps specifically for azimuthal projections |
| trilateration | the process of determining absolute or relative locations of points by measurement of distances, using the geometry of circles, spheres or triangles. ... In contrast to triangulation, it does not involve the measurement of angles |
| Transverse Mercator Projection | a variation of the Normal Mercator Projection where the tangential line is switched from a parallel to a meridian. Lines of longitude and latitude appear circular and the map is optimized for north-south travel. |
| topographic surface | a detailed map of the surface features of land. It includes the mountains, hills, creeks, and other bumps and lumps on a particular hunk of earth. The word is a Greek-rooted combo of topos meaning "place" and graphein "to write." |
| tie points | see Control Points |
| tidal datums | show the changes in sea level due to tides and are based on local mean sea level |
| three dimensional datums | combine horizontal datums with ellipsoidal height |
| Universal Transverse Mercator (UTM) | a Planar Coordinate System (via a projection) which divides the globe into 60 separate 6° wide zones, each one with the principle meridian 3° from either side and cut half at the Equator. Each strip, or zone, is then stitched together to create an entire Earth flat map. To prevent negative numbers, each zone is assigned a origin arbitrarily labeled 500,000 mE, 10,000,000 mN. Using a Cartesian Coordinate System, locations are measured in meters. Since both the north and the south half of each zone will contain the same coordinates, and there are 60 zones, all possible coordinate pairs will appear 120 times, forcing the need to use the zone number and designate North or South is needed. |
| vertex | pl. vertices |
| vector data | in any sort of digital science or art, is simply denoting a type of graphical representation using straight lines to construct the outlines of objects |
| vertical datums | used to reference locations and distances above mean sea level; elevation. |
| verbal scale |