In the last three sections, we looked how reference ellipsoids are combined with geoids via control points to create datums and how geographic grids utilize an angular unit of measure the selected units for measuring angles. Choices include degree and radians. to label intersections of north-south and east-west lines (parallels and meridians) starting at a principal meridian the north-south line from which the labeling begins. East-west lines have a very obvious start point: the equator. North-south lines must start somewhere, so when it is established for a particular geographic grid, it can be considered the principal meridian. , examining the latitude also known as 'parallels' the east-west portion of a geographic grid measured with angles between 0 and 90° /longitude system as an example. We then learned that combining a specific datum with a geographic grid the result of using an established angular unit of measure to label the intersections of north-south and east-west lines on the surface of the Earth starting the labels at a principal meridian the north-south line from which the labeling begins. East-west lines have a very obvious start point: the equator. North-south lines must start somewhere, so when it is established for a particular geographic grid, it can be considered the principal meridian. creates an accurate way to locate those labeled points utilizing the geographic coordinate system. In this final section, we will look at the final concept that connects geodesy the science of measuring and monitoring the size and shape of the Earth and the location of points on its surface to GIS Geographic Information Systems the software used to create, store, and manage spatial data Data that deals with location, such as lists of addresses, the footprint of a building, the boundaries of cities and counties, etc. , analyze spatial problems, and display the data in cartographic layouts Geographic Information Sciences : projected coordinate systems.
While it is possible to use a geographic coordinate system in the GIS Geographic Information Systems the software used to create, store, and manage spatial data Data that deals with location, such as lists of addresses, the footprint of a building, the boundaries of cities and counties, etc. , analyze spatial problems, and display the data in cartographic layouts Geographic Information Sciences and print a map showing angular units, this system doesn’t make a ton of sense in our minds. If I told you the area of a particular place was 0.00034 degrees measurement of plane angle, representing 1⁄360 of a full rotation (circle). In full, a degree of arc or arc degree. Usually denoted by ° squared, how big is that? As big as Rhode Island or as big as Texas? You (I’m going to make a fair assumption here) most likely have no idea. If I gave you directions to my house by saying “travel along Main Street at a heading of 270 for 0.029 degrees measurement of plane angle, representing 1⁄360 of a full rotation (circle). In full, a degree of arc or arc degree. Usually denoted by ° latitude also known as 'parallels' the east-west portion of a geographic grid measured with angles between 0 and 90° and make a left on 9th. You’ll find my house (the bright blue one) at 2 08’59.96” N, 110 50’09.03”W”, you most likely would have a tough time trying to find it without the use of a GPS Global Positioning System: A satellite-based navigation system owned and operated by the United States Department of Defense that provides location and time information anywhere on Earth. app or receiver. Overall, we do not perceive the world in angular units, but instead by linear units - the area of a place is 1 mile square or you tell people to 'head 2 miles west on Main and turn right on 9th'.
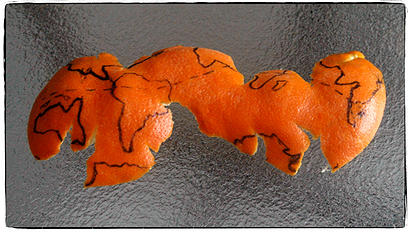
Which leads us to our first step of making flat maps which utilize linear units of measure: “remove” the crust of the earth and press it flat. Once it’s flat, we can use a wooden ruler and measure in linear units (inches and centimeters, and since a map is defined as a two-dimensional scale model of the surface of the Earth which conveys a message to the user, each inch or centimeter would represent some real world unit such as miles or kilometers). However, the process is not as simple as removing the crust of the Earth and pressing it flat. Like peeling a tangerine and smashing the peel flat with your hand against a table, if you were to peel off the crust of the Earth and attempt to make a flat map out of it, it will look just the same – no real shape and far from useful.
| FIGURE 2.21: Making a Flat Map of the World is So Similar Yet So Different Than Simply Removing the Crust and Smashing It Flat Like a Tangerine Peel |
|---|
 |
The process, utilizing a projected coordinate system (a flat map from a round globe) is amore complicated then simply peeling off the crust and smashing it flat, and results is a side effect called map distortion In GIS, the unavoidable inaccuracies which occur when transferring features from a geographic coordinate system to a developable surface. Comes in six flavors: Shape: the shape of the geographic feature vs. the shape drawn on the map Area: the measured area of a world feature Distance: the measured distance between two world features Direction: the cardinal direction between two world features, minus distance information Bearing: the cardinal direction measuring from one world feature to any other Scale: comparing the size of two world features vs. the same two drawn on a map , but as a bonus for the complication (as we are about to see) comes a much neater, easier to understand product. We will spend some time in the next section exploring the idea of projection technically: the result of using one of variety of methods to transfer the geographic locations of features from a geographic coordinate system to a developable surface everyday use: any coordinate system, geographic or projected methods and creating projected coordinate systems, but for now, just understand it is the method we use to get the shapes from the round Earth onto a flat map.
When making projected coordinate systems, because we are taking something round and representing it as something flat, our choices really only are: 1. a funky shape (like the orange peel above) that presents us with zero distortion, or 2. using a projection technically: the result of using one of variety of methods to transfer the geographic locations of features from a geographic coordinate system to a developable surface everyday use: any coordinate system, geographic or projected method, create a more familiar shape, such as a rectangle, but introduce distortion into the map. The problem with the former is the lack of usefulness of the funky shape (how would you measure the area of South America on that orange peel?), and the problem with the latter is there is no specific projection technically: the result of using one of variety of methods to transfer the geographic locations of features from a geographic coordinate system to a developable surface everyday use: any coordinate system, geographic or projected method which reduces or preserves all kinds of distortion.
Distortion is a by-product of the projection technically: the result of using one of variety of methods to transfer the geographic locations of features from a geographic coordinate system to a developable surface everyday use: any coordinate system, geographic or projected process. Since we don't want flat maps which look like the orange peel we see above, when we move the land and ocean masses back into place, some measurement becomes distorted. To preserve the shape of the continents, we need to stretch and move them around, which results in the area no longer being true. If we try to preserve the area, the shape becomes distorted. When the continents are moved and the shapes distorted, the distance between them become affected. If the distance is held true, then the shape and area are going to become distorted. The only way to keep all of the measurements true is to make the flat map in the shape of the smashed orange peel - which takes us back to the beginning where the maps was useless.
Some projection technically: the result of using one of variety of methods to transfer the geographic locations of features from a geographic coordinate system to a developable surface everyday use: any coordinate system, geographic or projected methods are designed to keep the shapes of the represented areas (specifically “ conformal serve the purpose of preserving shape, distance, and bearing, at the expense of area and scale ”), while other are designed to preserve distance (specifically “equidistant”), and still others preserve direction, shape, and scale. Listed out, the six major kinds of distortion we are battling when we make projections from geographic coordinate systems are:
- Shape (the shape of the world feature vs. the shape drawn on the map)
- Area (the measured area of a world feature)
- Distance (the measured distance between two world features)
- Direction (the cardinal direction between two world features, minus distance information)
- Bearing (the cardinal direction measuring from one world feature to any other)
- Scale (comparing the size of two world features vs. the same two drawn on a map)
Or as one GIS Geographic Information Systems the software used to create, store, and manage spatial data Data that deals with location, such as lists of addresses, the footprint of a building, the boundaries of cities and counties, etc. , analyze spatial problems, and display the data in cartographic layouts Geographic Information Sciences student once put it, "Map distortion from the projection technically: the result of using one of variety of methods to transfer the geographic locations of features from a geographic coordinate system to a developable surface everyday use: any coordinate system, geographic or projected method is some SADD BS".
As much as I'd like to tear into a plastic globe each semester to illustrate the point A GIS vector data in any sort of digital science or art, is simply denoting a type of graphical representation using straight lines to construct the outlines of objects geometry type which is made up of just one vertex pl. vertices One of a set of ordered x,y coordinate pairs that defines the shape of a line or polygon feature. , marking a single XY location in any given geographic or projected coordinate system. , that isn't really practical. Instead, watch the following video. It does a great job of explaining projected coordinate systems and distortion. It will help you understand distortion and the rest of the section.
YouTube Break
2.7.1: Creating Projections
To understand how it is the round world is made flat via a projection technically: the result of using one of variety of methods to transfer the geographic locations of features from a geographic coordinate system to a developable surface everyday use: any coordinate system, geographic or projected , imagine yourself as an Earth Explorer, standing in the center of a clear globe. After high-fiving the guys from Fragglerock, you look out and see all of the continents surrounding you (similar to what you see when you're standing on the bridge of the Mapparium (Figure 2.22b). If you look in the direction of the Washington Monument, you’ve noticed someone has used it to stab the center of a piece of stiff cardboard, much like a lunch server would do with a completed ticket. Let’s call this piece of cardboard a developable surface a geometric shape which will not be distorted when flattened. Used as the base shape to transfer features during projections. Most often a cone, cylinder, or plane (azimuthal) (when the developable surface a geometric shape which will not be distorted when flattened. Used as the base shape to transfer features during projections. Most often a cone, cylinder, or plane (azimuthal) is flat, we call this azimuthal). This piece of paper is so large from your point A GIS vector data in any sort of digital science or art, is simply denoting a type of graphical representation using straight lines to construct the outlines of objects geometry type which is made up of just one vertex pl. vertices One of a set of ordered x,y coordinate pairs that defines the shape of a line or polygon feature. , marking a single XY location in any given geographic or projected coordinate system. of view, it creates a background for the entirety of North and South America. Since the cardboard is stiff, it touches the Earth only at the Washington Monument (the tangential point A GIS vector data in any sort of digital science or art, is simply denoting a type of graphical representation using straight lines to construct the outlines of objects geometry type which is made up of just one vertex pl. vertices One of a set of ordered x,y coordinate pairs that defines the shape of a line or polygon feature. , marking a single XY location in any given geographic or projected coordinate system. ) and ‘floats’ above the surface at all other points.
From the center of the globe, you take your handy-dandy Light Gun of Science (LGoS), and begin to point A GIS vector data in any sort of digital science or art, is simply denoting a type of graphical representation using straight lines to construct the outlines of objects geometry type which is made up of just one vertex pl. vertices One of a set of ordered x,y coordinate pairs that defines the shape of a line or polygon feature. , marking a single XY location in any given geographic or projected coordinate system. it at each city in North and South America. As the beam from your LGoS passes through a city and strikes the cardboard, it leaves a labeled mark (it is a Light Gun of Science, after all). Just like a movie projector throws the image from the lens to the wall, your LGoS projects a labeled city point A GIS vector data in any sort of digital science or art, is simply denoting a type of graphical representation using straight lines to construct the outlines of objects geometry type which is made up of just one vertex pl. vertices One of a set of ordered x,y coordinate pairs that defines the shape of a line or polygon feature. , marking a single XY location in any given geographic or projected coordinate system. from the edge of the globe to the cardboard.
You notice the distance the light travels from the edge of the globe to the cardboard at Washington DC is zero, since the cardboard touches the globe at that point A GIS vector data in any sort of digital science or art, is simply denoting a type of graphical representation using straight lines to construct the outlines of objects geometry type which is made up of just one vertex pl. vertices One of a set of ordered x,y coordinate pairs that defines the shape of a line or polygon feature. , marking a single XY location in any given geographic or projected coordinate system. . You also note the distance the light travels between the globe's surface and the cardboard increases as you move& away from Washington DC. And because the Washington Monument is not in the exact center of the United States, the distance the light has to travel between New York and the cardboard is shorter then the distance between Los Angeles and the cardboard.
| FIGURE 2.22: LGoS vs North and South America and The Mapparium in Boston | |
|---|---|
 | 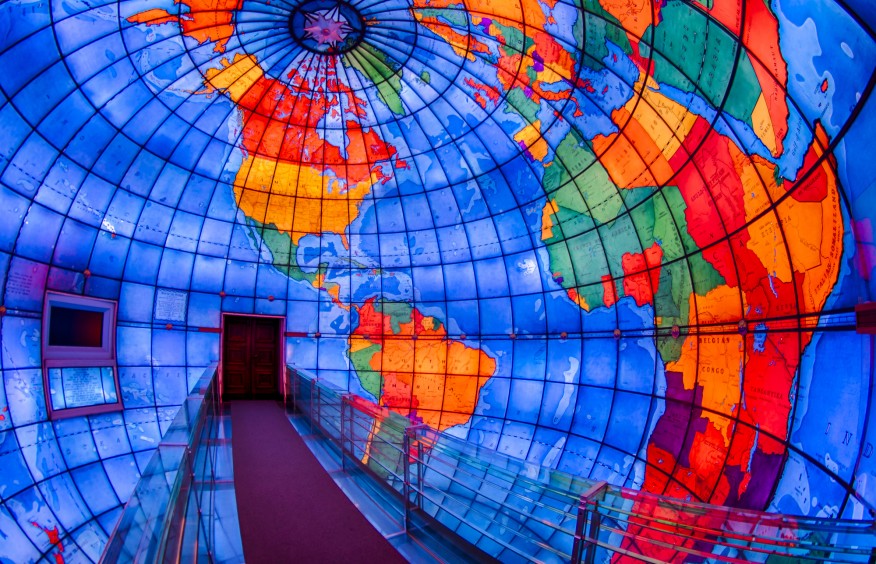 |
| A: LGoS vs North and South America: Technically An oblique gnomonic projection technically: the result of using one of variety of methods to transfer the geographic locations of features from a geographic coordinate system to a developable surface everyday use: any coordinate system, geographic or projected | B: The Mapparium in the Mary Baker Eddy Library in Boston lets you experience the Earth’s geography without distortion as you look from the inside out. |
After you’ve marked all the major cities, you then use the LGoS to mark the entire edge of the North and South American continents. (Figure 2.22a) Once you take the cardboard off the Washington Monument, you connect the dots to draw the outline of the two landmasses, use a ruler to draw a neat grid over the whole thing, and give it a name which reflects the area it shows and the creation method (Figure 2.23)
Congratulations, you’ve made your first projection technically: the result of using one of variety of methods to transfer the geographic locations of features from a geographic coordinate system to a developable surface everyday use: any coordinate system, geographic or projected .
| FIGURE 2.23: LGoS vs North and South America - The Result |
|---|
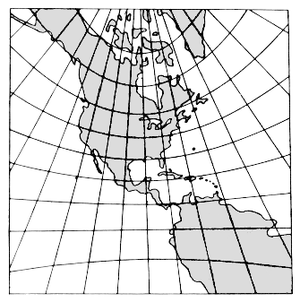 |
| The result of your projection technically: the result of using one of variety of methods to transfer the geographic locations of features from a geographic coordinate system to a developable surface everyday use: any coordinate system, geographic or projected . Oblique gnomonic projections distort the map in an increasing manner away from the tangential point A GIS vector data in any sort of digital science or art, is simply denoting a type of graphical representation using straight lines to construct the outlines of objects geometry type which is made up of just one vertex pl. vertices One of a set of ordered x,y coordinate pairs that defines the shape of a line or polygon feature. , marking a single XY location in any given geographic or projected coordinate system. |
| The Main Point |
|---|
| Projections are created when a single source of light is used to project an image of land features from a geographic coordinate system onto a 3D surface in order to transfer the round GCS to a flat map, with it, connecting the labeled points on the GCS to the labeled points on the projection technically: the result of using one of variety of methods to transfer the geographic locations of features from a geographic coordinate system to a developable surface everyday use: any coordinate system, geographic or projected . This method comes with some consequences in the form of distortions which are presented as shape, area, size, bearing, distance, and direction, noting that the distortion near the place where the developable surface a geometric shape which will not be distorted when flattened. Used as the base shape to transfer features during projections. Most often a cone, cylinder, or plane (azimuthal) touches the GCS has the least amount of distortion and places which are far away have the most distortion. Some projections are designed preserve between one and three factors, but need to give up the others in order to do so. |
| Terminology - An Aside |
|---|
In this section we are going to look at a couple of terms - projection technically: the result of using one of variety of methods to transfer the geographic locations of features from a geographic coordinate system to a developable surface everyday use: any coordinate system, geographic or projected , projection technically: the result of using one of variety of methods to transfer the geographic locations of features from a geographic coordinate system to a developable surface everyday use: any coordinate system, geographic or projected method, and projected coordinate system. It's important to note these are three distinct terms, each with a specific definition. In short, a projection technically: the result of using one of variety of methods to transfer the geographic locations of features from a geographic coordinate system to a developable surface everyday use: any coordinate system, geographic or projected is the action of shining a fictitious light on a geographic coordinate system with the intent of transferring the land and ocean masses to a flats surface, a projection technically: the result of using one of variety of methods to transfer the geographic locations of features from a geographic coordinate system to a developable surface everyday use: any coordinate system, geographic or projected method is the combination of a specific developable surface a geometric shape which will not be distorted when flattened. Used as the base shape to transfer features during projections. Most often a cone, cylinder, or plane (azimuthal) , a specific aspect [geographic coordinate systems] The direction the developable surface a geometric shape which will not be distorted when flattened. Used as the base shape to transfer features during projections. Most often a cone, cylinder, or plane (azimuthal) faces in relation to the geographic coordinate system. Normal; transverse, oblique[topography] The cardinal direction a slope A numeric value - either in percent or degree - expressing the steepness or the rise/run of the landscape. faces (NSEW) , and a specific geographic coordinate system, and a Projected Coordinate System is the completed product, including a linear unit of measure and a system origin. In the real world, however, people will use the term " projection technically: the result of using one of variety of methods to transfer the geographic locations of features from a geographic coordinate system to a developable surface everyday use: any coordinate system, geographic or projected " (s) or "projections" (p) to refer to any coordinate system - geographic or projected. This is not a technically correct use of the term. However, it is just how it is. This text and lecture/labs during class will use the correct terminology in the correct places. Once you move into second-semester GIS Geographic Information Systems the software used to create, store, and manage spatial data Data that deals with location, such as lists of addresses, the footprint of a building, the boundaries of cities and counties, etc. , analyze spatial problems, and display the data in cartographic layouts Geographic Information Sciences courses and beyond, the terminology as a whole will move into "real world" usage. |
2.7.1.1: Geographic Coordinate Systems - The Beginning of Projections
This whole section is all about creating projected coordinate systems which have the advantage of flat maps and linear units, and like the sections on Geographic Coordinate Systems, it will seen like we are building "the" Projected Coordinate System or "the three" Projected Coordinate Systems- which isn't true. There are thousands of coordinate systems. In fact, at the time of writing - 2022 - There are currently 6,709 coordinate systems (795 Geographic and 5,914 Projected) and supported by Esri software - and that not even counting the 882 depreciated coordinate systems and 286 active/depreciated coordinate systems which don't fall into the Geographic or Projected Coordinate System categories (vertical and engineering) which are listed in the EPSG database electronic storage container with a top-down structure in which the items contained are related to each other and that relationship allows for the data to be quickly and efficiently queried and retrieved for use. ! Below, you can see a list of all the Esri supported Geographic and Projected Coordinate Systems.
The process of creating a projected coordinate system all begins with some Geographic Coordinate System - which one? - The one that is appropriate to create the Projected Coordinate System with the least amount of distortion for the area being mapped. This is because every Projected Coordinate System is a projection technically: the result of using one of variety of methods to transfer the geographic locations of features from a geographic coordinate system to a developable surface everyday use: any coordinate system, geographic or projected of a Geographic Coordinate System. Earlier, in the LGoS example, you were standing inside the Mapparium and shooting the laser through the glass wall to the azimuthal plane (the cardboard stabbed on the Washington Monument). In that case, the GCS used to create the PCS was the Mapparium. The Mapparium was the 3D Geographic Coordinate System from which the land masses were being projected on to the azimuthal plane to create the Projected Coordinate System. When a Projected Coordinate System is being built, it starts with a selected Geographic Coordinate System from which to make the projection technically: the result of using one of variety of methods to transfer the geographic locations of features from a geographic coordinate system to a developable surface everyday use: any coordinate system, geographic or projected on to the developable surface a geometric shape which will not be distorted when flattened. Used as the base shape to transfer features during projections. Most often a cone, cylinder, or plane (azimuthal) . This is a very important piece of information to keep in mind for the remainder of this section. Any time an ellipsoid is mentioned, that ellipsoid is coming from the Geographic Coordinate System. It's not just a random ellipsoid that was selected to make a Projected Coordinate System.
| The Main Point | |
|---|---|
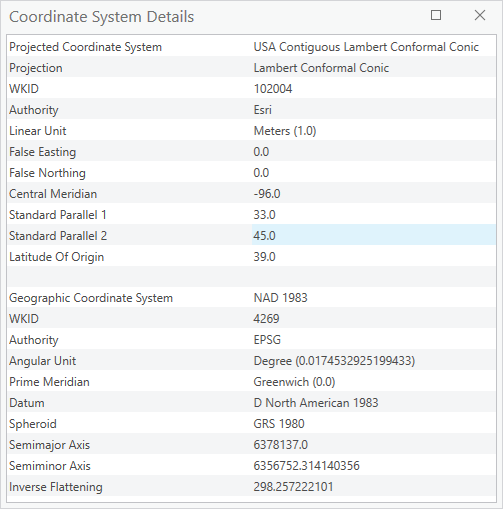
| All Projections are based on a selected Geographic Coordinate System. The selection for the GCS is made based on the area the PCS will be created. For example, the Projected Coordinate System specifically named "USA Contiguous Lambert Conformal Conic" is based on the Geographic Coordinate System specifically named "GCS North American Datum 1983" | |
 | 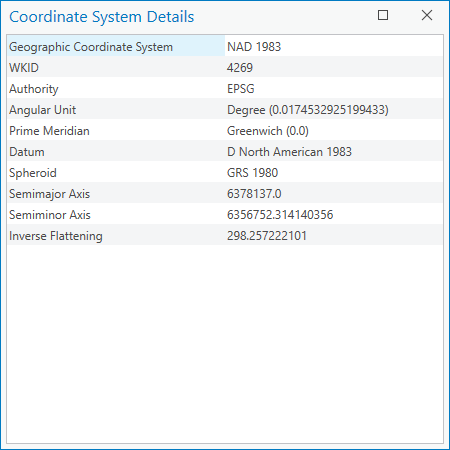 |
2.7.2: Projection Methods
As discussed in the first section, the main goal of creating a projected coordinate system is to create a flat representation of a round Geographic Coordinate System which uses linear units of measure (since we tend to best think in linear units) while minimizing distortion. If you look at your Oblique Gnomonic Projection made with your LGoS, there is distortion. The light traveling a longer distance from the surface of the globe at Los Angeles before striking the developable surface a geometric shape which will not be distorted when flattened. Used as the base shape to transfer features during projections. Most often a cone, cylinder, or plane (azimuthal) vs New York. This longer distance of travel between the 3D and the 2D objects is the source of the previously discussed distortion (along with the need to stretch, bend, and pull the land masses to fit inside the desired developable surface a geometric shape which will not be distorted when flattened. Used as the base shape to transfer features during projections. Most often a cone, cylinder, or plane (azimuthal) ). The Oblique Gnomonic projection technically: the result of using one of variety of methods to transfer the geographic locations of features from a geographic coordinate system to a developable surface everyday use: any coordinate system, geographic or projected method creates a distortion of area and distance, meaning if you were to measure the distance or calculate the area on the resulting map, you'd notice the measured values will vary from the real-world accepted values (as based on geodesy the science of measuring and monitoring the size and shape of the Earth and the location of points on its surface ) and that variation will not be constant across the map. Your map will show an increase in area and distance radiating away from the tangential point A GIS vector data in any sort of digital science or art, is simply denoting a type of graphical representation using straight lines to construct the outlines of objects geometry type which is made up of just one vertex pl. vertices One of a set of ordered x,y coordinate pairs that defines the shape of a line or polygon feature. , marking a single XY location in any given geographic or projected coordinate system. (Washington Monument).
While the LGoS example is a silly visualization of how one might start the process of creating a projected coordinate system, in reality map projections are created using a rather complicated, mathematical process. As this is not a geodesy the science of measuring and monitoring the size and shape of the Earth and the location of points on its surface nor calculus course, we will simplify it into a generalized process.
2.7.2.1: Developable Surfaces
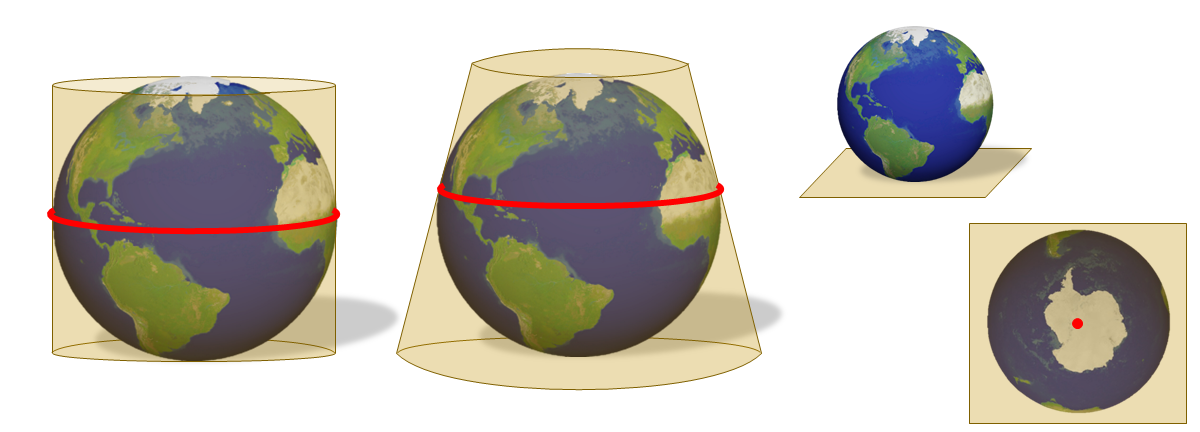
For the Light Gun of Science example, we called the bit of cardboard which was held in place by the Washington Monument a developable surface a geometric shape which will not be distorted when flattened. Used as the base shape to transfer features during projections. Most often a cone, cylinder, or plane (azimuthal) or a azimuthal developable surface a geometric shape which will not be distorted when flattened. Used as the base shape to transfer features during projections. Most often a cone, cylinder, or plane (azimuthal) . While making projections of GCS's, we actually have hundreds and hundreds of developable surfaces available to us, all with the goal of reducing as much distortion as possible for that flat map in the designated area of interest. All these hundreds of developable surfaces have advantages and disadvantages, when it comes to preserving the land masses and making them look as close to their globe representations as possible. Even though there are hundreds of developable surfaces available, we are going to focus on the three most common: cylinder, cone, and flat sheet (azimuthal).
| Figure 2.24: The Three Main Types of Developable Surfaces - Azimuthal (Planar), Cylindrical, and Conical |
|---|
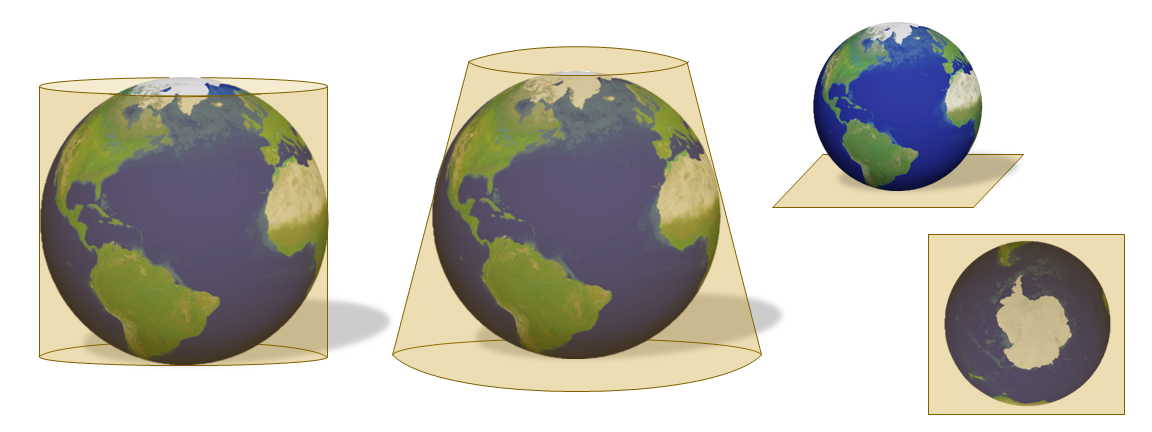 |
| The three most common developable surfaces, from left to right: cylindrical (a cylinder), conical (a cone), and azimuthal or planar (a flat sheet) |
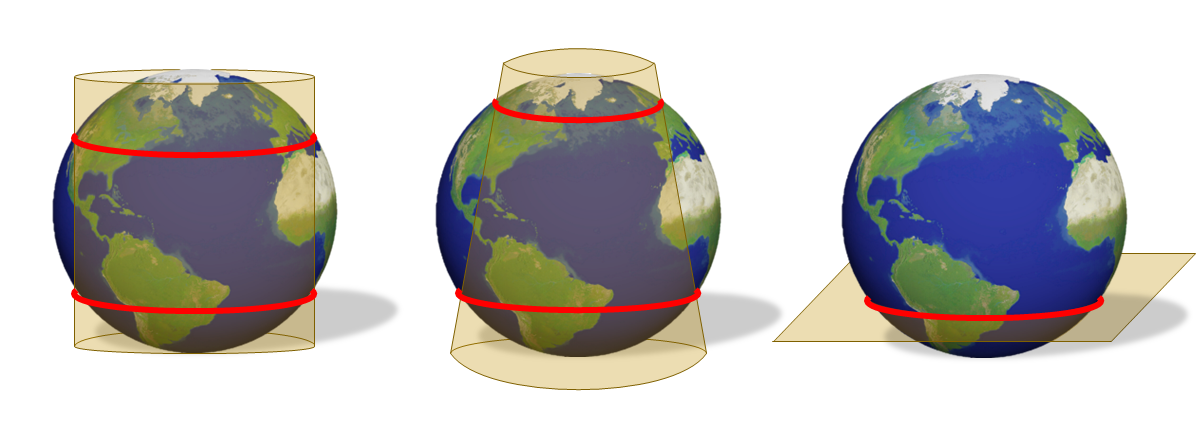
Once the projection technically: the result of using one of variety of methods to transfer the geographic locations of features from a geographic coordinate system to a developable surface everyday use: any coordinate system, geographic or projected has been made between the GCS and the developable surface a geometric shape which will not be distorted when flattened. Used as the base shape to transfer features during projections. Most often a cone, cylinder, or plane (azimuthal) , the developable surface a geometric shape which will not be distorted when flattened. Used as the base shape to transfer features during projections. Most often a cone, cylinder, or plane (azimuthal) is "cut" up one side and "rolled out" to create a flat map. We need to remember that even though we are looking at projection technically: the result of using one of variety of methods to transfer the geographic locations of features from a geographic coordinate system to a developable surface everyday use: any coordinate system, geographic or projected methods as though they are physical objects, everything which is being completed is done with mathematics/trigonometry. That being said, it's much easier to understand the concepts if we describe them as physical three dimensional shapes and shining lights to create projections of the continents.
| Figure 2.25: Developable Surfaces as Flat Surfaces |
|---|
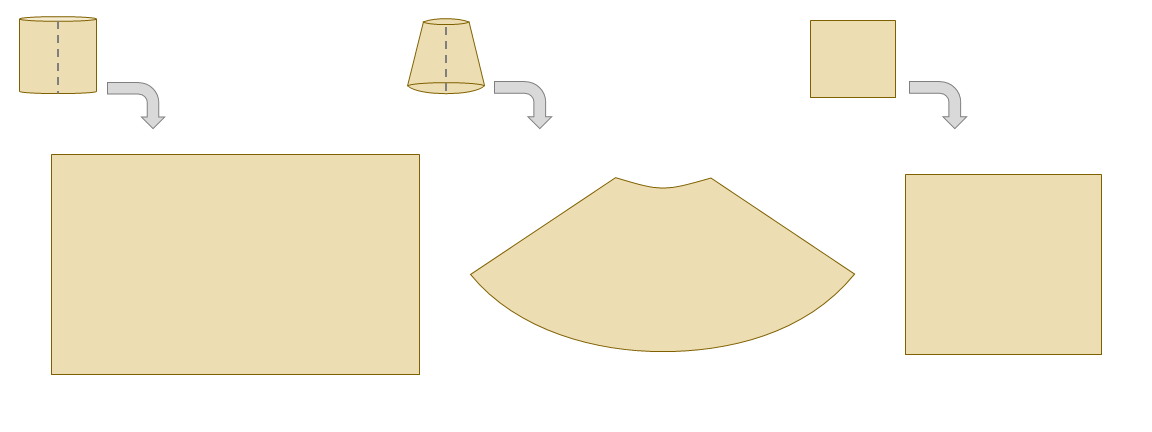 |
| The three most common developable surfaces, from left to right: cylindrical (a cylinder), conical (a cone), and azimuthal or planar (a flat sheet) |
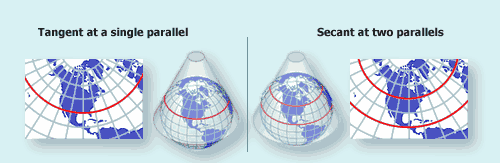
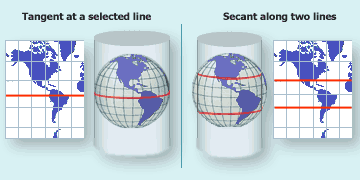
2.7.2.2: Understanding Tangent and Secant Lines - Where the Developable Surface Intersects the Geographic Coordinate System
In Figure 2.26, below, we see the caption noting the cylindrical and conical developable surfaces are either tangent at one line (what we would simplify as the "tangential line") or secant at two lines. In the case of the azimuthal developable surface a geometric shape which will not be distorted when flattened. Used as the base shape to transfer features during projections. Most often a cone, cylinder, or plane (azimuthal) , we see the developable surface a geometric shape which will not be distorted when flattened. Used as the base shape to transfer features during projections. Most often a cone, cylinder, or plane (azimuthal) is either tangent at a single point A GIS vector data in any sort of digital science or art, is simply denoting a type of graphical representation using straight lines to construct the outlines of objects geometry type which is made up of just one vertex pl. vertices One of a set of ordered x,y coordinate pairs that defines the shape of a line or polygon feature. , marking a single XY location in any given geographic or projected coordinate system. or secant at a single line all the way around the Geographic Coordinate System. These intersection lines - the place where the developable surface a geometric shape which will not be distorted when flattened. Used as the base shape to transfer features during projections. Most often a cone, cylinder, or plane (azimuthal) intersects the geographic coordinate system - is the place where the projection technically: the result of using one of variety of methods to transfer the geographic locations of features from a geographic coordinate system to a developable surface everyday use: any coordinate system, geographic or projected starts. Just like the Washington Monument was the tangential point A GIS vector data in any sort of digital science or art, is simply denoting a type of graphical representation using straight lines to construct the outlines of objects geometry type which is made up of just one vertex pl. vertices One of a set of ordered x,y coordinate pairs that defines the shape of a line or polygon feature. , marking a single XY location in any given geographic or projected coordinate system. during the LGoS example, the tangential line or secant lines is just the place where the three dimensional developable surface a geometric shape which will not be distorted when flattened. Used as the base shape to transfer features during projections. Most often a cone, cylinder, or plane (azimuthal) intersects the Geographic Coordinate System. This line/these lines are important by the fact that distortion is the least at and very near the intersection areas and increases as the projection technically: the result of using one of variety of methods to transfer the geographic locations of features from a geographic coordinate system to a developable surface everyday use: any coordinate system, geographic or projected moves away from the point A GIS vector data in any sort of digital science or art, is simply denoting a type of graphical representation using straight lines to construct the outlines of objects geometry type which is made up of just one vertex pl. vertices One of a set of ordered x,y coordinate pairs that defines the shape of a line or polygon feature. , marking a single XY location in any given geographic or projected coordinate system. /line/lines. In the case of two secant lines interacting with cylindrical or conical developable surfaces, the distortion increases moving away from the two secant lines and in between, meets in the middle.
| Figure 2.26: Increasing Distortion Moving Away from the Tangential Line/Secant Lines |
|---|
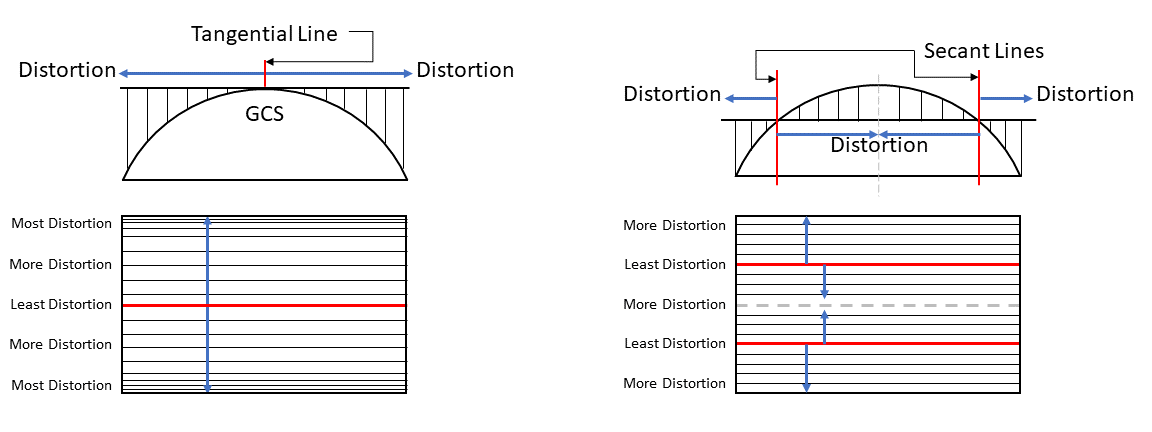 |
When creating projections, the ability to move the tangential line/secant lines to where the eventual Projected Coordinate System will be focused is one way to control distortion. It allows the PCS creator to essentially force the distortion into the areas where the PCS isn't focused and move the accuracy and precision to the areas where the PCS is focused. For example, a Projected Coordinate System which is good for the Contiguous United States and focuses on maintaining area (what we would call an "equal area" projection technically: the result of using one of variety of methods to transfer the geographic locations of features from a geographic coordinate system to a developable surface everyday use: any coordinate system, geographic or projected ) might use two secant lines at 33°N and 45°N, at which the distortion for the PCS would be least. Areas moving into Canada and Mexico would have increased distortion in the distortions shape and distance at the extreme ends, however, area would be preserved in the focused area (Figure 2.25).
| Figure 2.27: Tangential Line/Tangential Point and Secant Lines/Line | |
|---|---|
 |  |
| A: Tangent at one line (cylindrical or conical) or one point A GIS vector data in any sort of digital science or art, is simply denoting a type of graphical representation using straight lines to construct the outlines of objects geometry type which is made up of just one vertex pl. vertices One of a set of ordered x,y coordinate pairs that defines the shape of a line or polygon feature. , marking a single XY location in any given geographic or projected coordinate system. (azimuthal) | B: Secant at one line (azimuthal) or two lines (cylindrical or conical) |
2.7.2.3: Aspects
In an effort to move distortion away from the areas of interest (however large an area that may be) and towards the areas of non-interest, we have not only different developable surfaces and a choice between one tangential line and two secant lines at our disposal, but we also have the aspect [geographic coordinate systems] The direction the developable surface a geometric shape which will not be distorted when flattened. Used as the base shape to transfer features during projections. Most often a cone, cylinder, or plane (azimuthal) faces in relation to the geographic coordinate system. Normal; transverse, oblique[topography] The cardinal direction a slope A numeric value - either in percent or degree - expressing the steepness or the rise/run of the landscape. faces (NSEW) of the projection technically: the result of using one of variety of methods to transfer the geographic locations of features from a geographic coordinate system to a developable surface everyday use: any coordinate system, geographic or projected method.
The aspect [geographic coordinate systems] The direction the developable surface a geometric shape which will not be distorted when flattened. Used as the base shape to transfer features during projections. Most often a cone, cylinder, or plane (azimuthal) faces in relation to the geographic coordinate system. Normal; transverse, oblique[topography] The cardinal direction a slope A numeric value - either in percent or degree - expressing the steepness or the rise/run of the landscape. faces (NSEW) is the freedom to rotate the 3D developable surface a geometric shape which will not be distorted when flattened. Used as the base shape to transfer features during projections. Most often a cone, cylinder, or plane (azimuthal) in direction before interacting with the ellipsoid. We have three aspects available to us: Normal - no rotation (cylinder opening up/cone point A GIS vector data in any sort of digital science or art, is simply denoting a type of graphical representation using straight lines to construct the outlines of objects geometry type which is made up of just one vertex pl. vertices One of a set of ordered x,y coordinate pairs that defines the shape of a line or polygon feature. , marking a single XY location in any given geographic or projected coordinate system. up/azimuthal plane touching a pole); Transverse - 90° of rotation (cylinder opening facing east-west, cone opening facing east or west, azimuthal plane touching a parallel); or Oblique - somewhere in-between ( developable surface a geometric shape which will not be distorted when flattened. Used as the base shape to transfer features during projections. Most often a cone, cylinder, or plane (azimuthal) interacting with line of latitude also known as 'parallels' the east-west portion of a geographic grid measured with angles between 0 and 90° between 1 and 89°).
Another way to describe the aspect [geographic coordinate systems] The direction the developable surface a geometric shape which will not be distorted when flattened. Used as the base shape to transfer features during projections. Most often a cone, cylinder, or plane (azimuthal) faces in relation to the geographic coordinate system. Normal; transverse, oblique[topography] The cardinal direction a slope A numeric value - either in percent or degree - expressing the steepness or the rise/run of the landscape. faces (NSEW) is that Normal aspects interact with parallels (lines of latitude also known as 'parallels' the east-west portion of a geographic grid measured with angles between 0 and 90° ); Transverse aspects interact with meridians (lines of longitude); and Oblique aspects interact with any areas which are not a parallel or a meridian. Since there are only three options when it comes to interreacting with a GCS - parallel, meridian, or somewhere in-between, we only have the need for three aspects.
The purpose of having all these choices - developable surfaces, tangential line/secant lines, and aspects, all lead to projected coordinate systems which have the least amount of distortion possible. Currently, at the time of writing, Esri software supports 107 different projection technically: the result of using one of variety of methods to transfer the geographic locations of features from a geographic coordinate system to a developable surface everyday use: any coordinate system, geographic or projected methods, each with a choice of developable surface a geometric shape which will not be distorted when flattened. Used as the base shape to transfer features during projections. Most often a cone, cylinder, or plane (azimuthal) , aspect [geographic coordinate systems] The direction the developable surface a geometric shape which will not be distorted when flattened. Used as the base shape to transfer features during projections. Most often a cone, cylinder, or plane (azimuthal) faces in relation to the geographic coordinate system. Normal; transverse, oblique[topography] The cardinal direction a slope A numeric value - either in percent or degree - expressing the steepness or the rise/run of the landscape. faces (NSEW) , and tangential/secant lines. Beyond that, the user can manually manipulate existing projection technically: the result of using one of variety of methods to transfer the geographic locations of features from a geographic coordinate system to a developable surface everyday use: any coordinate system, geographic or projected methods to specify the exact location of the tangential/secant lines (what Esri software refers to as the standard parallels). This allows for finer control of the location of distortion for a specific project or map.
| FIGURE 2.28: A Summary of The Most Common Aspects and Developable Surfaces |
|---|
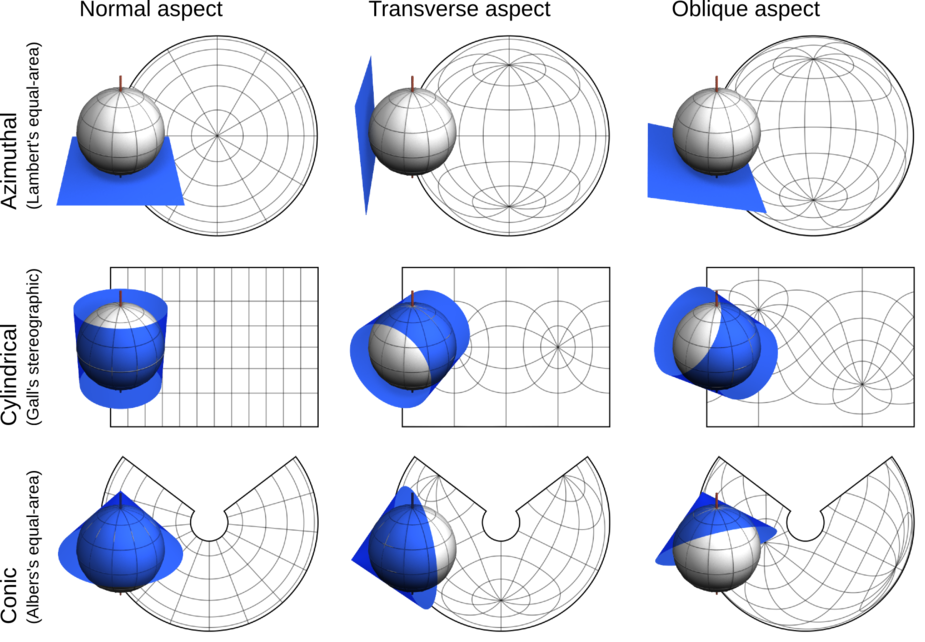 |
2.7.2.4: Basic Projection Methods
As noted above, projection technically: the result of using one of variety of methods to transfer the geographic locations of features from a geographic coordinate system to a developable surface everyday use: any coordinate system, geographic or projected methods include a developable surface a geometric shape which will not be distorted when flattened. Used as the base shape to transfer features during projections. Most often a cone, cylinder, or plane (azimuthal) and an aspect [geographic coordinate systems] The direction the developable surface a geometric shape which will not be distorted when flattened. Used as the base shape to transfer features during projections. Most often a cone, cylinder, or plane (azimuthal) faces in relation to the geographic coordinate system. Normal; transverse, oblique[topography] The cardinal direction a slope A numeric value - either in percent or degree - expressing the steepness or the rise/run of the landscape. faces (NSEW) . While projection technically: the result of using one of variety of methods to transfer the geographic locations of features from a geographic coordinate system to a developable surface everyday use: any coordinate system, geographic or projected methods are more specific then the following (and are available in more developable surfaces), this section will lightly touch on the more common basic projection technically: the result of using one of variety of methods to transfer the geographic locations of features from a geographic coordinate system to a developable surface everyday use: any coordinate system, geographic or projected methods. What is missing from these is a specific Geographic Coordinate System and defined tangential or secant lines (the locations in degrees measurement of plane angle, representing 1⁄360 of a full rotation (circle). In full, a degree of arc or arc degree. Usually denoted by ° ).
Conic Projections
Conical projections use a developable surface a geometric shape which will not be distorted when flattened. Used as the base shape to transfer features during projections. Most often a cone, cylinder, or plane (azimuthal) which start in the shape of a cone. The cone is slipped over the Earth and is either tangent along a single line or secant along two parallel lines (not necessarily "parallels", but two lines which are parallel) around the entire GCS. After the projection technically: the result of using one of variety of methods to transfer the geographic locations of features from a geographic coordinate system to a developable surface everyday use: any coordinate system, geographic or projected is completed, the cone is removed and "cut up" one side, then "unrolled". Conical projections reduce distortion closest to the tangent or secant lines, with the distortion increasing as one moves away from these areas.
Conical projections can be equatorial (normal) - meaning the cone is tangent at the equator; normal - the cone is tangent or secant at a parallel (line on latitude also known as 'parallels' the east-west portion of a geographic grid measured with angles between 0 and 90° ); transverse - the cone is tangent or secant along a meridian (line of longitude); or oblique - the cone is tangent or secant along another path (anything not a parallel or meridian).
Examples of conic projection technically: the result of using one of variety of methods to transfer the geographic locations of features from a geographic coordinate system to a developable surface everyday use: any coordinate system, geographic or projected methods include Lambert Conformal Conic, Albers Equal Area Conic, and Equidistant Conic.
| FIGURE 2.29: Conic Projection Examples |
|---|
 |
Cylindrical Projections
Cylindrical projections use a cylinder slipped over the GCS with either a single tangential line or two secant lines. After the map elements are projected onto the cylinder, it is cut up one side and rolled flat. Cylindrical projections, like conical have the least amount of distortion near the tangent or secant lines, then the distortion increases one moves away.
Like conical, cylindrical has the three main kinds projections: normal, transverse, oblique. Examples of cylindrical projections include Mercator, Transverse Mercator, Oblique Mercator, Plate Carr, Miller Cylindrical, Cylindrical equal-area, Gall Peters, Hobo Dyer, Behrmann, and Lambert Cylindrical Equal-Area.
| FIGURE 2.30: Cylindrical Projection Examples | |
|---|---|
 | |
| Equatorial (normal) projections are tangent along the Equator, with the cylinder parallel to the poles. Mercator (discussed in the West Wing video) is one of the most popular ways to see this projection. | Transverse projections are tangent along a meridian (most often along the Prime Meridian, but it's not mandatory). Transverse Mercator projections are popular; Universal Transverse Mercator (UTM) is a transverse Mercator projection superimposed with a grid for navigation purposes. UTM is just as popular as latitude and longitude when it comes to the settings on your GPS unit. Oblique projections are a cylindrical projection along any line that is not the equator or a meridian. Oblique cylindrical projections are used to reduce distortion locally, not just at the Equator or Prime Meridian. |
Azimuthal Projections
Azimuthal Planar Projection projections, also known as planar projections, are projections where a rectangular developable surface a geometric shape which will not be distorted when flattened. Used as the base shape to transfer features during projections. Most often a cone, cylinder, or plane (azimuthal) is tangent at a single point A GIS vector data in any sort of digital science or art, is simply denoting a type of graphical representation using straight lines to construct the outlines of objects geometry type which is made up of just one vertex pl. vertices One of a set of ordered x,y coordinate pairs that defines the shape of a line or polygon feature. , marking a single XY location in any given geographic or projected coordinate system. or secant along a path (the developable surface a geometric shape which will not be distorted when flattened. Used as the base shape to transfer features during projections. Most often a cone, cylinder, or plane (azimuthal) slices through part of the globe) and map elements are projected from a single light source. Even though azimuthal projections increase rapidly in regard to distortion (they are best for small area projections), the advantage is the ability to move the light source, contrary to conic and cylindrical projection technically: the result of using one of variety of methods to transfer the geographic locations of features from a geographic coordinate system to a developable surface everyday use: any coordinate system, geographic or projected methods, which have a fixed light source at the "center" of the GSC. The advantage to moving the light source with an azimuthal projection technically: the result of using one of variety of methods to transfer the geographic locations of features from a geographic coordinate system to a developable surface everyday use: any coordinate system, geographic or projected is the ability to move the distortion away from the area of interest and towards the areas on non-interest, just like the aspect [geographic coordinate systems] The direction the developable surface a geometric shape which will not be distorted when flattened. Used as the base shape to transfer features during projections. Most often a cone, cylinder, or plane (azimuthal) faces in relation to the geographic coordinate system. Normal; transverse, oblique[topography] The cardinal direction a slope A numeric value - either in percent or degree - expressing the steepness or the rise/run of the landscape. faces (NSEW) and location of the tangential/secant lines help move the distortion around the projection technically: the result of using one of variety of methods to transfer the geographic locations of features from a geographic coordinate system to a developable surface everyday use: any coordinate system, geographic or projected . There are six common locations for the light source, each one used to reduce distortion in a different way (see table).
Azimuthal projections can be normal - which in an azimuthal projection technically: the result of using one of variety of methods to transfer the geographic locations of features from a geographic coordinate system to a developable surface everyday use: any coordinate system, geographic or projected , the developable surface a geometric shape which will not be distorted when flattened. Used as the base shape to transfer features during projections. Most often a cone, cylinder, or plane (azimuthal) can be polar - tangent at either the North or South pole; normal - the tangential point A GIS vector data in any sort of digital science or art, is simply denoting a type of graphical representation using straight lines to construct the outlines of objects geometry type which is made up of just one vertex pl. vertices One of a set of ordered x,y coordinate pairs that defines the shape of a line or polygon feature. , marking a single XY location in any given geographic or projected coordinate system. or secant line is a parallel; transverse - the tangential point A GIS vector data in any sort of digital science or art, is simply denoting a type of graphical representation using straight lines to construct the outlines of objects geometry type which is made up of just one vertex pl. vertices One of a set of ordered x,y coordinate pairs that defines the shape of a line or polygon feature. , marking a single XY location in any given geographic or projected coordinate system. or secant line is a meridian; or oblique - the tangential point A GIS vector data in any sort of digital science or art, is simply denoting a type of graphical representation using straight lines to construct the outlines of objects geometry type which is made up of just one vertex pl. vertices One of a set of ordered x,y coordinate pairs that defines the shape of a line or polygon feature. , marking a single XY location in any given geographic or projected coordinate system. or secant line is anywhere else.
Examples of azimuthal projections include: Azimuthal Equidistant, Lambert Azimuthal Equal-Area, Gnomonic, Stereographic, and Orthographic projections.
| Figure 2.31: Example of Light Paths to Create Azimuthal Projections | |
|---|---|
 | 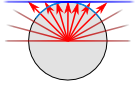 |
| Orthographic Stereo Gnomonic | Gnomonic |
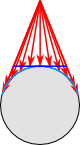 | 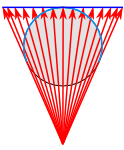 |
| Vertical perspective, near-side | Vertical perspective, far-side |
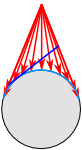 | 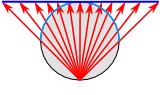 |
| Oblique perspective (non-azimuthal) | Stereo |
Various Projection Methods
List of Supported Projection Methods
View as a Separate Page| Projection Name | Parameter Name | Default Value | Array Position |
|---|---|---|---|
| Adams_Square_II | False_Easting | 0 | 0 |
| False_Northing | 0 | 1 | |
| Scale_Factor | 0 | 5 | |
| Azimuth | 45 | 7 | |
| Longitude_Of_Center | -75 | 10 | |
| Latitude_Of_Center | 40 | 11 | |
| XY_Plane_Rotation | 0 | 14 | |
| Aitoff | False_Easting | 0 | 0 |
| False_Northing | 0 | 1 | |
| Central_Meridian | 0 | 2 | |
| Albers | False_Easting | 0 | 0 |
| False_Northing | 0 | 1 | |
| Central_Meridian | 0 | 2 | |
| Standard_Parallel_1 | 60 | 3 | |
| Standard_Parallel_2 | 60 | 4 | |
| Latitude_Of_Origin | 0 | 6 | |
| Aspect_Adaptive_Cylindrical | False_Easting | 0 | 0 |
| False_Northing | 0 | 1 | |
| Central_Meridian | 0 | 2 | |
| Aspect_Ratio | 0.6 | 5 | |
| Azimuthal_Equidistant | False_Easting | 0 | 0 |
| False_Northing | 0 | 1 | |
| Central_Meridian | 0 | 2 | |
| Latitude_Of_Origin | 0 | 6 | |
| Azimuthal_Equidistant_Auxiliary_Sphere | False_Easting | 0 | 0 |
| False_Northing | 0 | 1 | |
| Central_Meridian | 0 | 2 | |
| Latitude_Of_Origin | 0 | 6 | |
| Auxiliary_Sphere_Type | 0 | 12 | |
| Behrmann | False_Easting | 0 | 0 |
| False_Northing | 0 | 1 | |
| Central_Meridian | 0 | 2 | |
| Berghaus_Star | False_Easting | 0 | 0 |
| False_Northing | 0 | 1 | |
| Central_Meridian | 0 | 2 | |
| Latitude_Of_Origin | 0 | 6 | |
| XY_Plane_Rotation | 0 | 14 | |
| Bonne | False_Easting | 0 | 0 |
| False_Northing | 0 | 1 | |
| Central_Meridian | 0 | 2 | |
| Standard_Parallel_1 | 60 | 3 | |
| Cassini | False_Easting | 0 | 0 |
| False_Northing | 0 | 1 | |
| Central_Meridian | 0 | 2 | |
| Scale_Factor | 1 | 5 | |
| Latitude_Of_Origin | 0 | 6 | |
| Compact_Miller | False_Easting | 0 | 0 |
| False_Northing | 0 | 1 | |
| Central_Meridian | 0 | 2 | |
| Craster_Parabolic | False_Easting | 0 | 0 |
| False_Northing | 0 | 1 | |
| Central_Meridian | 0 | 2 | |
| Cube | False_Easting | 0 | 0 |
| False_Northing | 0 | 1 | |
| Central_Meridian | 0 | 2 | |
| Option | 0 | 15 | |
| Cylindrical_Equal_Area | False_Easting | 0 | 0 |
| False_Northing | 0 | 1 | |
| Central_Meridian | 0 | 2 | |
| Standard_Parallel_1 | 60 | 3 | |
| Double_Stereographic | False_Easting | 0 | 0 |
| False_Northing | 0 | 1 | |
| Central_Meridian | 0 | 2 | |
| Scale_Factor | 1 | 5 | |
| Latitude_Of_Origin | 0 | 6 | |
| Eckert_Greifendorff | False_Easting | 0 | 0 |
| False_Northing | 0 | 1 | |
| Central_Meridian | 0 | 2 | |
| Latitude_Of_Origin | 0 | 6 | |
| Eckert_I | False_Easting | 0 | 0 |
| False_Northing | 0 | 1 | |
| Central_Meridian | 0 | 2 | |
| Eckert_II | False_Easting | 0 | 0 |
| False_Northing | 0 | 1 | |
| Central_Meridian | 0 | 2 | |
| Eckert_III | False_Easting | 0 | 0 |
| False_Northing | 0 | 1 | |
| Central_Meridian | 0 | 2 | |
| Eckert_IV | False_Easting | 0 | 0 |
| False_Northing | 0 | 1 | |
| Central_Meridian | 0 | 2 | |
| Eckert_IV_Auxiliary_Sphere | False_Easting | 0 | 0 |
| False_Northing | 0 | 1 | |
| Central_Meridian | 0 | 2 | |
| Auxiliary_Sphere_Type | 0 | 12 | |
| Eckert_V | False_Easting | 0 | 0 |
| False_Northing | 0 | 1 | |
| Central_Meridian | 0 | 2 | |
| Eckert_VI | False_Easting | 0 | 0 |
| False_Northing | 0 | 1 | |
| Central_Meridian | 0 | 2 | |
| Eckert_VI_Auxiliary_Sphere | False_Easting | 0 | 0 |
| False_Northing | 0 | 1 | |
| Central_Meridian | 0 | 2 | |
| Auxiliary_Sphere_Type | 0 | 12 | |
| Equal_Earth | False_Easting | 0 | 0 |
| False_Northing | 0 | 1 | |
| Central_Meridian | 0 | 2 | |
| Equidistant_Conic | False_Easting | 0 | 0 |
| False_Northing | 0 | 1 | |
| Central_Meridian | 0 | 2 | |
| Standard_Parallel_1 | 60 | 3 | |
| Standard_Parallel_2 | 60 | 4 | |
| Latitude_Of_Origin | 0 | 6 | |
| Equidistant_Cylindrical | False_Easting | 0 | 0 |
| False_Northing | 0 | 1 | |
| Central_Meridian | 0 | 2 | |
| Standard_Parallel_1 | 60 | 3 | |
| Equidistant_Cylindrical_Auxiliary_Sphere | False_Easting | 0 | 0 |
| False_Northing | 0 | 1 | |
| Central_Meridian | 0 | 2 | |
| Standard_Parallel_1 | 60 | 3 | |
| Auxiliary_Sphere_Type | 0 | 12 | |
| Equidistant_Cylindrical_Ellipsoidal | False_Easting | 0 | 0 |
| False_Northing | 0 | 1 | |
| Central_Meridian | 0 | 2 | |
| Standard_Parallel_1 | 60 | 3 | |
| Flat_Polar_Quartic | False_Easting | 0 | 0 |
| False_Northing | 0 | 1 | |
| Central_Meridian | 0 | 2 | |
| Fuller | False_Easting | 0 | 0 |
| False_Northing | 0 | 1 | |
| Option | 0 | 15 | |
| Gall_Stereographic | False_Easting | 0 | 0 |
| False_Northing | 0 | 1 | |
| Central_Meridian | 0 | 2 | |
| Gauss_Kruger | False_Easting | 0 | 0 |
| False_Northing | 0 | 1 | |
| Central_Meridian | 0 | 2 | |
| Scale_Factor | 1 | 5 | |
| Latitude_Of_Origin | 0 | 6 | |
| Geostationary_Satellite | False_Easting | 0 | 0 |
| False_Northing | 0 | 1 | |
| Longitude_Of_Center | -75 | 10 | |
| Height | 0 | 14 | |
| Option | 0 | 15 | |
| Gnomonic | False_Easting | 0 | 0 |
| False_Northing | 0 | 1 | |
| Longitude_Of_Center | -75 | 10 | |
| Latitude_Of_Center | 40 | 11 | |
| Gnomonic_Auxiliary_Sphere | False_Easting | 0 | 0 |
| False_Northing | 0 | 1 | |
| Longitude_Of_Center | -75 | 10 | |
| Latitude_Of_Center | 40 | 11 | |
| Auxiliary_Sphere_Type | 0 | 12 | |
| Gnomonic_Ellipsoidal | False_Easting | 0 | 0 |
| False_Northing | 0 | 1 | |
| Longitude_Of_Center | -75 | 10 | |
| Latitude_Of_Center | 40 | 11 | |
| Goode_Homolosine | False_Easting | 0 | 0 |
| False_Northing | 0 | 1 | |
| Central_Meridian | 0 | 2 | |
| Option | 0 | 15 | |
| Hammer_Aitoff | False_Easting | 0 | 0 |
| False_Northing | 0 | 1 | |
| Central_Meridian | 0 | 2 | |
| Hammer_Ellipsoidal | False_Easting | 0 | 0 |
| False_Northing | 0 | 1 | |
| Central_Meridian | 0 | 2 | |
| Latitude_Of_Origin | 0 | 6 | |
| Hotine_Oblique_Mercator_Azimuth_Center | False_Easting | 0 | 0 |
| False_Northing | 0 | 1 | |
| Scale_Factor | 1 | 5 | |
| Azimuth | 45 | 7 | |
| Longitude_Of_Center | -75 | 10 | |
| Latitude_Of_Center | 40 | 11 | |
| Hotine_Oblique_Mercator_Azimuth_Center_Old | False_Easting | 0 | 0 |
| False_Northing | 0 | 1 | |
| Scale_Factor | 1 | 5 | |
| Azimuth | 45 | 7 | |
| Longitude_Of_Center | -75 | 10 | |
| Latitude_Of_Center | 40 | 11 | |
| Hotine_Oblique_Mercator_Azimuth_Natural_Origin | False_Easting | 0 | 0 |
| False_Northing | 0 | 1 | |
| Scale_Factor | 1 | 5 | |
| Azimuth | 45 | 7 | |
| Longitude_Of_Center | -75 | 10 | |
| Latitude_Of_Center | 40 | 11 | |
| >Hotine_Oblique_Mercator_Two_Point_Center | False_Easting | 0 | 0 |
| False_Northing | 0 | 1 | |
| Latitude_Of_1st_Point | 0 | 3 | |
| Latitude_Of_2nd_Point | 60 | 4 | |
| Scale_Factor | 1 | 5 | |
| Longitude_Of_1st_Point | 0 | 8 | |
| Longitude_Of_2nd_Point | 60 | 9 | |
| Latitude_Of_Center | 40 | 11 | |
| >Hotine_Oblique_Mercator_Two_Point_Natural_Origin | False_Easting | 0 | 0 |
| False_Northing | 0 | 1 | |
| Latitude_Of_1st_Point | 0 | 3 | |
| Latitude_Of_2nd_Point | 60 | 4 | |
| Scale_Factor | 1 | 5 | |
| Longitude_Of_1st_Point | 0 | 8 | |
| Longitude_Of_2nd_Point | 60 | 9 | |
| Latitude_Of_Center | 40 | 11 | |
| IGAC_Plano_Cartesiano | False_Easting | 0 | 0 |
| False_Northing | 0 | 1 | |
| Longitude_Of_Center | -75 | 10 | |
| Latitude_Of_Center | 40 | 11 | |
| Height | 0 | 14 | |
| Krovak | False_Easting | 0 | 0 |
| False_Northing | 0 | 1 | |
| Pseudo_Standard_Parallel_1 | 60 | 3 | |
| Scale_Factor | 1 | 5 | |
| Azimuth | 45 | 7 | |
| Longitude_Of_Center | -75 | 10 | |
| Latitude_Of_Center | 40 | 11 | |
| X_Scale | 1 | 12 | |
| Y_Scale | 1 | 13 | |
| XY_Plane_Rotation | 0 | 14 | |
| Laborde_Oblique_Mercator | False_Easting | 0 | 0 |
| False_Northing | 0 | 1 | |
| Scale_Factor | 1 | 5 | |
| Azimuth | 45 | 7 | |
| Longitude_Of_Center | -75 | 10 | |
| Latitude_Of_Center | 40 | 11 | |
| Lambert_Azimuthal_Equal_Area | False_Easting | 0 | 0 |
| False_Northing | 0 | 1 | |
| Central_Meridian | 0 | 2 | |
| Latitude_Of_Origin | 0 | 6 | |
| Lambert_Azimuthal_Equal_Area_Auxiliary_Sphere | False_Easting | 0 | 0 |
| False_Northing | 0 | 1 | |
| Central_Meridian | 0 | 2 | |
| Latitude_Of_Origin | 0 | 6 | |
| Auxiliary_Sphere_Type | 0 | 12 | |
| Lambert_Conformal_Conic | False_Easting | 0 | 0 |
| False_Northing | 0 | 1 | |
| Central_Meridian | 0 | 2 | |
| Standard_Parallel_1 | 60 | 3 | |
| Standard_Parallel_2 | 60 | 4 | |
| Scale_Factor | 1 | 5 | |
| Latitude_Of_Origin | 0 | 6 | |
| Lambert_Conformal_Conic_1SP | False_Easting | 0 | 0 |
| False_Northing | 0 | 1 | |
| Central_Meridian | 0 | 2 | |
| Scale_Factor | 1 | 5 | |
| Latitude_Of_Origin | 0 | 6 | |
| Lambert_Conformal_Conic_2SP | False_Easting | 0 | 0 |
| False_Northing | 0 | 1 | |
| Central_Meridian | 0 | 2 | |
| Standard_Parallel_1 | 60 | 3 | |
| Standard_Parallel_2 | 60 | 4 | |
| Latitude_Of_Origin | 0 | 6 | |
| Local | False_Easting | 0 | 0 |
| False_Northing | 0 | 1 | |
| Scale_Factor | 1 | 5 | |
| Azimuth | 45 | 7 | |
| Longitude_Of_Center | -75 | 10 | |
| Latitude_Of_Center | 40 | 11 | |
| Loximuthal | False_Easting | 0 | 0 |
| False_Northing | 0 | 1 | |
| Central_Meridian | 0 | 2 | |
| Central_Parallel | 0 | 6 | |
| Mercator | False_Easting | 0 | 0 |
| False_Northing | 0 | 1 | |
| Central_Meridian | 0 | 2 | |
| Standard_Parallel_1 | 60 | 3 | |
| Mercator_Auxiliary_Sphere | False_Easting | 0 | 0 |
| False_Northing | 0 | 1 | |
| Central_Meridian | 0 | 2 | |
| Standard_Parallel_1 | 60 | 3 | |
| Auxiliary_Sphere_Type | 0 | 12 | |
| Mercator_Variant_A | False_Easting | 0 | 0 |
| False_Northing | 0 | 1 | |
| Central_Meridian | 0 | 2 | |
| Scale_Factor | 1 | 5 | |
| Mercator_Variant_C | False_Easting | 0 | 0 |
| False_Northing | 0 | 1 | |
| Central_Meridian | 0 | 2 | |
| Standard_Parallel_1 | 60 | 3 | |
| Latitude_Of_Origin | 0 | 6 | |
| Miller_Cylindrical | False_Easting | 0 | 0 |
| False_Northing | 0 | 1 | |
| Central_Meridian | 0 | 2 | |
| Miller_Cylindrical_Auxiliary_Sphere | False_Easting | 0 | 0 |
| False_Northing | 0 | 1 | |
| Central_Meridian | 0 | 2 | |
| Auxiliary_Sphere_Type | 0 | 12 | |
| Mollweide | False_Easting | 0 | 0 |
| False_Northing | 0 | 1 | |
| Central_Meridian | 0 | 2 | |
| Mollweide_Auxiliary_Sphere | False_Easting | 0 | 0 |
| False_Northing | 0 | 1 | |
| Central_Meridian | 0 | 2 | |
| Auxiliary_Sphere_Type | 0 | 12 | |
| Natural_Earth | False_Easting | 0 | 0 |
| False_Northing | 0 | 1 | |
| Central_Meridian | 0 | 2 | |
| Natural_Earth_II | False_Easting | 0 | 0 |
| False_Northing | 0 | 1 | |
| Central_Meridian | 0 | 2 | |
| New_Zealand_Map_Grid | False_Easting | 0 | 0 |
| False_Northing | 0 | 1 | |
| Longitude_Of_Origin | 0 | 2 | |
| Latitude_Of_Origin | 0 | 6 | |
| Ney_Modified_Conic | False_Easting | 0 | 0 |
| False_Northing | 0 | 1 | |
| Central_Meridian | 0 | 2 | |
| Standard_Parallel_1 | 60 | 3 | |
| Standard_Parallel_2 | 60 | 4 | |
| Scale_Factor | 1 | 5 | |
| Latitude_Of_Origin | 0 | 6 | |
| Orthographic | False_Easting | 0 | 0 |
| False_Northing | 0 | 1 | |
| Longitude_Of_Center | -75 | 10 | |
| Latitude_Of_Center | 40 | 11 | |
| Orthographic_Auxiliary_Sphere | False_Easting | 0 | 0 |
| False_Northing | 0 | 1 | |
| Longitude_Of_Center | -75 | 10 | |
| Latitude_Of_Center | 40 | 11 | |
| Auxiliary_Sphere_Type | 0 | 12 | |
| Patterson | False_Easting | 0 | 0 |
| False_Northing | 0 | 1 | |
| Central_Meridian | 0 | 2 | |
| Perspective_Cylindrical | False_Easting | 0 | 0 |
| False_Northing | 0 | 1 | |
| Central_Meridian | 0 | 2 | |
| Pseudo_Standard_Parallel_1 | 60 | 3 | |
| Latitude_Of_Origin | 0 | 6 | |
| Perspective_Ratio | 1 | 16 | |
| Peirce_quincuncial | False_Easting | 0 | 0 |
| False_Northing | 0 | 1 | |
| Central_Meridian | 0 | 2 | |
| Latitude_Of_Origin | 0 | 6 | |
| Scale_Factor | 1 | 5 | |
| Option | 0 | 15 | |
| Plate_Carree | False_Easting | 0 | 0 |
| False_Northing | 0 | 1 | |
| Central_Meridian | 0 | 2 | |
| Plate_Carree_Oblique | False_Easting | 0 | 0 |
| False_Northing | 0 | 1 | |
| Azimuth | 45 | 7 | |
| Longitude_Of_Center | -75 | 10 | |
| Latitude_Of_Center | 40 | 11 | |
| Polar_Stereographic_Variant_A | False_Easting | 0 | 0 |
| False_Northing | 0 | 1 | |
| Longitude_Of_Origin | 0 | 2 | |
| Scale_Factor | 1 | 5 | |
| Latitude_Of_Origin | 0 | 6 | |
| Polar_Stereographic_Variant_B | False_Easting | 0 | 0 |
| False_Northing | 0 | 1 | |
| Longitude_Of_Origin | 0 | 2 | |
| Standard_Parallel_1 | 60 | 3 | |
| Polar_Stereographic_Variant_C | False_Easting | 0 | 0 |
| False_Northing | 0 | 1 | |
| Longitude_Of_Origin | 0 | 2 | |
| Standard_Parallel_1 | 60 | 3 | |
| Polyconic | False_Easting | 0 | 0 |
| False_Northing | 0 | 1 | |
| Central_Meridian | 0 | 2 | |
| Latitude_Of_Origin | 0 | 6 | |
| Quartic_Authalic | False_Easting | 0 | 0 |
| False_Northing | 0 | 1 | |
| Central_Meridian | 0 | 2 | |
| Quartic_Authalic_Ellipsoidal | False_Easting | 0 | 0 |
| False_Northing | 0 | 1 | |
| Central_Meridian | 0 | 2 | |
| Latitude_Of_Origin | 0 | 6 | |
| Rectified_Skew_Orthomorphic_Center | False_Easting | 0 | 0 |
| False_Northing | 0 | 1 | |
| Scale_Factor | 1 | 5 | |
| Azimuth | 45 | 7 | |
| Longitude_Of_Center | -75 | 10 | |
| Latitude_Of_Center | 40 | 11 | |
| XY_Plane_Rotation | 0 | 14 | |
| Rectified_Skew_Orthomorphic_Natural_Origin | False_Easting | 0 | 0 |
| False_Northing | 0 | 1 | |
| Scale_Factor | 1 | 5 | |
| Azimuth | 45 | 7 | |
| Longitude_Of_Center | -75 | 10 | |
| Latitude_Of_Center | 40 | 11 | |
| XY_Plane_Rotation | 0 | 14 | |
| Robinson | False_Easting | 0 | 0 |
| False_Northing | 0 | 1 | |
| Central_Meridian | 0 | 2 | |
| Robinson_ARC_INFO | False_Easting | 0 | 0 |
| False_Northing | 0 | 1 | |
| Central_Meridian | 0 | 2 | |
| Sinusoidal | False_Easting | 0 | 0 |
| False_Northing | 0 | 1 | |
| Central_Meridian | 0 | 2 | |
| Stereographic | False_Easting | 0 | 0 |
| False_Northing | 0 | 1 | |
| Central_Meridian | 0 | 2 | |
| Scale_Factor | 1 | 5 | |
| Latitude_Of_Origin | 0 | 6 | |
| Stereographic_Auxiliary_Sphere | False_Easting | 0 | 0 |
| False_Northing | 0 | 1 | |
| Central_Meridian | 0 | 2 | |
| Scale_Factor | 1 | 5 | |
| Latitude_Of_Origin | 0 | 6 | |
| Auxiliary_Sphere_Type | 0 | 12 | |
| Stereographic_North_Pole | False_Easting | 0 | 0 |
| False_Northing | 0 | 1 | |
| Central_Meridian | 0 | 2 | |
| Standard_Parallel_1 | 60 | 3 | |
| Stereographic_South_Pole | False_Easting | 0 | 0 |
| False_Northing | 0 | 1 | |
| Central_Meridian | 0 | 2 | |
| Standard_Parallel_1 | 60 | 3 | |
| Times | False_Easting | 0 | 0 |
| False_Northing | 0 | 1 | |
| Central_Meridian | 0 | 2 | |
| Tobler_Cylindrical_I | False_Easting | 0 | 0 |
| False_Northing | 0 | 1 | |
| Central_Meridian | 0 | 2 | |
| Tobler_Cylindrical_II | False_Easting | 0 | 0 |
| False_Northing | 0 | 1 | |
| Central_Meridian | 0 | 2 | |
| Transverse_Mercator | False_Easting | 0 | 0 |
| False_Northing | 0 | 1 | |
| Central_Meridian | 0 | 2 | |
| Scale_Factor | 1 | 5 | |
| Latitude_Of_Origin | 0 | 6 | |
| Transverse_Cylindrical_Equal_Area | False_Easting | 0 | 0 |
| False_Northing | 0 | 1 | |
| Central_Meridian | 0 | 2 | |
| Scale_Factor | 1 | 5 | |
| Latitude_Of_Origin | 0 | 6 | |
| Transverse_Mercator_Complex | False_Easting | 0 | 0 |
| False_Northing | 0 | 1 | |
| Central_Meridian | 0 | 2 | |
| Scale_Factor | 1 | 5 | |
| Latitude_Of_Origin | 0 | 6 | |
| Transverse_Mercator_NGA_2014 | False_Easting | 0 | 0 |
| False_Northing | 0 | 1 | |
| Central_Meridian | 0 | 2 | |
| Scale_Factor | 1 | 5 | |
| Latitude_Of_Origin | 0 | 6 | |
| Two_Point_Equidistant | False_Easting | 0 | 0 |
| False_Northing | 0 | 1 | |
| Latitude_Of_1st_Point | 0 | 3 | |
| Latitude_Of_2nd_Point | 60 | 4 | |
| Longitude_Of_1st_Point | 0 | 8 | |
| Longitude_Of_2nd_Point | 60 | 9 | |
| Van_der_Grinten_I | False_Easting | 0 | 0 |
| False_Northing | 0 | 1 | |
| Central_Meridian | 0 | 2 | |
| Van_der_Grinten_I_Auxiliary_Sphere | False_Easting | 0 | 0 |
| False_Northing | 0 | 1 | |
| Central_Meridian | 0 | 2 | |
| Auxiliary_Sphere_Type | 0 | 12 | |
| Vertical_Near_Side_Perspective | False_Easting | 0 | 0 |
| False_Northing | 0 | 1 | |
| Longitude_Of_Center | -75 | 10 | |
| Latitude_Of_Center | 40 | 11 | |
| Height | 0 | 14 | |
| Wagner_IV | False_Easting | 0 | 0 |
| False_Northing | 0 | 1 | |
| Central_Meridian | 0 | 2 | |
| Latitude_Of_Origin | 0 | 6 | |
| Wagner_V | False_Easting | 0 | 0 |
| False_Northing | 0 | 1 | |
| Central_Meridian | 0 | 2 | |
| Wagner_VII | False_Easting | 0 | 0 |
| False_Northing | 0 | 1 | |
| Central_Meridian | 0 | 2 | |
| Latitude_Of_Origin | 0 | 6 | |
| Winkel_I | False_Easting | 0 | 0 |
| False_Northing | 0 | 1 | |
| Central_Meridian | 0 | 2 | |
| Standard_Parallel_1 | 60 | 3 | |
| Winkel_II | False_Easting | 0 | 0 |
| False_Northing | 0 | 1 | |
| Central_Meridian | 0 | 2 | |
| Standard_Parallel_1 | 60 | 3 | |
| Winkel_Tripel | False_Easting | 0 | 0 |
| False_Northing | 0 | 1 | |
| Central_Meridian | 0 | 2 | |
| Standard_Parallel_1 | 60 | 3 | |
2.7.3: Projection Methods to Reduce Specific Distortion
Certain projections are designed to reduce specific error throughout a map. Starting with the developable surfaces, we will look at five of the more common methods used to reduce specific distortion: equal area, conformal serve the purpose of preserving shape, distance, and bearing, at the expense of area and scale , equidistant, true direction, and compromise projections attempt to balance all of the distortions in one map. This means that none of the six are "perfect", but each one is is balance with the others, the idea being that no one place is grossly distorted in comparison to any other place on the map .
Equal Area
The goal of equal area maps, as the name suggests, is to create a map where each of the land masses represented is given an equal amount of area. Equal area projections are useful where relative size and area accuracy of map features is important (such as displaying countries / continents in world maps), as well as for showing spatial distributions and general thematic mapping such as population, soil and geological maps.
In the image to the right, the map is covered by a series of orange ellipses, called distortion ellipses start as circles placed on the globe. As the projection technically: the result of using one of variety of methods to transfer the geographic locations of features from a geographic coordinate system to a developable surface everyday use: any coordinate system, geographic or projected is created, the distortion ellipses distort in a manner equal to the map's distortion at the place upon which they are centered. This method allows for a user to visualize the map's distortion without any measuring equipment. . Distortion ellipses, known as Tissot’s indicatrix, start a circles placed on the globe. As the projection technically: the result of using one of variety of methods to transfer the geographic locations of features from a geographic coordinate system to a developable surface everyday use: any coordinate system, geographic or projected is created, the distortion ellipses start as circles placed on the globe. As the projection technically: the result of using one of variety of methods to transfer the geographic locations of features from a geographic coordinate system to a developable surface everyday use: any coordinate system, geographic or projected is created, the distortion ellipses distort in a manner equal to the map's distortion at the place upon which they are centered. This method allows for a user to visualize the map's distortion without any measuring equipment. distort in a manner equal to the map’s distortion at the place upon which they are centered. This method allows for a user to visualize the map’s distortion without any measuring equipment. Distortion ellipses do not show up on the final map; they are for visualization purposes only. When we examine the distortion of the ellipses, the shape is distorted, but the area remains constant throughout. This tells us that area is the factor being preserved.
| Figure 2.32: Gall-Peters cylindrical equal-area projection technically: the result of using one of variety of methods to transfer the geographic locations of features from a geographic coordinate system to a developable surface everyday use: any coordinate system, geographic or projected |
|---|
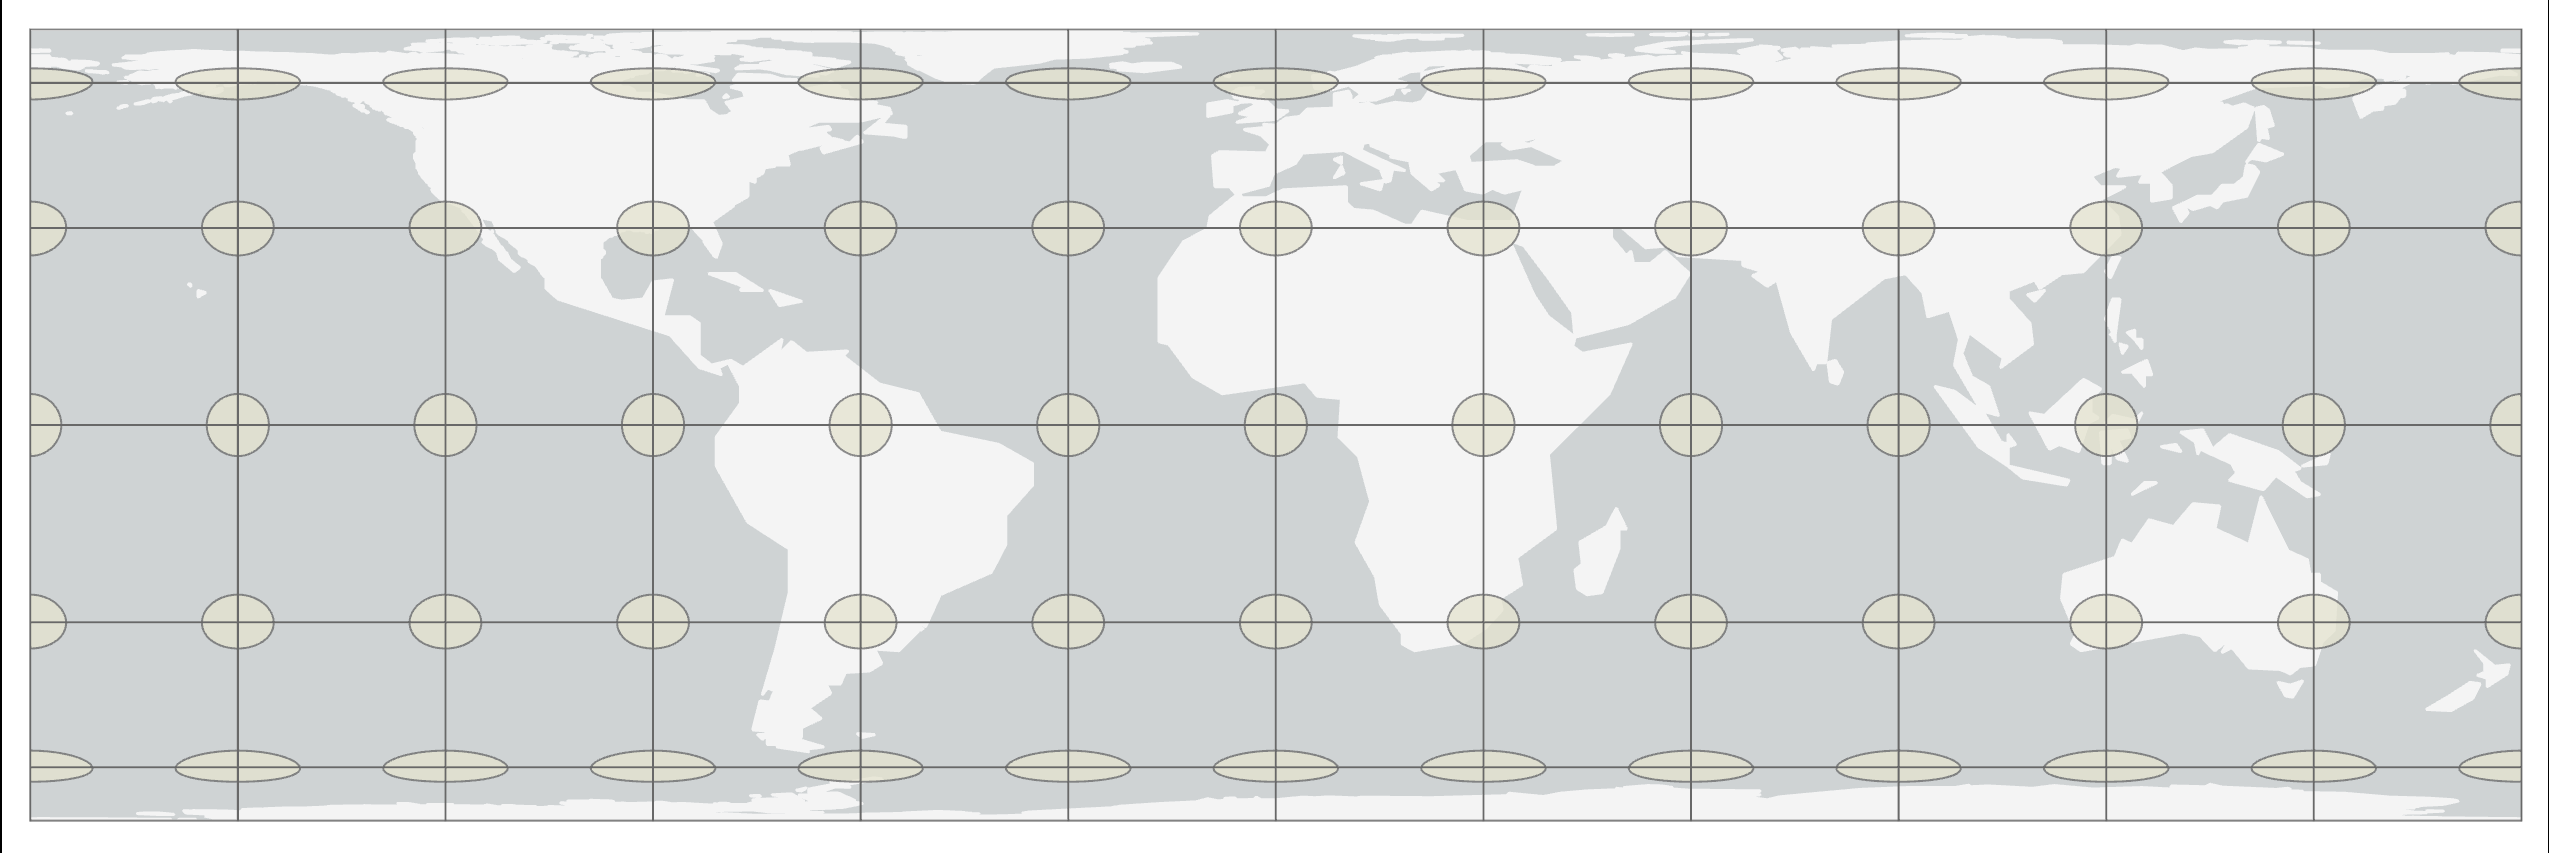 |
Conformal
Conformal maps serve the purpose of preserving shape, distance, and bearing, at the expense of area and scale. Just like in the West Wing clip and the BuzzFeed “Maps Lie”, it is explained continents away from the Equator are larger in size. When we understand that it is impossible to preserve all six characteristics and conformal serve the purpose of preserving shape, distance, and bearing, at the expense of area and scale maps, such as the Mercator projection technically: the result of using one of variety of methods to transfer the geographic locations of features from a geographic coordinate system to a developable surface everyday use: any coordinate system, geographic or projected , aim to preserve shape and distance, we then understand that Mercator had no intentions of “lying” to anyone, nor did he want to create social inequality. He just wanted a quality map to navigate with. Preservation of shape, distance, and bearing makes conformal serve the purpose of preserving shape, distance, and bearing, at the expense of area and scale map projections suitable for navigation charts, weather maps, topographic mapping, and large scale surveying.
In the image, we see the distortion ellipses start as circles placed on the globe. As the projection technically: the result of using one of variety of methods to transfer the geographic locations of features from a geographic coordinate system to a developable surface everyday use: any coordinate system, geographic or projected is created, the distortion ellipses distort in a manner equal to the map's distortion at the place upon which they are centered. This method allows for a user to visualize the map's distortion without any measuring equipment. as circles. This tells us the shape is preserved, but area is distorted away from the Equator. Looking at this image, is the Mercator projection technically: the result of using one of variety of methods to transfer the geographic locations of features from a geographic coordinate system to a developable surface everyday use: any coordinate system, geographic or projected a tangent or secant developable surface a geometric shape which will not be distorted when flattened. Used as the base shape to transfer features during projections. Most often a cone, cylinder, or plane (azimuthal) ?
| Figure 2.33: Mercator - Conformal Projection Method |
|---|
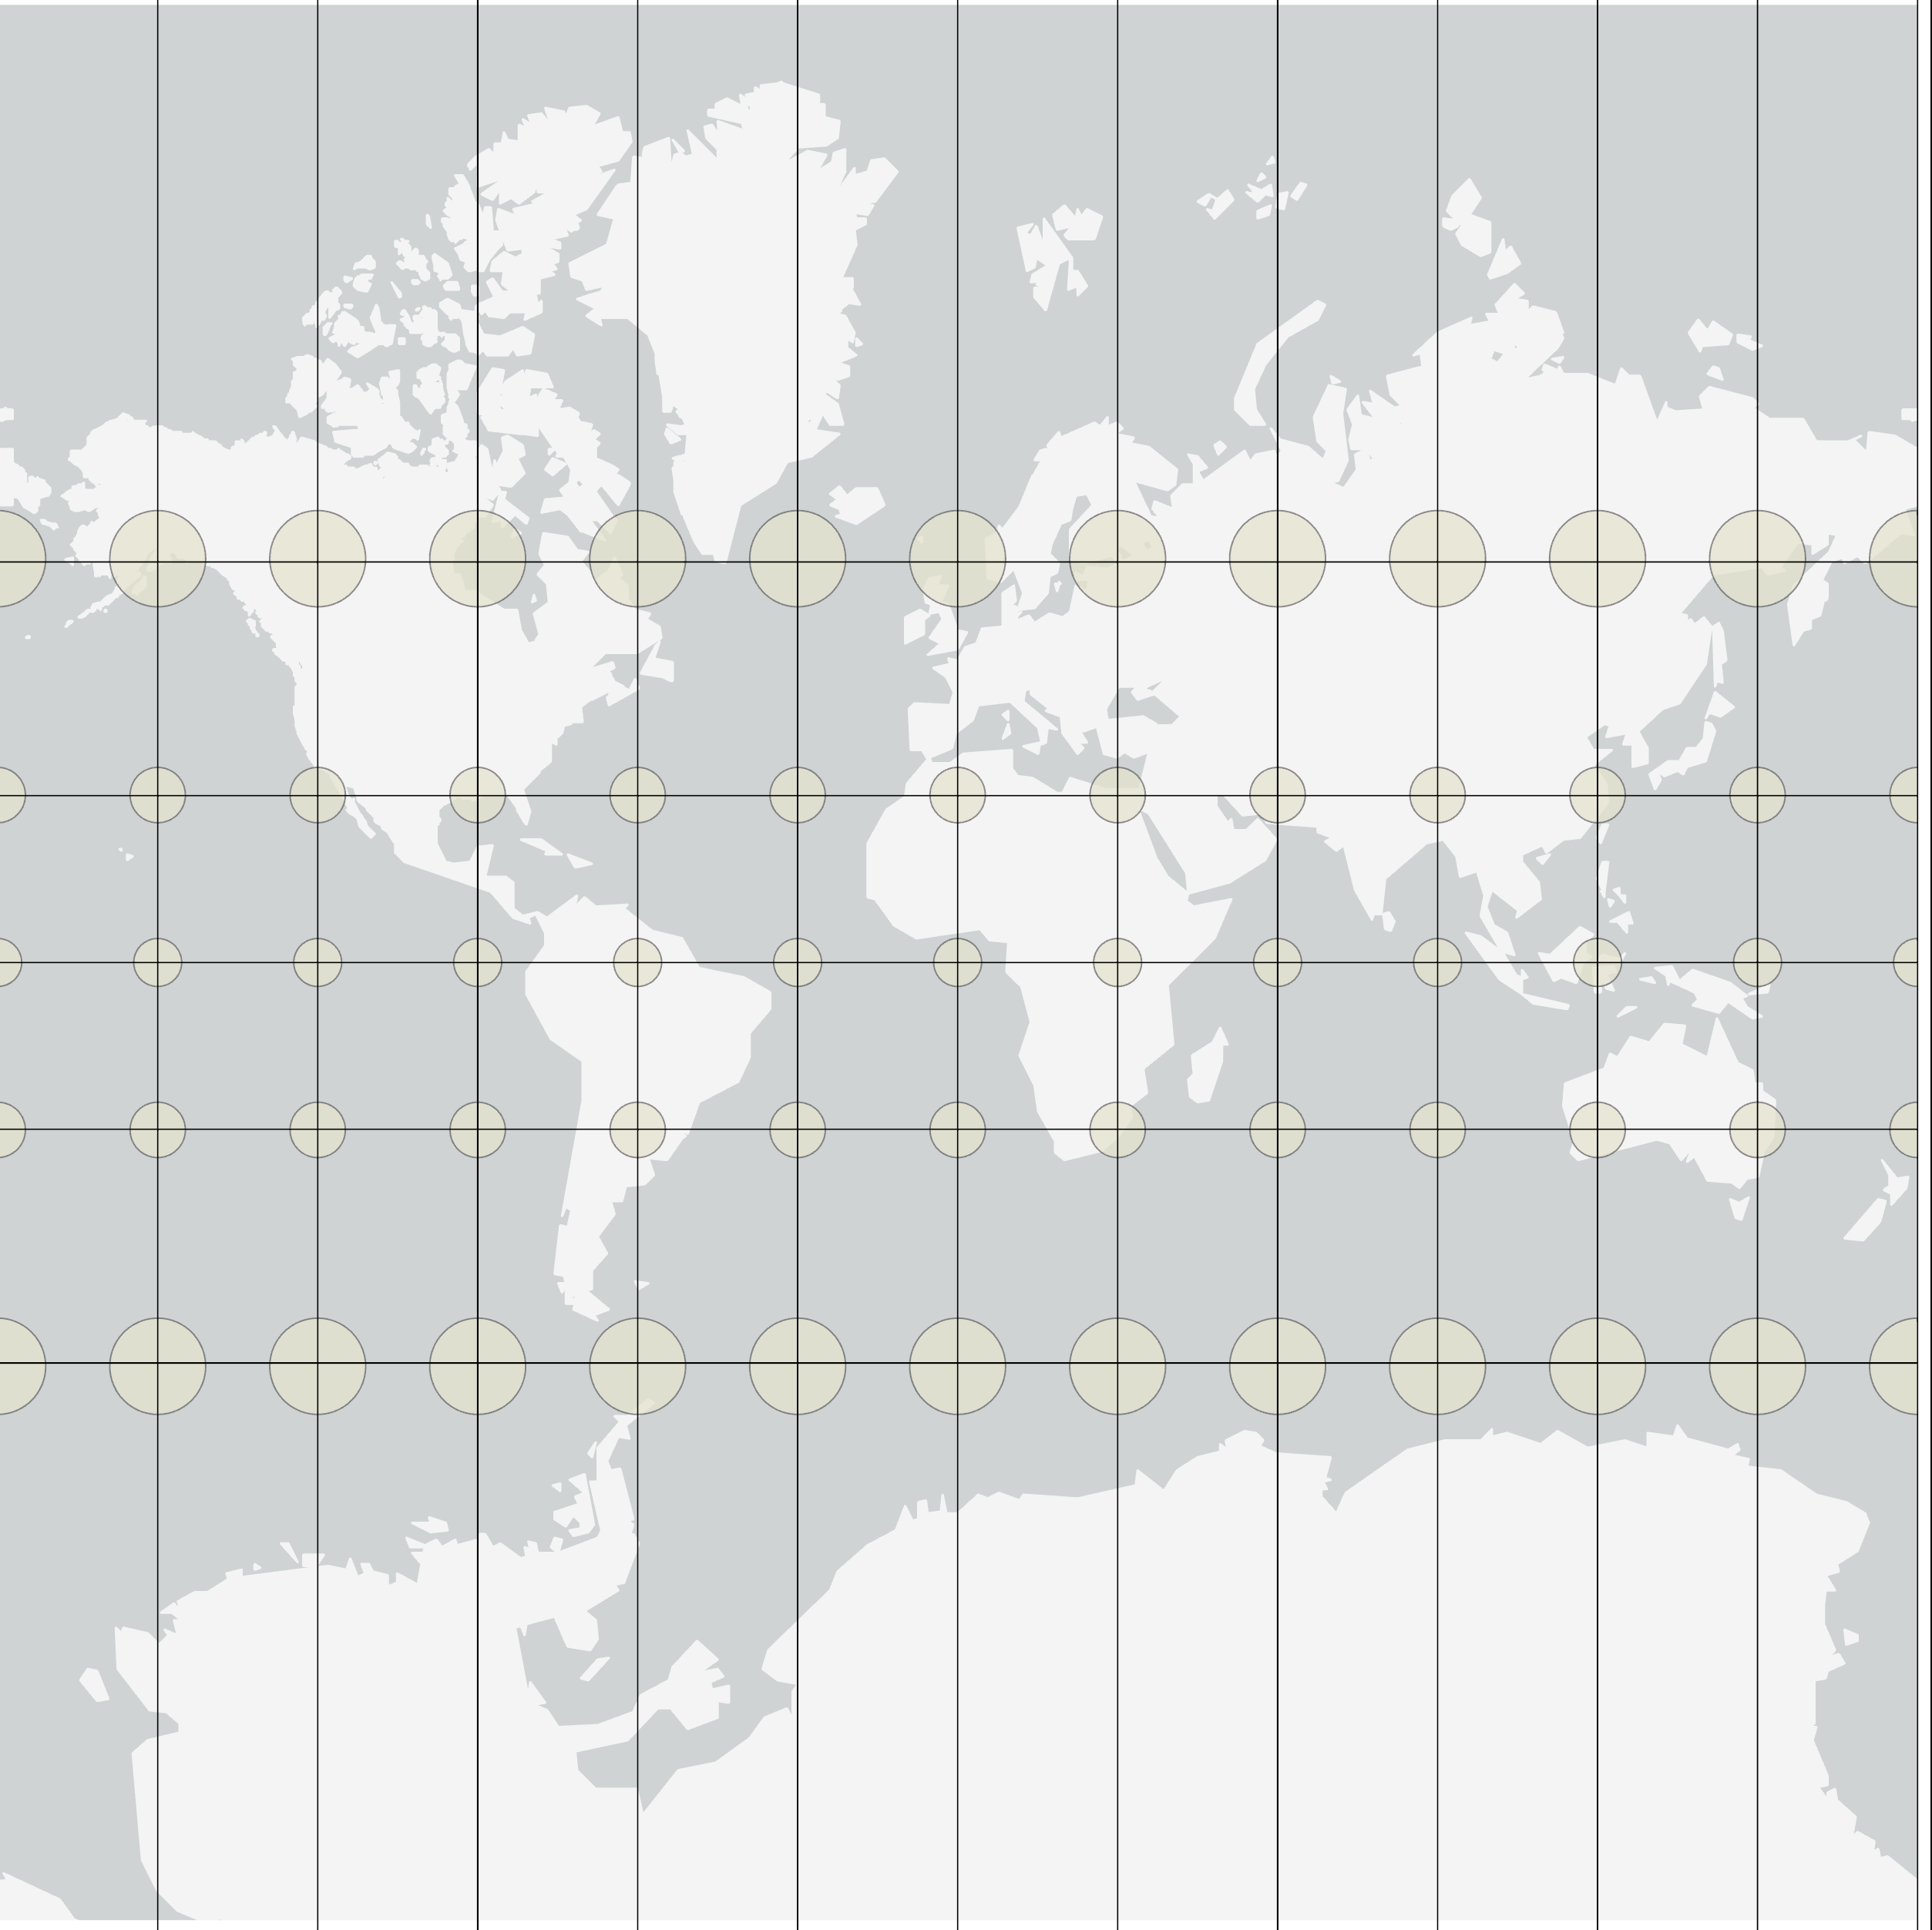 |
Equidistant
Equidistant, similar but different then conformal serve the purpose of preserving shape, distance, and bearing, at the expense of area and scale projections, aim to preserve distance, but only from the tangential line or lines. This means that when you use an equidistant map, the measured distance from the place where the developable surface a geometric shape which will not be distorted when flattened. Used as the base shape to transfer features during projections. Most often a cone, cylinder, or plane (azimuthal) came into contact with the globe will be correct, but distances measured between other points will be incorrect. Equidistant projections are used in air and sea navigation charts, as well as radio and seismic mapping. They are also used in atlases and thematic mapping.
In the image, we see the ellipses as circles which are not distorted in shape or size at the equator, but become increasingly so as you move away. When compared to the conformal serve the purpose of preserving shape, distance, and bearing, at the expense of area and scale example, we see the continents becoming distorted in shape, but the distortion ellipses start as circles placed on the globe. As the projection technically: the result of using one of variety of methods to transfer the geographic locations of features from a geographic coordinate system to a developable surface everyday use: any coordinate system, geographic or projected is created, the distortion ellipses distort in a manner equal to the map's distortion at the place upon which they are centered. This method allows for a user to visualize the map's distortion without any measuring equipment. do not stop far from the north and south edges.
| Figure 2.34: Equidistant Projection Method | ||
|---|---|---|
| 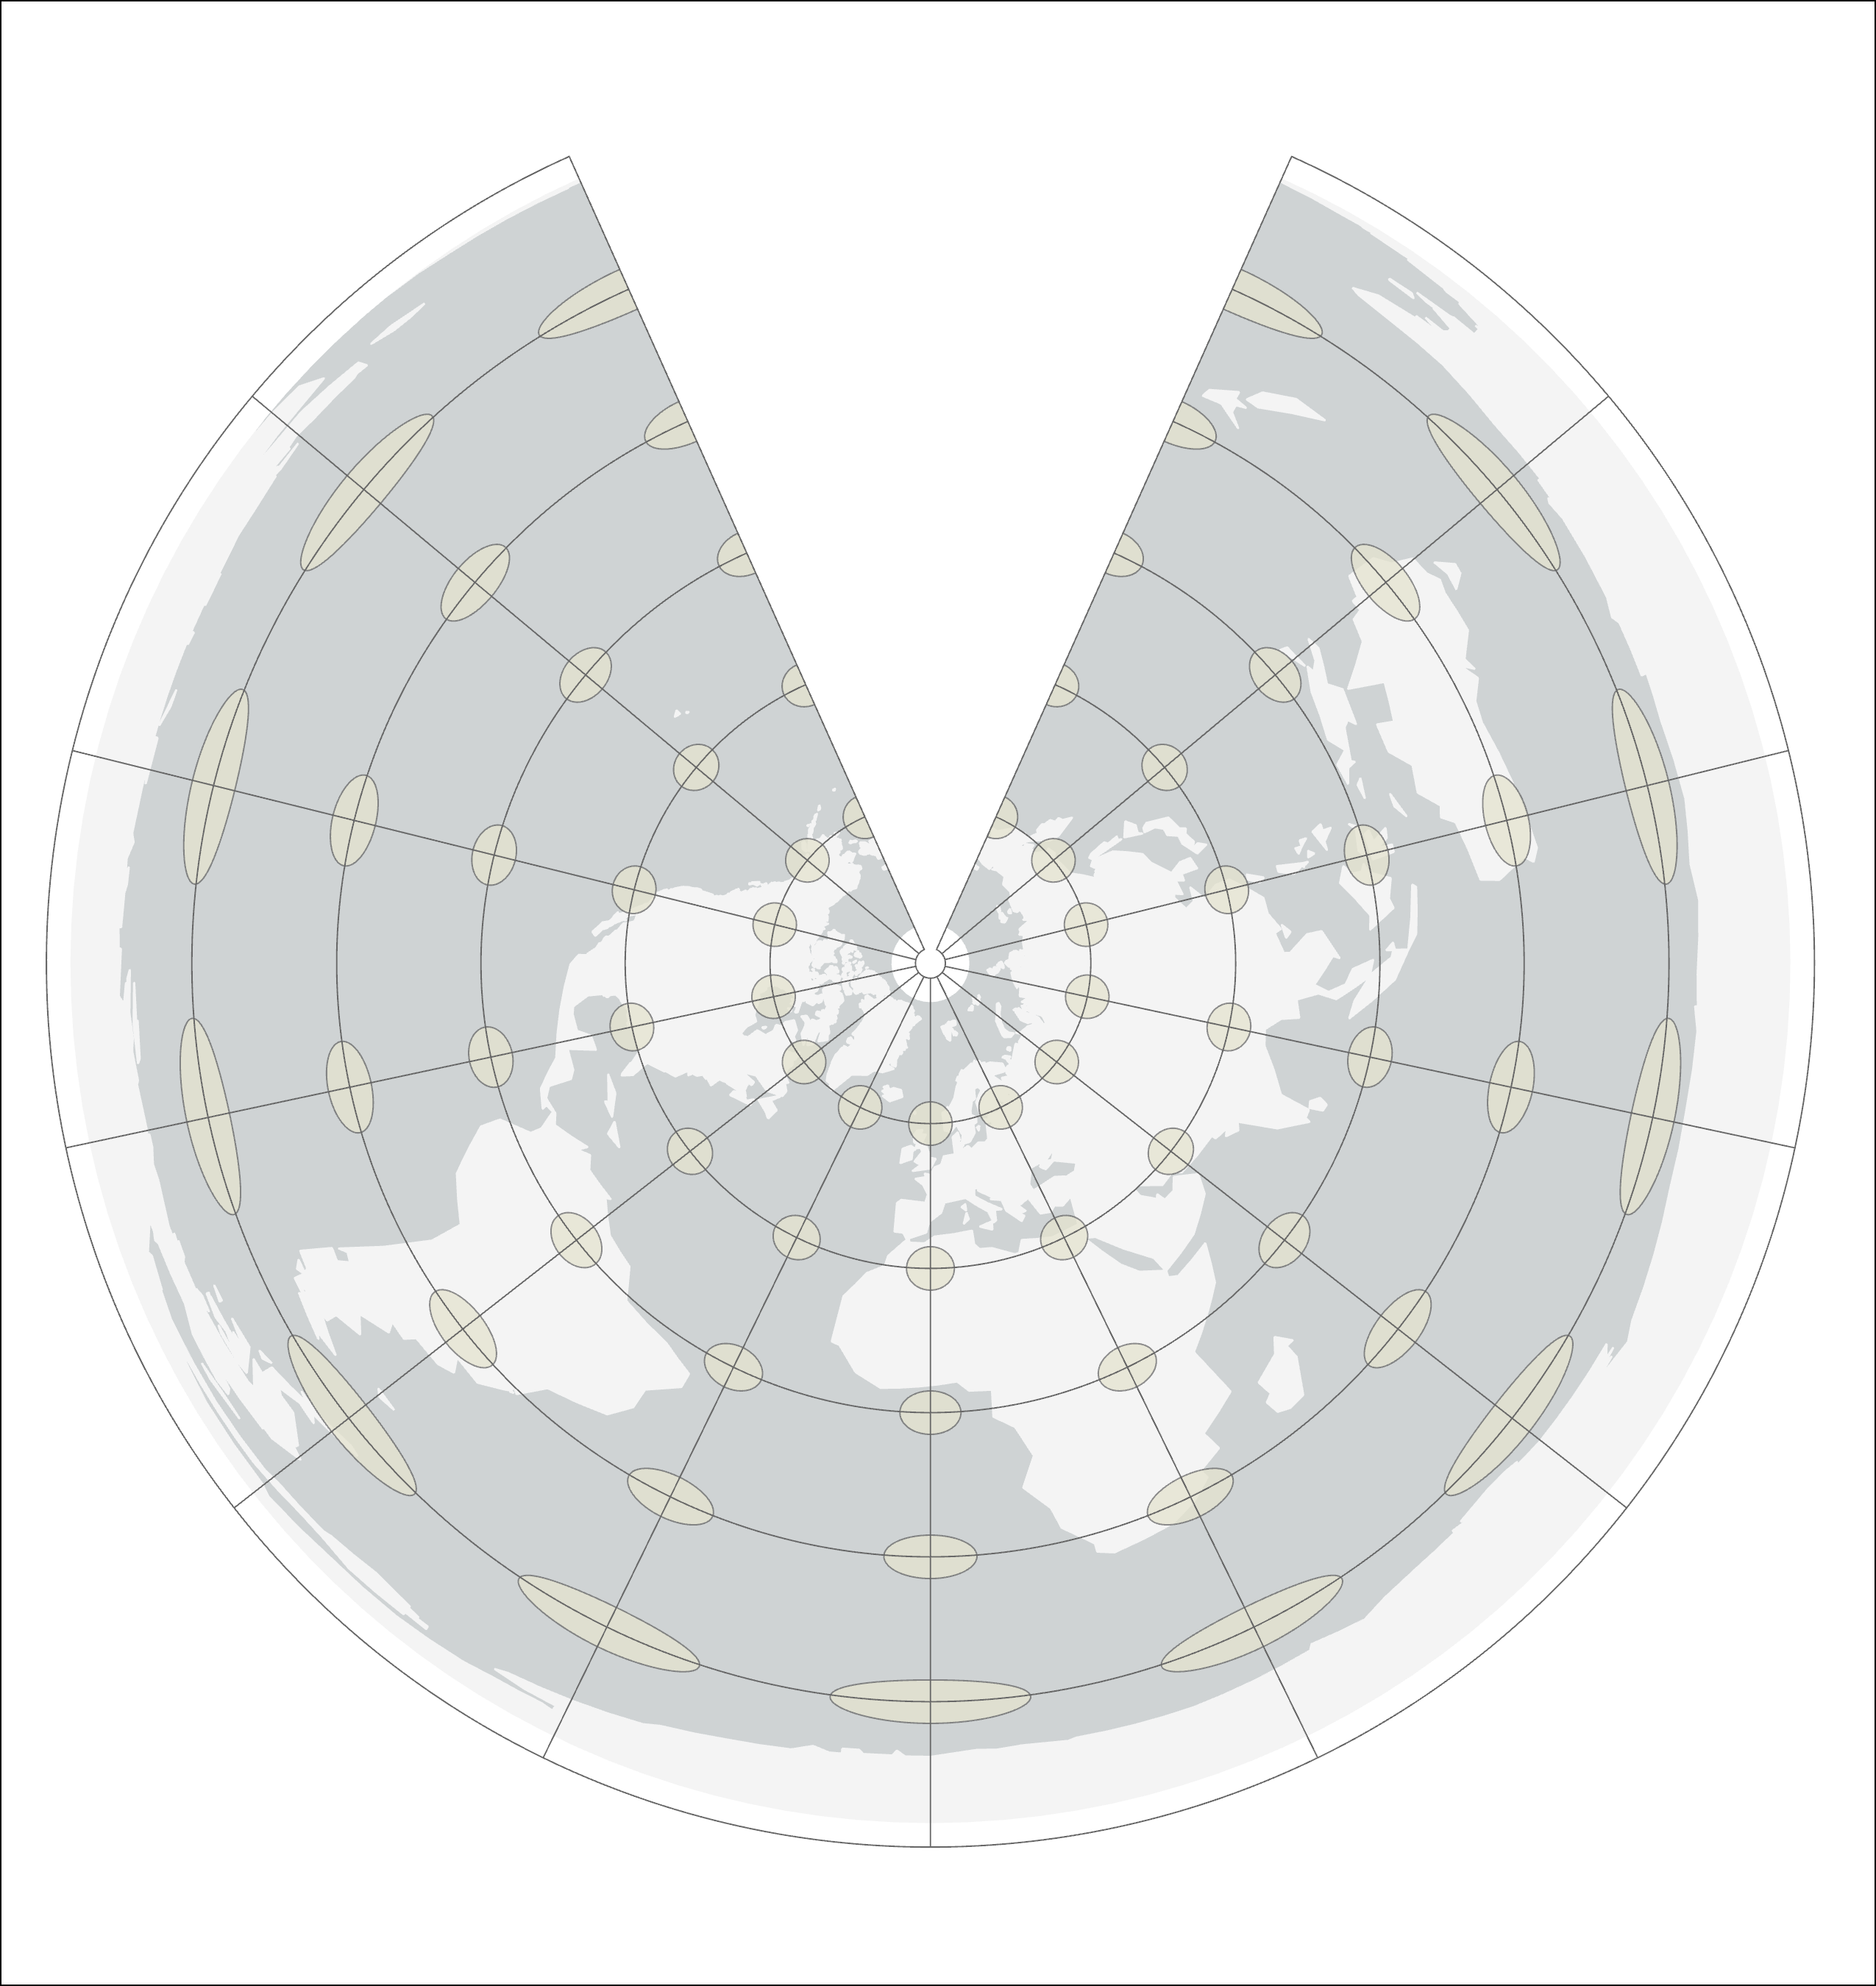 | |
Equidistant Cylindrical | Equidistant Conical | Equidistant Azimuthal |
True Direction
Similar to the equidistant projection technically: the result of using one of variety of methods to transfer the geographic locations of features from a geographic coordinate system to a developable surface everyday use: any coordinate system, geographic or projected , which starts with a cylindrical developable surface a geometric shape which will not be distorted when flattened. Used as the base shape to transfer features during projections. Most often a cone, cylinder, or plane (azimuthal) , true direction starts with an azimuthal developable surface a geometric shape which will not be distorted when flattened. Used as the base shape to transfer features during projections. Most often a cone, cylinder, or plane (azimuthal) . Much like your oblique gnomonic projection technically: the result of using one of variety of methods to transfer the geographic locations of features from a geographic coordinate system to a developable surface everyday use: any coordinate system, geographic or projected , all directions and bearing away from the Washington Monument are preserved, but if you were to measure between Los Angeles and New York, the measurement will be incorrect. True-direction projections are used in applications where maintaining directional relationships are important, such as aeronautical and sea navigation charts.
Compromise
Compromise projections attempt to balance all of the distortions in one map. This means that none of the six are “perfect”, but each one is is balance with the others, the idea being that no one place is grossly distorted in comparison to any other place on the map. Compromise maps are used to preserve the look of the finished product, a wall or book map, for example. Two common types of compromise projections attempt to balance all of the distortions in one map. This means that none of the six are "perfect", but each one is is balance with the others, the idea being that no one place is grossly distorted in comparison to any other place on the map maps are the Robinson and Winkel Tripel projection technically: the result of using one of variety of methods to transfer the geographic locations of features from a geographic coordinate system to a developable surface everyday use: any coordinate system, geographic or projected (both of which we will look at in lab).
In the image, which is a Robinson projection technically: the result of using one of variety of methods to transfer the geographic locations of features from a geographic coordinate system to a developable surface everyday use: any coordinate system, geographic or projected , we see none of the ellipses are terribly distorted in size, shape, or distance from each other. But because they are all distorted in all six ways, this map wouldn’t be perfect for navigation, nor preserving area for measurements, nor comparing the shapes to a globe.
| Figure 2.35: Robinson Projection Method |
|---|
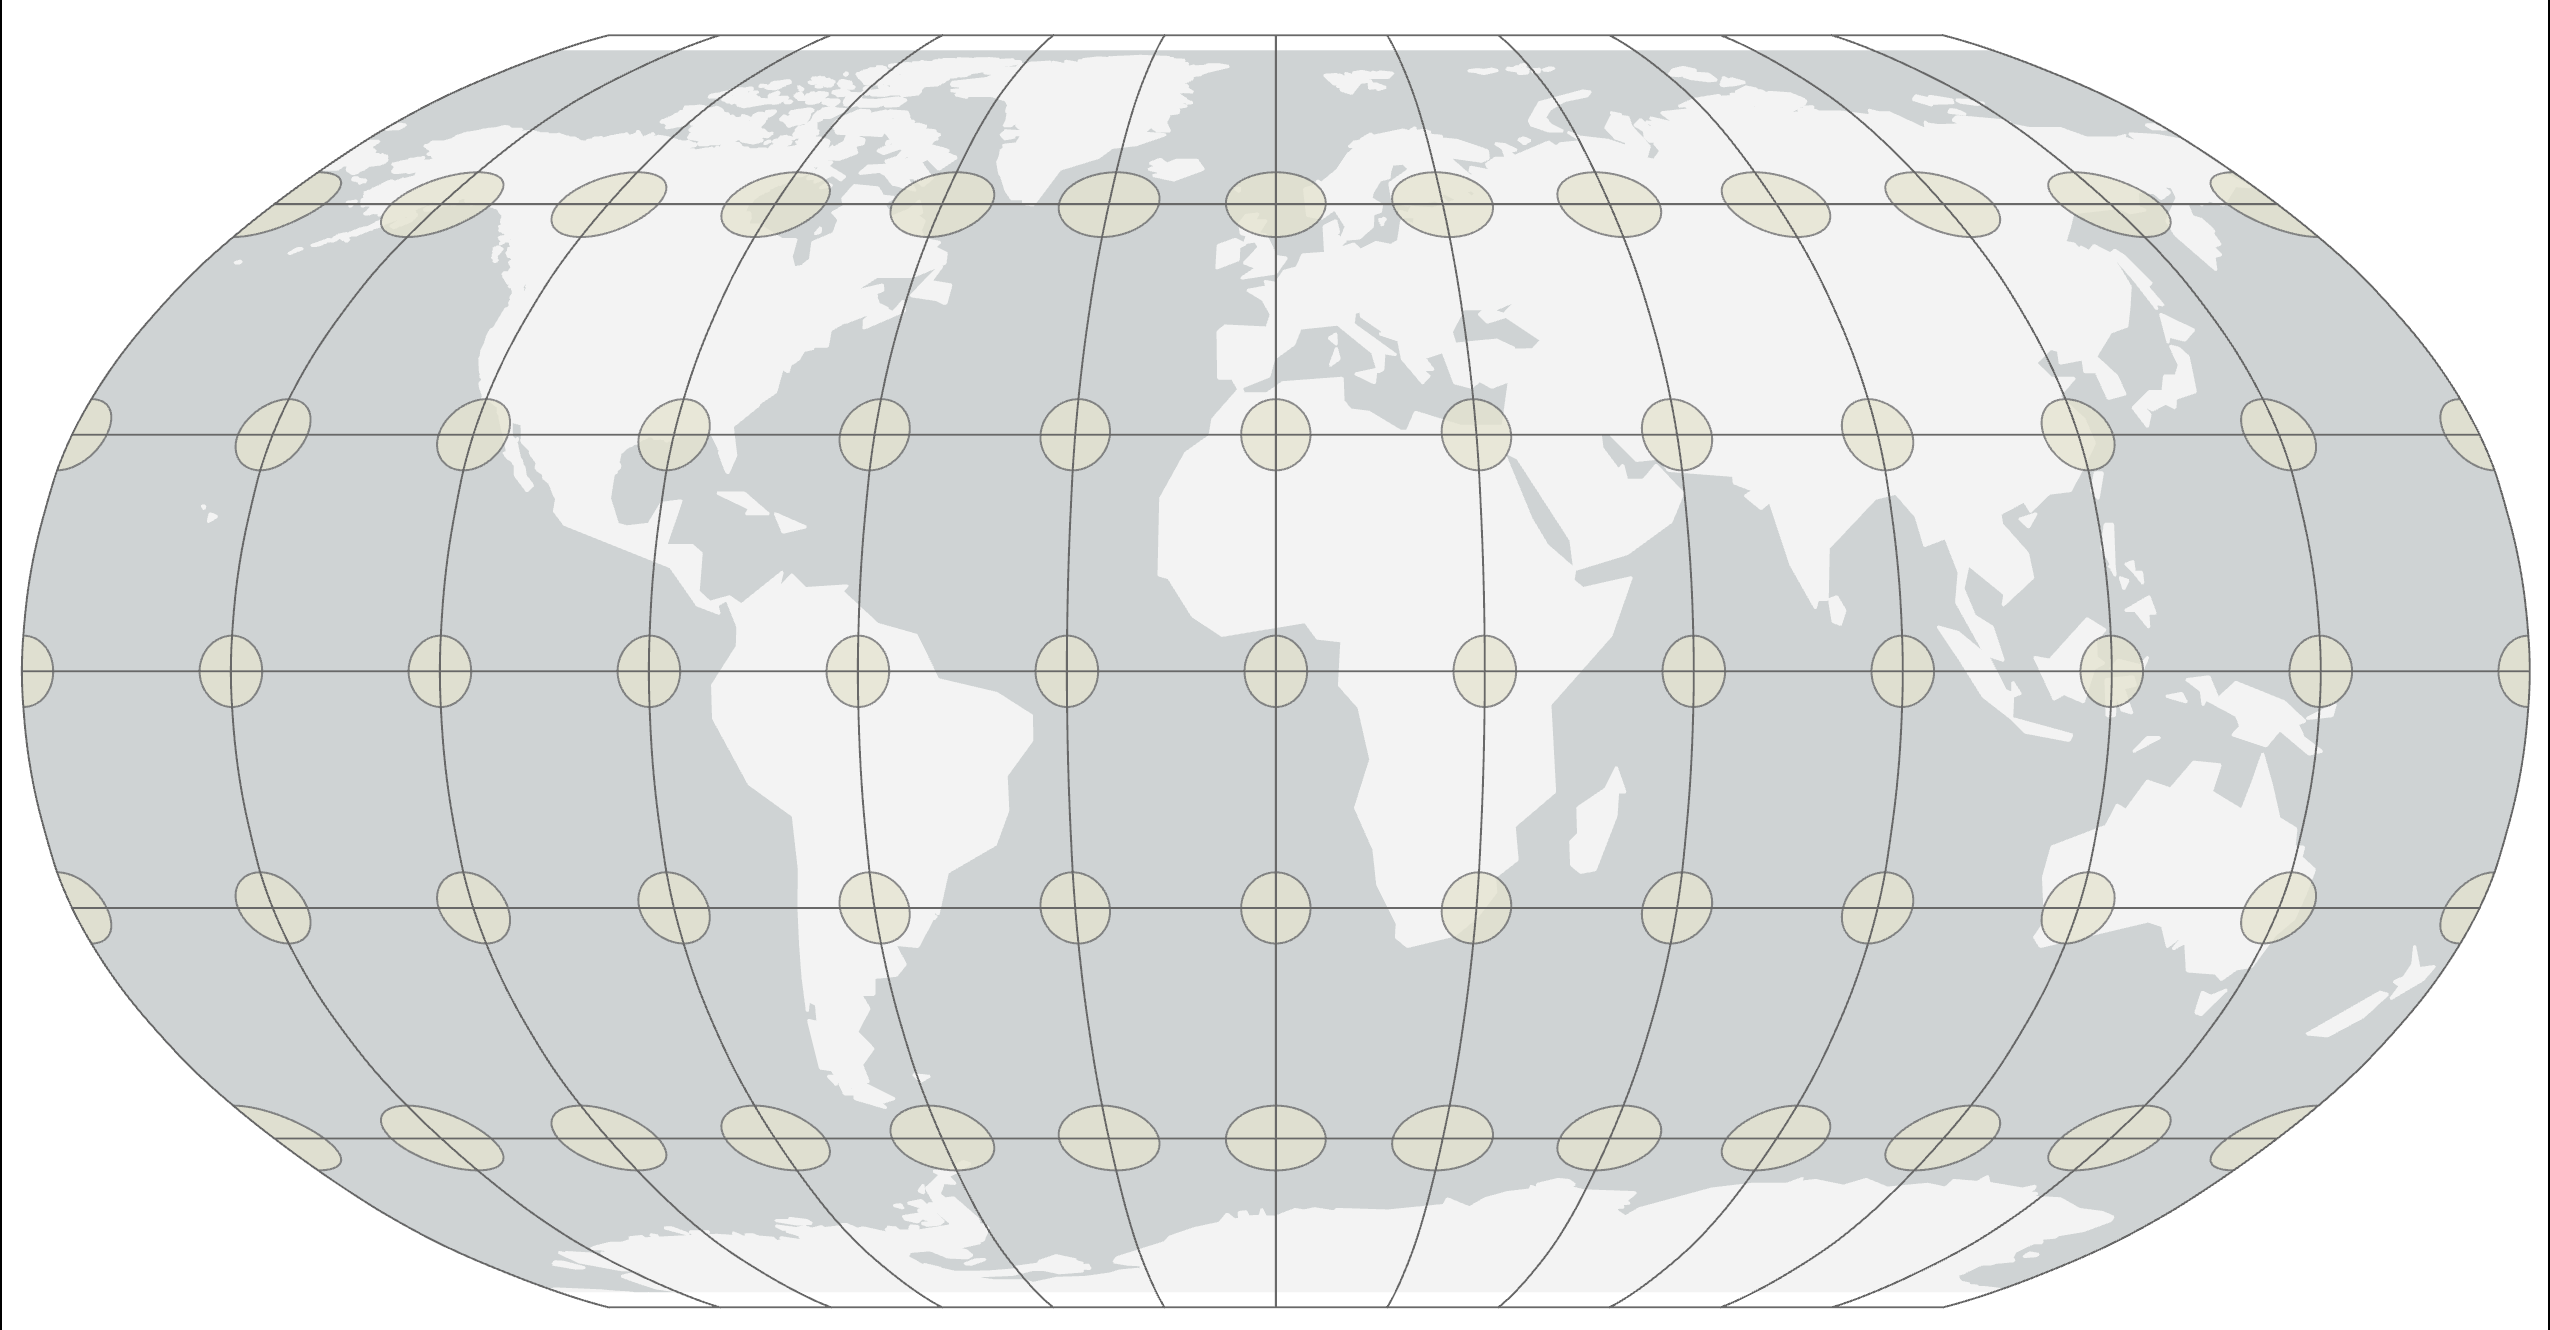 |