Once historians measured the Earth, the next task was to create maps, used for navigation and exploration. In order to accomplish this task, they first needed to create a model of the Earth, upon which the oceans and continents could be represented, to scale and neatly labeled. The process in actually more complicated then presented in this class, but it is very important to understand the basics to understand how the GIS Geographic Information Systems the software used to create, store, and manage spatial data Data that deals with location, such as lists of addresses, the footprint of a building, the boundaries of cities and counties, etc. , analyze spatial problems, and display the data in cartographic layouts Geographic Information Sciences software accurately represents the Earth.
The process of modeling the Earth takes the topographic surface a detailed map of the surface features of land. It includes the mountains, hills, creeks, and other bumps and lumps on a particular hunk of earth. The word is a Greek-rooted combo of topos meaning "place" and graphein "to write." and simplifies it into a geoid a model of the variation between global mean (average) sea level and local mean sea level the measurement above or below the global average at a single point A GIS vector data in any sort of digital science or art, is simply denoting a type of graphical representation using straight lines to construct the outlines of objects geometry type which is made up of just one vertex pl. vertices One of a set of ordered x,y coordinate pairs that defines the shape of a line or polygon feature. , marking a single XY location in any given geographic or projected coordinate system. on the Earth's surface used for recording the elevation of topographic surface a detailed map of the surface features of land. It includes the mountains, hills, creeks, and other bumps and lumps on a particular hunk of earth. The word is a Greek-rooted combo of topos meaning "place" and graphein "to write." 's relief the difference between the highest and lowest point within a particular area while landforms are the descriptive words for individual features , which is used to measure precise elevations on the topographic surface a detailed map of the surface features of land. It includes the mountains, hills, creeks, and other bumps and lumps on a particular hunk of earth. The word is a Greek-rooted combo of topos meaning "place" and graphein "to write." (or a model of the variation between global and local mean sea level the measurement above or below the global average at a single point A GIS vector data in any sort of digital science or art, is simply denoting a type of graphical representation using straight lines to construct the outlines of objects geometry type which is made up of just one vertex pl. vertices One of a set of ordered x,y coordinate pairs that defines the shape of a line or polygon feature. , marking a single XY location in any given geographic or projected coordinate system. on the Earth's surface used for recording the elevation of topographic surface a detailed map of the surface features of land. It includes the mountains, hills, creeks, and other bumps and lumps on a particular hunk of earth. The word is a Greek-rooted combo of topos meaning "place" and graphein "to write." 's relief the difference between the highest and lowest point within a particular area while landforms are the descriptive words for individual features ), which is then paired with a reference ellipsoid an ellipsoid that is drawn to best-fit an area. World reference ellipsoids are drawn to best-fit the entire geoid; local ellipsoids are best fit on one side to a single place of the geoid (where, as we will see, the actual map is drawn) to create a Geographic Coordinate System (or a means of creating a labeled grid for marking and navigating to locations on the Earth's surface, independent of language or local customs). Once we have a Geographic Coordinate System, we can make a whole series of accurate and precise maps using a projection technically: the result of using one of variety of methods to transfer the geographic locations of features from a geographic coordinate system to a developable surface everyday use: any coordinate system, geographic or projected method to create Projected Coordinate Systems. Both Geographic and Projected Coordinate Systems are a means of labeling locations and measuring land and ocean masses, just with different strengths and weaknesses.
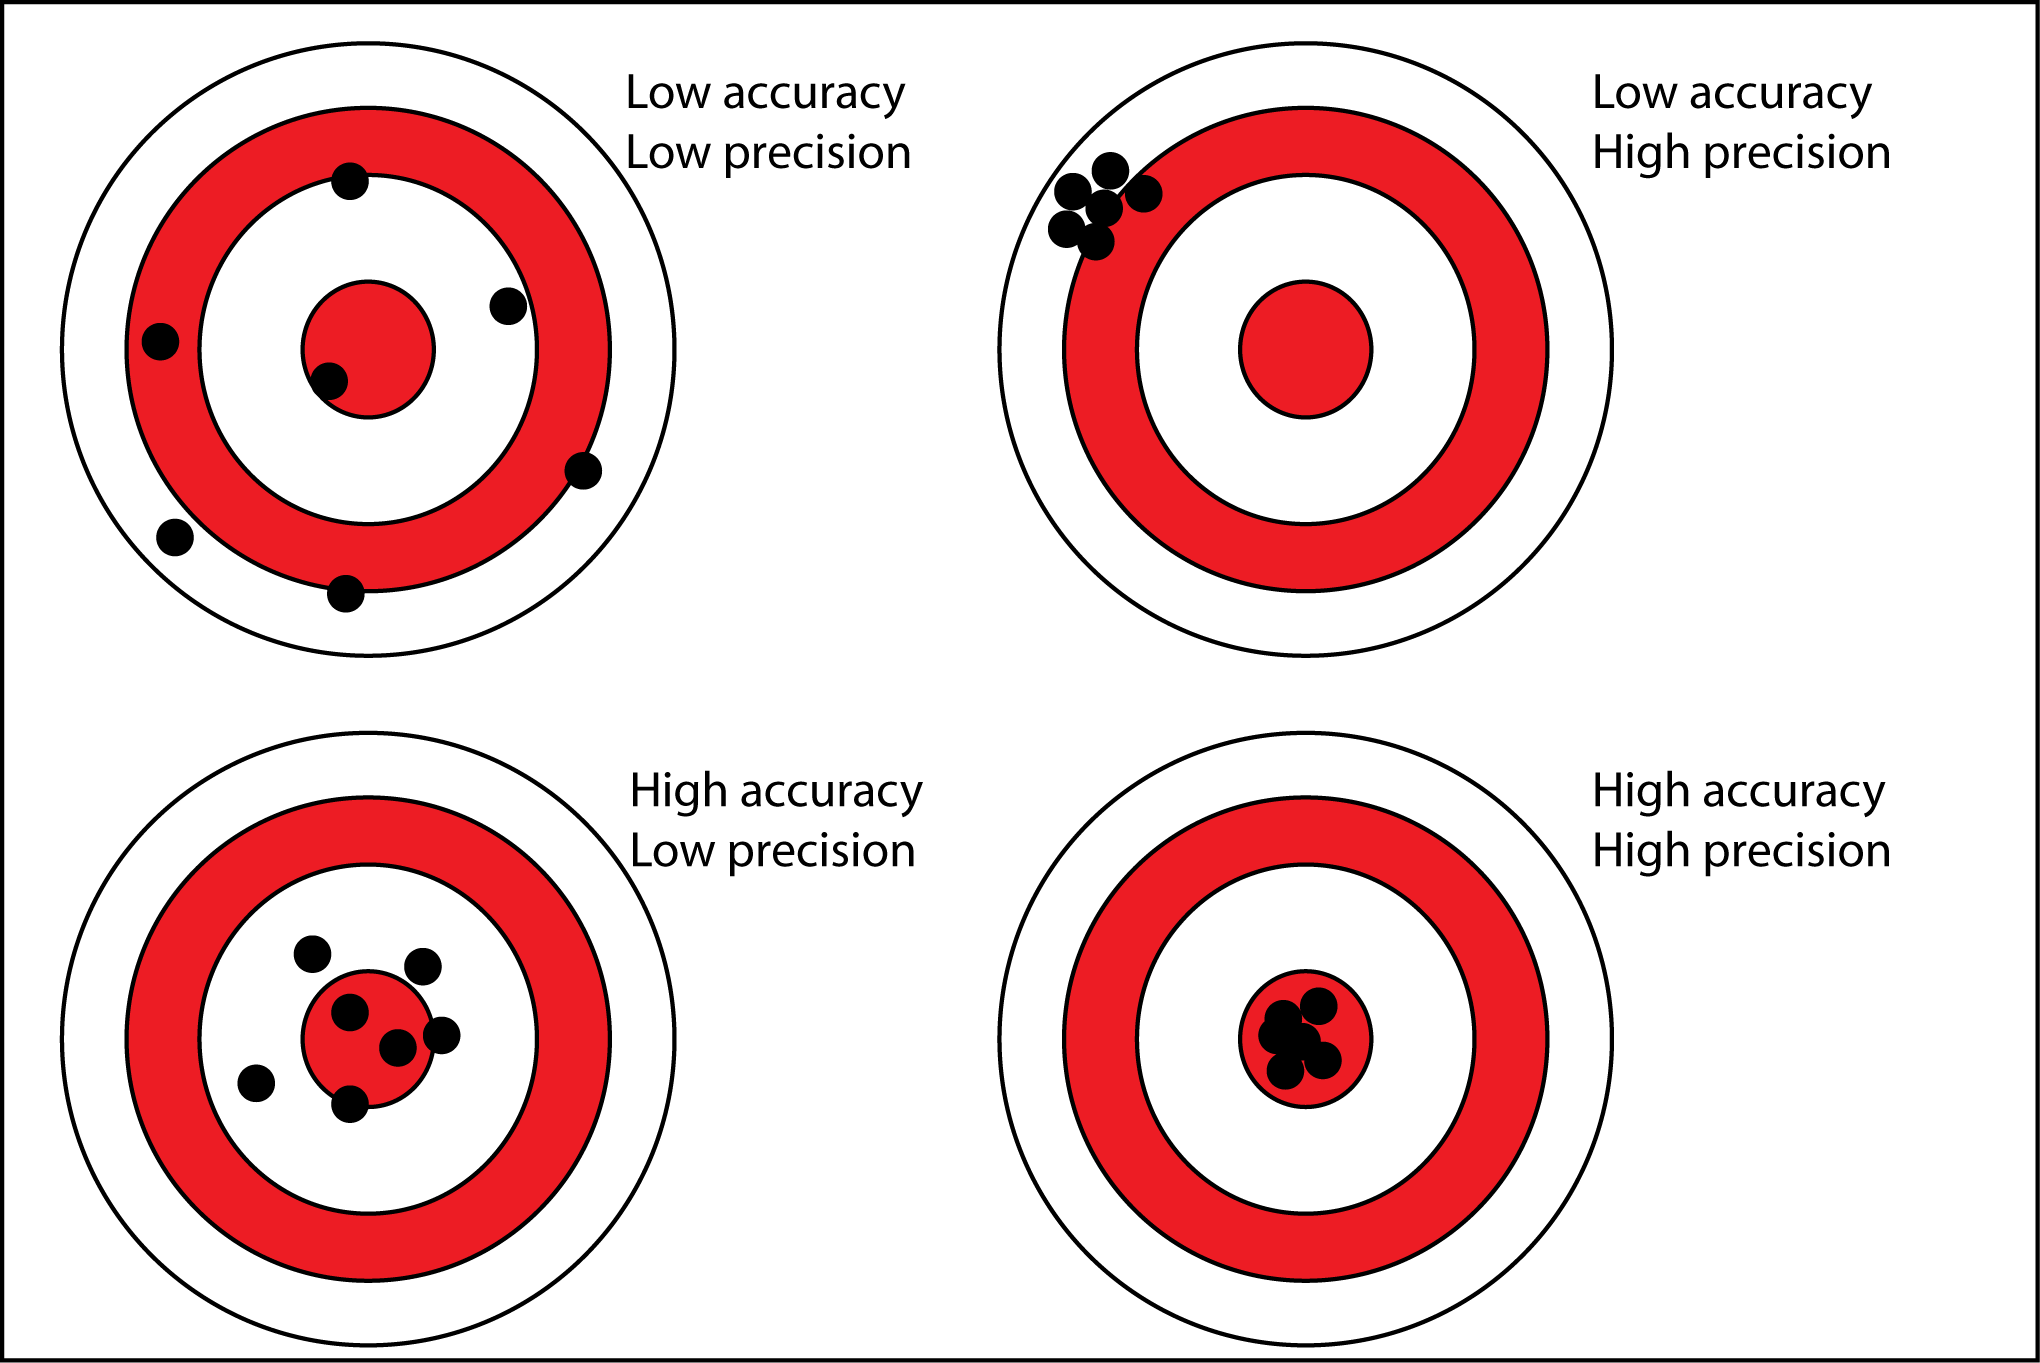
2.3.1: Accuracy and Precision
| Accuracy vs Precision | |
|---|---|
| Accuracy is defined as the ability to hit your target Precision is defined as the ability to repeat your results almost exactly the same every time Error, in GIS Geographic Information Systems the software used to create, store, and manage spatial data Data that deals with location, such as lists of addresses, the footprint of a building, the boundaries of cities and counties, etc. , analyze spatial problems, and display the data in cartographic layouts Geographic Information Sciences and Cartography, is defined as the linear distance between the represented data and reality. Results are considered both accurate and precise when the results are “on target”, every time. This concept is used in many scientific disciplines, but in GIS Geographic Information Systems the software used to create, store, and manage spatial data Data that deals with location, such as lists of addresses, the footprint of a building, the boundaries of cities and counties, etc. , analyze spatial problems, and display the data in cartographic layouts Geographic Information Sciences and Cartography, we use accurate and precise to define when our analysis and display are as close to the real world as possible, with as little error as possible. |
|
2.3.2: Global Navigation Satellite System (GNSS)
The Global Navigation Satellite System or GNSS Global Navigation Satellite System: A general term for the technology of using satellites and a signal receiver to pin- point A GIS vector data in any sort of digital science or art, is simply denoting a type of graphical representation using straight lines to construct the outlines of objects geometry type which is made up of just one vertex pl. vertices One of a set of ordered x,y coordinate pairs that defines the shape of a line or polygon feature. , marking a single XY location in any given geographic or projected coordinate system. a location anywhere on the surface of the Earth is a general term for the technology of using satellites and a signal receiver to pin- point A GIS vector data in any sort of digital science or art, is simply denoting a type of graphical representation using straight lines to construct the outlines of objects geometry type which is made up of just one vertex pl. vertices One of a set of ordered x,y coordinate pairs that defines the shape of a line or polygon feature. , marking a single XY location in any given geographic or projected coordinate system. a location anywhere on the surface of the Earth. Positional satellites orbiting the Earth are constantly emitting a signal, just waiting for a receiver to pick it up. People on Earth purchase GNSS Global Navigation Satellite System: A general term for the technology of using satellites and a signal receiver to pin- point A GIS vector data in any sort of digital science or art, is simply denoting a type of graphical representation using straight lines to construct the outlines of objects geometry type which is made up of just one vertex pl. vertices One of a set of ordered x,y coordinate pairs that defines the shape of a line or polygon feature. , marking a single XY location in any given geographic or projected coordinate system. a location anywhere on the surface of the Earth capable units and use the signal to accomplish any number of location-based data collection, from creating a history of their latest run or mark out the boundary of a recent wildfire.
While GNSS Global Navigation Satellite System: A general term for the technology of using satellites and a signal receiver to pin- point A GIS vector data in any sort of digital science or art, is simply denoting a type of graphical representation using straight lines to construct the outlines of objects geometry type which is made up of just one vertex pl. vertices One of a set of ordered x,y coordinate pairs that defines the shape of a line or polygon feature. , marking a single XY location in any given geographic or projected coordinate system. a location anywhere on the surface of the Earth is a general term, the system specific to lands under the jurisdiction of the United States is GPS Global Positioning System: A satellite-based navigation system owned and operated by the United States Department of Defense that provides location and time information anywhere on Earth. [2] a term you are probably more familiar with. The United States owns and operates a current constellation of 31 satellites, launching a total of 68 different satellites since 1987. Like all thing mechanical, many of the 68 have been retired or failed (just two of those!) over the years. With a plan of constant coverage, plans for new satellites and future retirements are always in the works.
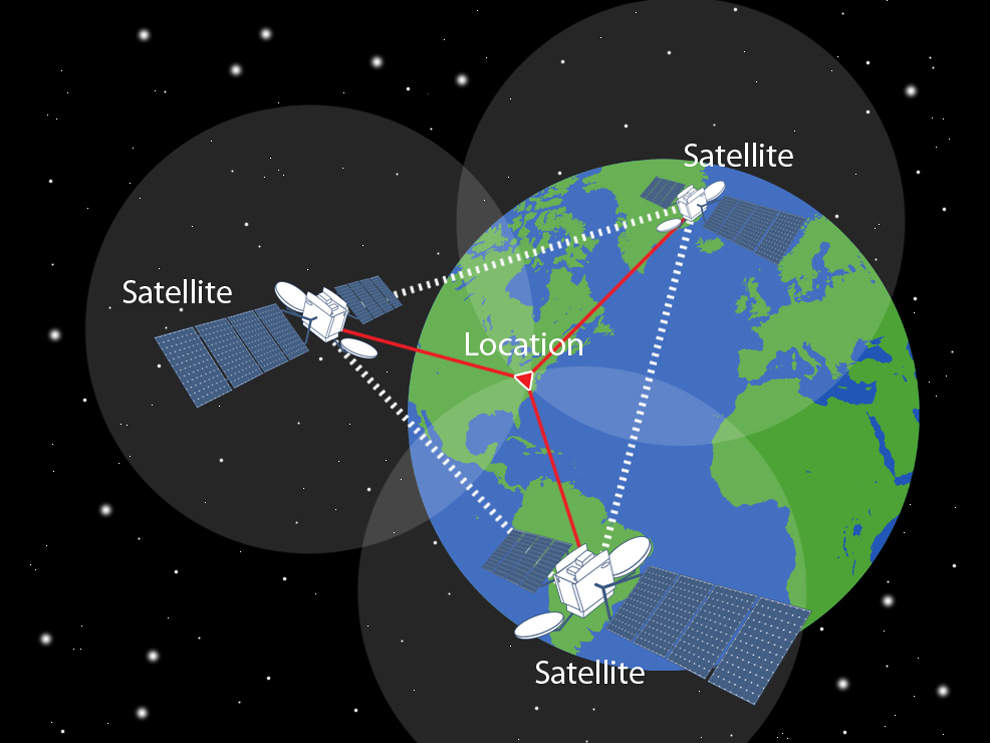
But how do the satellites “know” where you are? Trilateration[3]
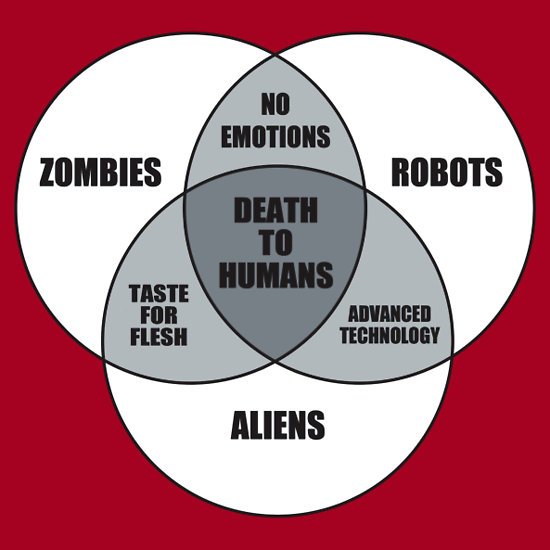
You get all geared up for your run. You head outside with your favorite running app fired up and start to move. After a few minutes "arc minute" 1/60th of a degree. Usually denoted by " you look down and the darn thing still says “Acquiring GPS Global Positioning System: A satellite-based navigation system owned and operated by the United States Department of Defense that provides location and time information anywhere on Earth. data”. You’ve learned from past experience that if you stop moving for a minute or two, the app will acquire that data faster then if you keep moving. Your phone is searching for not one, but at least three satellites to be emitting a signal in the area. As it finds one signal, the signal tells the phone the range of area which its owner could possibly be standing. When your smart phone finds a second signal, it calculates the possible overlap of the two maximum signal areas. Once a third satellite is found and the signal captured, your phone goes to work solving a triangle, noting the overlap of the three signal areas, much like a Venn diagram and where we get the name trilateration the process of determining absolute or relative locations of points by measurement of distances, using the geometry of circles, spheres or triangles. ... In contrast to triangulation, it does not involve the measurement of angles .
| FIGURE 2.6: Venn Diagram |
|---|
|
Your phone give you the green light and you’re off to the races. But it doesn’t stop there. For every additional satellite it captures, the possible area overlap shrinks and the pinpoint accuracy becomes even greater. If you kept moving while your smartphone was trying to capture satellite signals and trilateration the process of determining absolute or relative locations of points by measurement of distances, using the geometry of circles, spheres or triangles. ... In contrast to triangulation, it does not involve the measurement of angles your location, the geometry of you location keeps changing, and while that is the whole point A GIS vector data in any sort of digital science or art, is simply denoting a type of graphical representation using straight lines to construct the outlines of objects geometry type which is made up of just one vertex pl. vertices One of a set of ordered x,y coordinate pairs that defines the shape of a line or polygon feature. , marking a single XY location in any given geographic or projected coordinate system. of GPS Global Positioning System: A satellite-based navigation system owned and operated by the United States Department of Defense that provides location and time information anywhere on Earth. , to note your changing location and record the values, trying to solve the problem with a moving object is much harder.
| FIGURE 2.7: Trilateration |
|---|
|
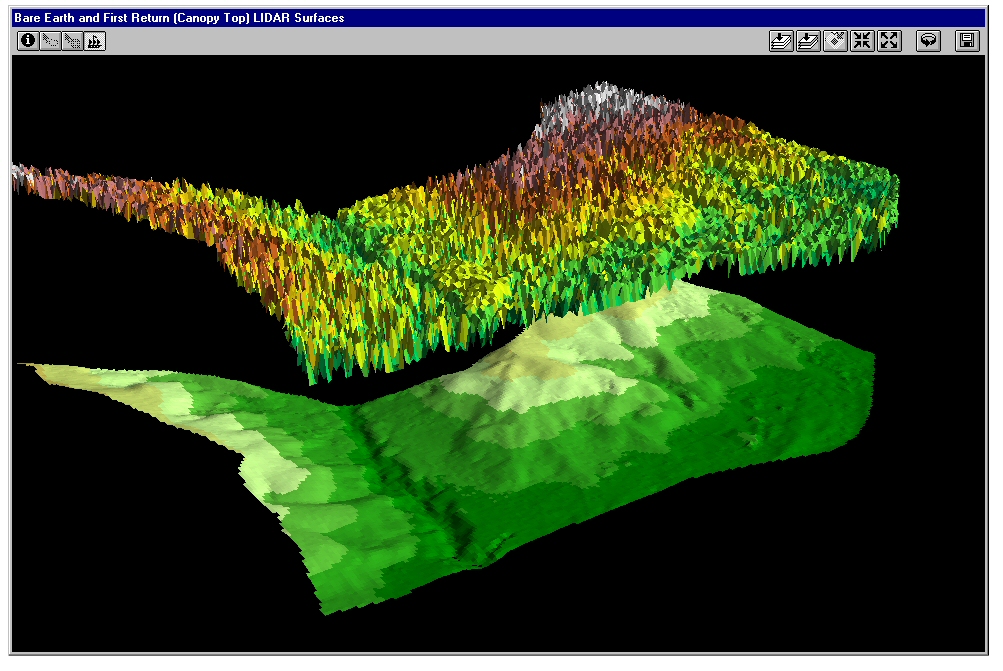
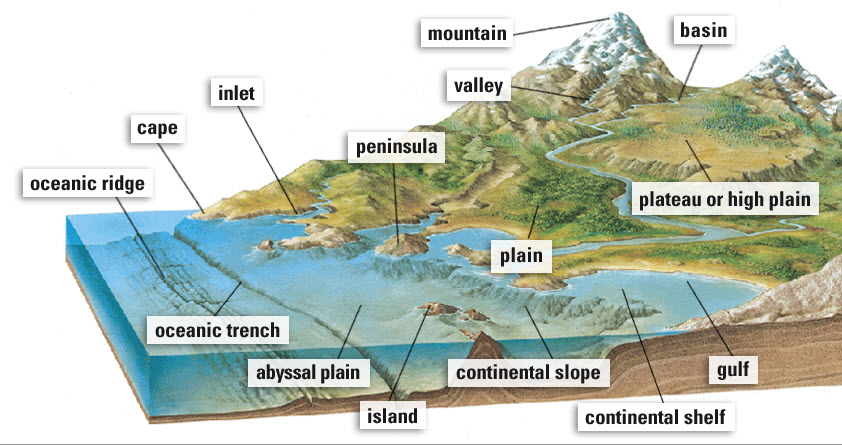
2.3.3: The Topographic Surface
The surface of the Earth which you have been walking upon for your entire life is known in Geospatial Sciences as the Topographic Surface. This surface is the relief the difference between the highest and lowest point within a particular area while landforms are the descriptive words for individual features you see when you look out your window and is described using specific landforms the descriptive words for individual features on the topographic surface a detailed map of the surface features of land. It includes the mountains, hills, creeks, and other bumps and lumps on a particular hunk of earth. The word is a Greek-rooted combo of topos meaning "place" and graphein "to write." , such as "hills", "valley", and "ridgelines" . Relief can be defined as the difference between the highest and lowest point A GIS vector data in any sort of digital science or art, is simply denoting a type of graphical representation using straight lines to construct the outlines of objects geometry type which is made up of just one vertex pl. vertices One of a set of ordered x,y coordinate pairs that defines the shape of a line or polygon feature. , marking a single XY location in any given geographic or projected coordinate system. within a particular area while landforms the descriptive words for individual features on the topographic surface a detailed map of the surface features of land. It includes the mountains, hills, creeks, and other bumps and lumps on a particular hunk of earth. The word is a Greek-rooted combo of topos meaning "place" and graphein "to write." , such as "hills", "valley", and "ridgelines" are the descriptive words for individual features. Due to a lack of high mountains and deep lakes, parts of Kansas are often equated to pancakes where the Rocky Mountains have a great variation throughout, with high craggy peaks, deep lakes, and wide valleys.
As these are most likely concepts you already understand from, you know, being alive, these are the places and things cartographers and GIS Geographic Information Systems the software used to create, store, and manage spatial data Data that deals with location, such as lists of addresses, the footprint of a building, the boundaries of cities and counties, etc. , analyze spatial problems, and display the data in cartographic layouts Geographic Information Sciences technicians wish to map and measure. One person may need to know how far it is from The United Kingdom to the New World in order to pack supplies, while another needs to understand the area and topographic makeup of the Amazon Region to measure the loss or gain of rainforest over time.
| Figure 2.8: Topographic Surface and Relief | |
|---|---|
|
|
2.3.4: Geoids
In order to begin the process of mapping the Earth, cartographers and geodesists simplify the Earth just a bit using a mathematical model called a geoid a model of the variation between global mean (average) sea level and local mean sea level the measurement above or below the global average at a single point A GIS vector data in any sort of digital science or art, is simply denoting a type of graphical representation using straight lines to construct the outlines of objects geometry type which is made up of just one vertex pl. vertices One of a set of ordered x,y coordinate pairs that defines the shape of a line or polygon feature. , marking a single XY location in any given geographic or projected coordinate system. on the Earth's surface used for recording the elevation of topographic surface a detailed map of the surface features of land. It includes the mountains, hills, creeks, and other bumps and lumps on a particular hunk of earth. The word is a Greek-rooted combo of topos meaning "place" and graphein "to write." 's relief the difference between the highest and lowest point within a particular area while landforms are the descriptive words for individual features , which is used to measure precise elevations on the topographic surface a detailed map of the surface features of land. It includes the mountains, hills, creeks, and other bumps and lumps on a particular hunk of earth. The word is a Greek-rooted combo of topos meaning "place" and graphein "to write." . The idea of a geoid a model of the variation between global mean (average) sea level and local mean sea level the measurement above or below the global average at a single point A GIS vector data in any sort of digital science or art, is simply denoting a type of graphical representation using straight lines to construct the outlines of objects geometry type which is made up of just one vertex pl. vertices One of a set of ordered x,y coordinate pairs that defines the shape of a line or polygon feature. , marking a single XY location in any given geographic or projected coordinate system. on the Earth's surface used for recording the elevation of topographic surface a detailed map of the surface features of land. It includes the mountains, hills, creeks, and other bumps and lumps on a particular hunk of earth. The word is a Greek-rooted combo of topos meaning "place" and graphein "to write." 's relief the difference between the highest and lowest point within a particular area while landforms are the descriptive words for individual features , which is used to measure precise elevations on the topographic surface a detailed map of the surface features of land. It includes the mountains, hills, creeks, and other bumps and lumps on a particular hunk of earth. The word is a Greek-rooted combo of topos meaning "place" and graphein "to write." is most likely a new one to you as an introduction to GIS Geographic Information Systems the software used to create, store, and manage spatial data Data that deals with location, such as lists of addresses, the footprint of a building, the boundaries of cities and counties, etc. , analyze spatial problems, and display the data in cartographic layouts Geographic Information Sciences student, so let's first define it and then look at how one is created, and finish up with why it is used cartographers and geodesists.
Defining the Geoid
The geoid a model of the variation between global mean (average) sea level and local mean sea level the measurement above or below the global average at a single point A GIS vector data in any sort of digital science or art, is simply denoting a type of graphical representation using straight lines to construct the outlines of objects geometry type which is made up of just one vertex pl. vertices One of a set of ordered x,y coordinate pairs that defines the shape of a line or polygon feature. , marking a single XY location in any given geographic or projected coordinate system. on the Earth's surface used for recording the elevation of topographic surface a detailed map of the surface features of land. It includes the mountains, hills, creeks, and other bumps and lumps on a particular hunk of earth. The word is a Greek-rooted combo of topos meaning "place" and graphein "to write." 's relief the difference between the highest and lowest point within a particular area while landforms are the descriptive words for individual features , which is used to measure precise elevations on the topographic surface a detailed map of the surface features of land. It includes the mountains, hills, creeks, and other bumps and lumps on a particular hunk of earth. The word is a Greek-rooted combo of topos meaning "place" and graphein "to write." can be defined as: a model of the variation between global mean sea level the average of the sea level as affected by the pull of gravity when there is a finite amount of water upon a model of the Earth. (GMSL)and local mean sea level the measurement above or below the global average at a single point A GIS vector data in any sort of digital science or art, is simply denoting a type of graphical representation using straight lines to construct the outlines of objects geometry type which is made up of just one vertex pl. vertices One of a set of ordered x,y coordinate pairs that defines the shape of a line or polygon feature. , marking a single XY location in any given geographic or projected coordinate system. on the Earth's surface used for recording the elevation of topographic surface a detailed map of the surface features of land. It includes the mountains, hills, creeks, and other bumps and lumps on a particular hunk of earth. The word is a Greek-rooted combo of topos meaning "place" and graphein "to write." 's relief the difference between the highest and lowest point within a particular area while landforms are the descriptive words for individual features (LMSL) used to measure precise elevations on the topographic surface a detailed map of the surface features of land. It includes the mountains, hills, creeks, and other bumps and lumps on a particular hunk of earth. The word is a Greek-rooted combo of topos meaning "place" and graphein "to write." , or for now, a model of sea level to establish elevation the vertical distance between local mean sea level the measurement above or below the global average at a single point A GIS vector data in any sort of digital science or art, is simply denoting a type of graphical representation using straight lines to construct the outlines of objects geometry type which is made up of just one vertex pl. vertices One of a set of ordered x,y coordinate pairs that defines the shape of a line or polygon feature. , marking a single XY location in any given geographic or projected coordinate system. on the Earth's surface used for recording the elevation of topographic surface a detailed map of the surface features of land. It includes the mountains, hills, creeks, and other bumps and lumps on a particular hunk of earth. The word is a Greek-rooted combo of topos meaning "place" and graphein "to write." 's relief the difference between the highest and lowest point within a particular area while landforms are the descriptive words for individual features and a single point A GIS vector data in any sort of digital science or art, is simply denoting a type of graphical representation using straight lines to construct the outlines of objects geometry type which is made up of just one vertex pl. vertices One of a set of ordered x,y coordinate pairs that defines the shape of a line or polygon feature. , marking a single XY location in any given geographic or projected coordinate system. on the Earth's surface values (a definition which we will expand on through this section). You most likely have already interacted with elevation the vertical distance between local mean sea level the measurement above or below the global average at a single point A GIS vector data in any sort of digital science or art, is simply denoting a type of graphical representation using straight lines to construct the outlines of objects geometry type which is made up of just one vertex pl. vertices One of a set of ordered x,y coordinate pairs that defines the shape of a line or polygon feature. , marking a single XY location in any given geographic or projected coordinate system. on the Earth's surface used for recording the elevation of topographic surface a detailed map of the surface features of land. It includes the mountains, hills, creeks, and other bumps and lumps on a particular hunk of earth. The word is a Greek-rooted combo of topos meaning "place" and graphein "to write." 's relief the difference between the highest and lowest point within a particular area while landforms are the descriptive words for individual features and a single point A GIS vector data in any sort of digital science or art, is simply denoting a type of graphical representation using straight lines to construct the outlines of objects geometry type which is made up of just one vertex pl. vertices One of a set of ordered x,y coordinate pairs that defines the shape of a line or polygon feature. , marking a single XY location in any given geographic or projected coordinate system. on the Earth's surface values in your daily life - it's everywhere - printed on city center signs, noted on the ground at airports, and used to measure all those 14'ers in Colorado (it's even where they get the name "fourteeners"). And you most likely also understand the concept of how elevation the vertical distance between local mean sea level the measurement above or below the global average at a single point A GIS vector data in any sort of digital science or art, is simply denoting a type of graphical representation using straight lines to construct the outlines of objects geometry type which is made up of just one vertex pl. vertices One of a set of ordered x,y coordinate pairs that defines the shape of a line or polygon feature. , marking a single XY location in any given geographic or projected coordinate system. on the Earth's surface used for recording the elevation of topographic surface a detailed map of the surface features of land. It includes the mountains, hills, creeks, and other bumps and lumps on a particular hunk of earth. The word is a Greek-rooted combo of topos meaning "place" and graphein "to write." 's relief the difference between the highest and lowest point within a particular area while landforms are the descriptive words for individual features and a single point A GIS vector data in any sort of digital science or art, is simply denoting a type of graphical representation using straight lines to construct the outlines of objects geometry type which is made up of just one vertex pl. vertices One of a set of ordered x,y coordinate pairs that defines the shape of a line or polygon feature. , marking a single XY location in any given geographic or projected coordinate system. on the Earth's surface is measured: sea level is zero and the town or mountain is measured at some linear unit higher or lower, in the case of Death Valley, than sea level. But did you know that there really isn't an equal zero value all over the Earth's surface? Each time you are at the beach (or the shore, for you East Coast folks), you are indeed at 0 feet of elevation the vertical distance between local mean sea level the measurement above or below the global average at a single point A GIS vector data in any sort of digital science or art, is simply denoting a type of graphical representation using straight lines to construct the outlines of objects geometry type which is made up of just one vertex pl. vertices One of a set of ordered x,y coordinate pairs that defines the shape of a line or polygon feature. , marking a single XY location in any given geographic or projected coordinate system. on the Earth's surface used for recording the elevation of topographic surface a detailed map of the surface features of land. It includes the mountains, hills, creeks, and other bumps and lumps on a particular hunk of earth. The word is a Greek-rooted combo of topos meaning "place" and graphein "to write." 's relief the difference between the highest and lowest point within a particular area while landforms are the descriptive words for individual features and a single point A GIS vector data in any sort of digital science or art, is simply denoting a type of graphical representation using straight lines to construct the outlines of objects geometry type which is made up of just one vertex pl. vertices One of a set of ordered x,y coordinate pairs that defines the shape of a line or polygon feature. , marking a single XY location in any given geographic or projected coordinate system. on the Earth's surface , but if you tied a string around the Earth, zero feet of elevation the vertical distance between local mean sea level the measurement above or below the global average at a single point A GIS vector data in any sort of digital science or art, is simply denoting a type of graphical representation using straight lines to construct the outlines of objects geometry type which is made up of just one vertex pl. vertices One of a set of ordered x,y coordinate pairs that defines the shape of a line or polygon feature. , marking a single XY location in any given geographic or projected coordinate system. on the Earth's surface used for recording the elevation of topographic surface a detailed map of the surface features of land. It includes the mountains, hills, creeks, and other bumps and lumps on a particular hunk of earth. The word is a Greek-rooted combo of topos meaning "place" and graphein "to write." 's relief the difference between the highest and lowest point within a particular area while landforms are the descriptive words for individual features and a single point A GIS vector data in any sort of digital science or art, is simply denoting a type of graphical representation using straight lines to construct the outlines of objects geometry type which is made up of just one vertex pl. vertices One of a set of ordered x,y coordinate pairs that defines the shape of a line or polygon feature. , marking a single XY location in any given geographic or projected coordinate system. on the Earth's surface in Los Angeles is not at the same place as zero feet in New Jersey, meaning the local mean sea level the measurement above or below the global average at a single point A GIS vector data in any sort of digital science or art, is simply denoting a type of graphical representation using straight lines to construct the outlines of objects geometry type which is made up of just one vertex pl. vertices One of a set of ordered x,y coordinate pairs that defines the shape of a line or polygon feature. , marking a single XY location in any given geographic or projected coordinate system. on the Earth's surface used for recording the elevation of topographic surface a detailed map of the surface features of land. It includes the mountains, hills, creeks, and other bumps and lumps on a particular hunk of earth. The word is a Greek-rooted combo of topos meaning "place" and graphein "to write." 's relief the difference between the highest and lowest point within a particular area while landforms are the descriptive words for individual features is not equal. To understand the concept of a geoid a model of the variation between global mean (average) sea level and local mean sea level the measurement above or below the global average at a single point A GIS vector data in any sort of digital science or art, is simply denoting a type of graphical representation using straight lines to construct the outlines of objects geometry type which is made up of just one vertex pl. vertices One of a set of ordered x,y coordinate pairs that defines the shape of a line or polygon feature. , marking a single XY location in any given geographic or projected coordinate system. on the Earth's surface used for recording the elevation of topographic surface a detailed map of the surface features of land. It includes the mountains, hills, creeks, and other bumps and lumps on a particular hunk of earth. The word is a Greek-rooted combo of topos meaning "place" and graphein "to write." 's relief the difference between the highest and lowest point within a particular area while landforms are the descriptive words for individual features , which is used to measure precise elevations on the topographic surface a detailed map of the surface features of land. It includes the mountains, hills, creeks, and other bumps and lumps on a particular hunk of earth. The word is a Greek-rooted combo of topos meaning "place" and graphein "to write." , you need to first know the definitions of global and local mean sea level the measurement above or below the global average at a single point A GIS vector data in any sort of digital science or art, is simply denoting a type of graphical representation using straight lines to construct the outlines of objects geometry type which is made up of just one vertex pl. vertices One of a set of ordered x,y coordinate pairs that defines the shape of a line or polygon feature. , marking a single XY location in any given geographic or projected coordinate system. on the Earth's surface used for recording the elevation of topographic surface a detailed map of the surface features of land. It includes the mountains, hills, creeks, and other bumps and lumps on a particular hunk of earth. The word is a Greek-rooted combo of topos meaning "place" and graphein "to write." 's relief the difference between the highest and lowest point within a particular area while landforms are the descriptive words for individual features and understand just a little bit about how gravity and gravitational acceleration work, as what we determine as "sea level" is actually a reaction to the force of gravity and the measurement of object acceleration.
Newton's Law of Universal Gravitation states that any object with a measurable mass will pull any other object with a measurable mass towards it along a straight line. This means that the Earth is pulling you towards it's center along a straight path and you're pulling it right back, however, the mass of the Earth is much greater, the pull of the Earth has a greater effect upon you than you upon it. We call this force or the pulling action of the Earth against other objects of measurable mass, gravity and the measured result gravitational acceleration - simply, a measurement of the distance traveled by an object along a straight line over a known period of time, or looking at how long it will take an object to fall from a height above the Earth's surface to making contact with said surface. Newton's Second Law of Motion describes the relationship between force (the action) and acceleration (the effect of the force), stating they are directly proportional. Historically, it was thought that gravity created a state of homeostasis, leveling out the oceans and making the sea level equal all over the Earth ... until it was figured out that gravitational acceleration is not equal everywhere on the Earth's surface. The average rate is indeed 9.81 m/s 2 - just like you may have learned in high school Physics, but since that is an average value, it must mean that there is a range of values which roughly centers on the learned value. Gravitational acceleration at any given location on the Earth's surface varies based upon the materials and their densities which make up the inner and outer structures (the mantel and crust, respectively) at that location - along with a few other things, but we are trying to keep it as simple as possible here, so we will just leave it as a factor based on the density of the material.
How are Geoids Measured?
To create a geoid a model of the variation between global mean (average) sea level and local mean sea level the measurement above or below the global average at a single point A GIS vector data in any sort of digital science or art, is simply denoting a type of graphical representation using straight lines to construct the outlines of objects geometry type which is made up of just one vertex pl. vertices One of a set of ordered x,y coordinate pairs that defines the shape of a line or polygon feature. , marking a single XY location in any given geographic or projected coordinate system. on the Earth's surface used for recording the elevation of topographic surface a detailed map of the surface features of land. It includes the mountains, hills, creeks, and other bumps and lumps on a particular hunk of earth. The word is a Greek-rooted combo of topos meaning "place" and graphein "to write." 's relief the difference between the highest and lowest point within a particular area while landforms are the descriptive words for individual features , which is used to measure precise elevations on the topographic surface a detailed map of the surface features of land. It includes the mountains, hills, creeks, and other bumps and lumps on a particular hunk of earth. The word is a Greek-rooted combo of topos meaning "place" and graphein "to write." (the variation between GMSL and LMSL), we need to first create a model of global mean sea level the average of the sea level as affected by the pull of gravity when there is a finite amount of water upon a model of the Earth. by removing all of the land masses and ocean tides and assuming the gravitational acceleration is equal everywhere on the Earth's surface. This will result in a single, unmoving ocean which is perfectly flat and level everywhere. From there, we need to measure the gravitational acceleration everywhere on the Earth's surface. Traditionally, this was accomplished by taking several measurements with a gravimeter - a device which could measure the gravitational acceleration at a single point A GIS vector data in any sort of digital science or art, is simply denoting a type of graphical representation using straight lines to construct the outlines of objects geometry type which is made up of just one vertex pl. vertices One of a set of ordered x,y coordinate pairs that defines the shape of a line or polygon feature. , marking a single XY location in any given geographic or projected coordinate system. on the Earth's surface - and interpolating the remainder. More recently, measurements with a higher accuracy using a less labor intensive method can be collected via a satellite, as we will see in this YouTube video.
You Tube Break
Concept Quiz
So, Why Use Geoids When it Comes to Maps?
Once we have all the measurements for every point A GIS vector data in any sort of digital science or art, is simply denoting a type of graphical representation using straight lines to construct the outlines of objects geometry type which is made up of just one vertex pl. vertices One of a set of ordered x,y coordinate pairs that defines the shape of a line or polygon feature. , marking a single XY location in any given geographic or projected coordinate system. covering the entire surface of the Earth and we have our model of GMSL, where the oceans are unmoving and level, we can either "push" down the model's surface to represent where the gravitational acceleration measurements are lower than the average or "pull" the water's surface up to represent those which are higher. This pushing and pulling on the water's surface results in a Russet potato-like shape of the geoids.
Think about the pushing and pulling of the GMSL to create a geoid a model of the variation between global mean (average) sea level and local mean sea level the measurement above or below the global average at a single point A GIS vector data in any sort of digital science or art, is simply denoting a type of graphical representation using straight lines to construct the outlines of objects geometry type which is made up of just one vertex pl. vertices One of a set of ordered x,y coordinate pairs that defines the shape of a line or polygon feature. , marking a single XY location in any given geographic or projected coordinate system. on the Earth's surface used for recording the elevation of topographic surface a detailed map of the surface features of land. It includes the mountains, hills, creeks, and other bumps and lumps on a particular hunk of earth. The word is a Greek-rooted combo of topos meaning "place" and graphein "to write." 's relief the difference between the highest and lowest point within a particular area while landforms are the descriptive words for individual features , which is used to measure precise elevations on the topographic surface a detailed map of the surface features of land. It includes the mountains, hills, creeks, and other bumps and lumps on a particular hunk of earth. The word is a Greek-rooted combo of topos meaning "place" and graphein "to write." this way: if there is a finite amount of water and no land masses in our hypothetical perfect-sphere model of GMSL, water will be drawn towards the areas where the gravitational acceleration is higher (as the mass of the water is less than the mass of the Earth, so the Earth wins this Battle of Gravity). If there is a finite amount of water, and that water is drawn towards areas where the gravitational acceleration is higher, this must mean the water must be drawn away from those areas where the gravitational acceleration was lower. By moving the finite amount of water around on the GMSL model's surface, the resulting model is of local mean sea level the measurement above or below the global average at a single point A GIS vector data in any sort of digital science or art, is simply denoting a type of graphical representation using straight lines to construct the outlines of objects geometry type which is made up of just one vertex pl. vertices One of a set of ordered x,y coordinate pairs that defines the shape of a line or polygon feature. , marking a single XY location in any given geographic or projected coordinate system. on the Earth's surface used for recording the elevation of topographic surface a detailed map of the surface features of land. It includes the mountains, hills, creeks, and other bumps and lumps on a particular hunk of earth. The word is a Greek-rooted combo of topos meaning "place" and graphein "to write." 's relief the difference between the highest and lowest point within a particular area while landforms are the descriptive words for individual features , or the specific local zero position a measurement of elevation the vertical distance between local mean sea level the measurement above or below the global average at a single point A GIS vector data in any sort of digital science or art, is simply denoting a type of graphical representation using straight lines to construct the outlines of objects geometry type which is made up of just one vertex pl. vertices One of a set of ordered x,y coordinate pairs that defines the shape of a line or polygon feature. , marking a single XY location in any given geographic or projected coordinate system. on the Earth's surface used for recording the elevation of topographic surface a detailed map of the surface features of land. It includes the mountains, hills, creeks, and other bumps and lumps on a particular hunk of earth. The word is a Greek-rooted combo of topos meaning "place" and graphein "to write." 's relief the difference between the highest and lowest point within a particular area while landforms are the descriptive words for individual features and a single point A GIS vector data in any sort of digital science or art, is simply denoting a type of graphical representation using straight lines to construct the outlines of objects geometry type which is made up of just one vertex pl. vertices One of a set of ordered x,y coordinate pairs that defines the shape of a line or polygon feature. , marking a single XY location in any given geographic or projected coordinate system. on the Earth's surface is based on, even inland where the ocean is not physically present.
It was stated at the very beginning of this chapter that the whole goal of maps is to create a graphical representation of our world to express the distribution of features (spatial data) and non-spatial data Attributes related to a location but not describing its physical placement in space, such as information about a tree's age, type, and health. and that the first step in creating accurate maps is a means of labeling locations on the Earth's surface - creating a geographic coordinate system. Since we live in a 3D world, it's important to have maps and systems that reflect this fact, and we express this factor via elevation the vertical distance between local mean sea level the measurement above or below the global average at a single point A GIS vector data in any sort of digital science or art, is simply denoting a type of graphical representation using straight lines to construct the outlines of objects geometry type which is made up of just one vertex pl. vertices One of a set of ordered x,y coordinate pairs that defines the shape of a line or polygon feature. , marking a single XY location in any given geographic or projected coordinate system. on the Earth's surface used for recording the elevation of topographic surface a detailed map of the surface features of land. It includes the mountains, hills, creeks, and other bumps and lumps on a particular hunk of earth. The word is a Greek-rooted combo of topos meaning "place" and graphein "to write." 's relief the difference between the highest and lowest point within a particular area while landforms are the descriptive words for individual features and a single point A GIS vector data in any sort of digital science or art, is simply denoting a type of graphical representation using straight lines to construct the outlines of objects geometry type which is made up of just one vertex pl. vertices One of a set of ordered x,y coordinate pairs that defines the shape of a line or polygon feature. , marking a single XY location in any given geographic or projected coordinate system. on the Earth's surface measurements. We will see in section 2.3.7 that maps are drawn upon the reference ellipsoid an ellipsoid that is drawn to best-fit an area. World reference ellipsoids are drawn to best-fit the entire geoid; local ellipsoids are best fit on one side to a single place of the geoid , but that only takes care of the horizontal mapping factor, the XY in our XYZ world. By using the geoid a model of the variation between global mean (average) sea level and local mean sea level the measurement above or below the global average at a single point A GIS vector data in any sort of digital science or art, is simply denoting a type of graphical representation using straight lines to construct the outlines of objects geometry type which is made up of just one vertex pl. vertices One of a set of ordered x,y coordinate pairs that defines the shape of a line or polygon feature. , marking a single XY location in any given geographic or projected coordinate system. on the Earth's surface used for recording the elevation of topographic surface a detailed map of the surface features of land. It includes the mountains, hills, creeks, and other bumps and lumps on a particular hunk of earth. The word is a Greek-rooted combo of topos meaning "place" and graphein "to write." 's relief the difference between the highest and lowest point within a particular area while landforms are the descriptive words for individual features , which is used to measure precise elevations on the topographic surface a detailed map of the surface features of land. It includes the mountains, hills, creeks, and other bumps and lumps on a particular hunk of earth. The word is a Greek-rooted combo of topos meaning "place" and graphein "to write." and attaching it to the reference ellipsoid an ellipsoid that is drawn to best-fit an area. World reference ellipsoids are drawn to best-fit the entire geoid; local ellipsoids are best fit on one side to a single place of the geoid , we are able to map all three measurement factors - X and Y to express where you are standing on the Earth's surface and Z to express the elevation the vertical distance between local mean sea level the measurement above or below the global average at a single point A GIS vector data in any sort of digital science or art, is simply denoting a type of graphical representation using straight lines to construct the outlines of objects geometry type which is made up of just one vertex pl. vertices One of a set of ordered x,y coordinate pairs that defines the shape of a line or polygon feature. , marking a single XY location in any given geographic or projected coordinate system. on the Earth's surface used for recording the elevation of topographic surface a detailed map of the surface features of land. It includes the mountains, hills, creeks, and other bumps and lumps on a particular hunk of earth. The word is a Greek-rooted combo of topos meaning "place" and graphein "to write." 's relief the difference between the highest and lowest point within a particular area while landforms are the descriptive words for individual features and a single point A GIS vector data in any sort of digital science or art, is simply denoting a type of graphical representation using straight lines to construct the outlines of objects geometry type which is made up of just one vertex pl. vertices One of a set of ordered x,y coordinate pairs that defines the shape of a line or polygon feature. , marking a single XY location in any given geographic or projected coordinate system. on the Earth's surface at which you stand.
| FIGURE 2.9: A Model of a Ellipsoid vs a Geoid |
|---|
|
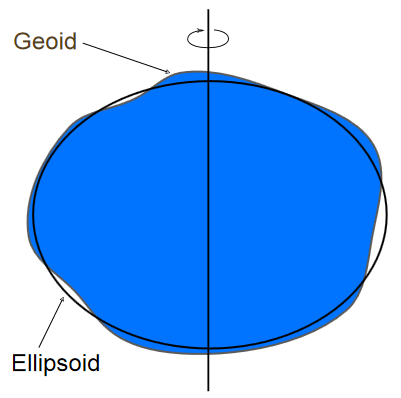
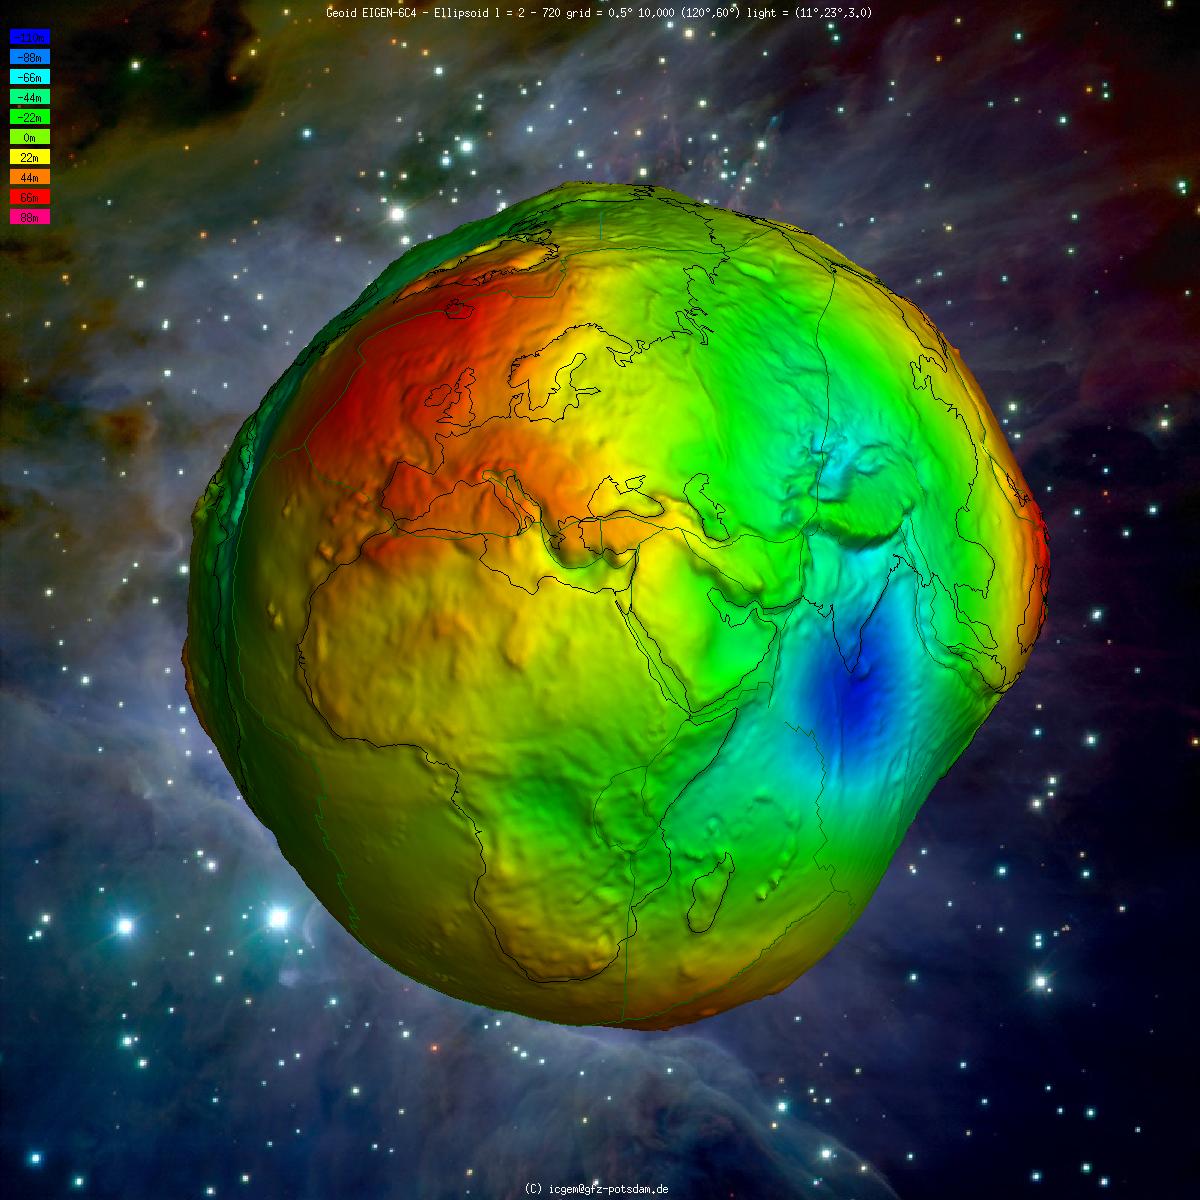
When we look at the model of the geoid a model of the variation between global mean (average) sea level and local mean sea level the measurement above or below the global average at a single point A GIS vector data in any sort of digital science or art, is simply denoting a type of graphical representation using straight lines to construct the outlines of objects geometry type which is made up of just one vertex pl. vertices One of a set of ordered x,y coordinate pairs that defines the shape of a line or polygon feature. , marking a single XY location in any given geographic or projected coordinate system. on the Earth's surface used for recording the elevation of topographic surface a detailed map of the surface features of land. It includes the mountains, hills, creeks, and other bumps and lumps on a particular hunk of earth. The word is a Greek-rooted combo of topos meaning "place" and graphein "to write." 's relief the difference between the highest and lowest point within a particular area while landforms are the descriptive words for individual features , which is used to measure precise elevations on the topographic surface a detailed map of the surface features of land. It includes the mountains, hills, creeks, and other bumps and lumps on a particular hunk of earth. The word is a Greek-rooted combo of topos meaning "place" and graphein "to write." in Figure 2.9, we see a full spectrum color ramp - a variation in color using all the colors of the rainbow starting at red and ending with violet - where the positive numbers are represented by shades red, zero is represented by green-blue, and the negative values are represented by shades of blue (kind of tough to see if you're using a black and white e-reader, but you can see an interactive color version of the geoid a model of the variation between global mean (average) sea level and local mean sea level the measurement above or below the global average at a single point A GIS vector data in any sort of digital science or art, is simply denoting a type of graphical representation using straight lines to construct the outlines of objects geometry type which is made up of just one vertex pl. vertices One of a set of ordered x,y coordinate pairs that defines the shape of a line or polygon feature. , marking a single XY location in any given geographic or projected coordinate system. on the Earth's surface used for recording the elevation of topographic surface a detailed map of the surface features of land. It includes the mountains, hills, creeks, and other bumps and lumps on a particular hunk of earth. The word is a Greek-rooted combo of topos meaning "place" and graphein "to write." 's relief the difference between the highest and lowest point within a particular area while landforms are the descriptive words for individual features , which is used to measure precise elevations on the topographic surface a detailed map of the surface features of land. It includes the mountains, hills, creeks, and other bumps and lumps on a particular hunk of earth. The word is a Greek-rooted combo of topos meaning "place" and graphein "to write." on the Learn GIS Geographic Information Systems the software used to create, store, and manage spatial data, analyze spatial problems, and display the data in cartographic layouts Geographic Information Sciences website). Areas where the model is red are areas where the gravitational acceleration is greater, thus the modeled variation in local mean sea level the measurement above or below the global average at a single point A GIS vector data in any sort of digital science or art, is simply denoting a type of graphical representation using straight lines to construct the outlines of objects geometry type which is made up of just one vertex pl. vertices One of a set of ordered x,y coordinate pairs that defines the shape of a line or polygon feature. , marking a single XY location in any given geographic or projected coordinate system. on the Earth's surface used for recording the elevation of topographic surface a detailed map of the surface features of land. It includes the mountains, hills, creeks, and other bumps and lumps on a particular hunk of earth. The word is a Greek-rooted combo of topos meaning "place" and graphein "to write." 's relief the difference between the highest and lowest point within a particular area while landforms are the descriptive words for individual features would be a value higher than the global average and areas modeled in blue are areas where the pull is lower and the local mean sea level the measurement above or below the global average at a single point A GIS vector data in any sort of digital science or art, is simply denoting a type of graphical representation using straight lines to construct the outlines of objects geometry type which is made up of just one vertex pl. vertices One of a set of ordered x,y coordinate pairs that defines the shape of a line or polygon feature. , marking a single XY location in any given geographic or projected coordinate system. on the Earth's surface used for recording the elevation of topographic surface a detailed map of the surface features of land. It includes the mountains, hills, creeks, and other bumps and lumps on a particular hunk of earth. The word is a Greek-rooted combo of topos meaning "place" and graphein "to write." 's relief the difference between the highest and lowest point within a particular area while landforms are the descriptive words for individual features would be less than the global average.
| FIGURE 2.10: A model of a Geoid |
|---|
|
| An Interactive Geoid Model |
|---|
| The Main Point... |
|---|
| Variations in the Earth structure density lead to a variation in the gravitational acceleration over the surface of the Earth. If there is a finite amount of water on the Earth's surface and water is drawn to where the gravitational acceleration is higher, we can then assume the local sea level at those areas is not equal to the global mean sea level the average of the sea level as affected by the pull of gravity when there is a finite amount of water upon a model of the Earth. ; in fact it would be higher. Thus, a better model of where to place the zero elevation the vertical distance between local mean sea level the measurement above or below the global average at a single point A GIS vector data in any sort of digital science or art, is simply denoting a type of graphical representation using straight lines to construct the outlines of objects geometry type which is made up of just one vertex pl. vertices One of a set of ordered x,y coordinate pairs that defines the shape of a line or polygon feature. , marking a single XY location in any given geographic or projected coordinate system. on the Earth's surface used for recording the elevation of topographic surface a detailed map of the surface features of land. It includes the mountains, hills, creeks, and other bumps and lumps on a particular hunk of earth. The word is a Greek-rooted combo of topos meaning "place" and graphein "to write." 's relief the difference between the highest and lowest point within a particular area while landforms are the descriptive words for individual features and a single point A GIS vector data in any sort of digital science or art, is simply denoting a type of graphical representation using straight lines to construct the outlines of objects geometry type which is made up of just one vertex pl. vertices One of a set of ordered x,y coordinate pairs that defines the shape of a line or polygon feature. , marking a single XY location in any given geographic or projected coordinate system. on the Earth's surface value at any given place on the Earth's surface should be based on the gravitational acceleration and the assumed local mean sea level the measurement above or below the global average at a single point A GIS vector data in any sort of digital science or art, is simply denoting a type of graphical representation using straight lines to construct the outlines of objects geometry type which is made up of just one vertex pl. vertices One of a set of ordered x,y coordinate pairs that defines the shape of a line or polygon feature. , marking a single XY location in any given geographic or projected coordinate system. on the Earth's surface used for recording the elevation of topographic surface a detailed map of the surface features of land. It includes the mountains, hills, creeks, and other bumps and lumps on a particular hunk of earth. The word is a Greek-rooted combo of topos meaning "place" and graphein "to write." 's relief the difference between the highest and lowest point within a particular area while landforms are the descriptive words for individual features and not the global average. This variable local mean sea level the measurement above or below the global average at a single point A GIS vector data in any sort of digital science or art, is simply denoting a type of graphical representation using straight lines to construct the outlines of objects geometry type which is made up of just one vertex pl. vertices One of a set of ordered x,y coordinate pairs that defines the shape of a line or polygon feature. , marking a single XY location in any given geographic or projected coordinate system. on the Earth's surface used for recording the elevation of topographic surface a detailed map of the surface features of land. It includes the mountains, hills, creeks, and other bumps and lumps on a particular hunk of earth. The word is a Greek-rooted combo of topos meaning "place" and graphein "to write." 's relief the difference between the highest and lowest point within a particular area while landforms are the descriptive words for individual features is modeled using a Geoid, where some places are modeled above the global average and in other places are modeled below. As our goal is to map a 3D world, having an accurate starting point A GIS vector data in any sort of digital science or art, is simply denoting a type of graphical representation using straight lines to construct the outlines of objects geometry type which is made up of just one vertex pl. vertices One of a set of ordered x,y coordinate pairs that defines the shape of a line or polygon feature. , marking a single XY location in any given geographic or projected coordinate system. for the Z value ( elevation the vertical distance between local mean sea level the measurement above or below the global average at a single point A GIS vector data in any sort of digital science or art, is simply denoting a type of graphical representation using straight lines to construct the outlines of objects geometry type which is made up of just one vertex pl. vertices One of a set of ordered x,y coordinate pairs that defines the shape of a line or polygon feature. , marking a single XY location in any given geographic or projected coordinate system. on the Earth's surface used for recording the elevation of topographic surface a detailed map of the surface features of land. It includes the mountains, hills, creeks, and other bumps and lumps on a particular hunk of earth. The word is a Greek-rooted combo of topos meaning "place" and graphein "to write." 's relief the difference between the highest and lowest point within a particular area while landforms are the descriptive words for individual features and a single point A GIS vector data in any sort of digital science or art, is simply denoting a type of graphical representation using straight lines to construct the outlines of objects geometry type which is made up of just one vertex pl. vertices One of a set of ordered x,y coordinate pairs that defines the shape of a line or polygon feature. , marking a single XY location in any given geographic or projected coordinate system. on the Earth's surface ) is the first step to accurate and precise maps. |
2.3.5: Ellipses and Circles
Geometry is the branch of mathematics which deals with the measurement of points, lines, angles, and surfaces, including defining both two dimensional and three dimensional shapes. We use those definitions quite a bit (okay, literally all of the time) in geospatial sciences A discipline that focuses on using information technology to understand people, places, and processes of the earth. Spatial analysis of human and physically variables is fundamental to the discipline. , and while geometry is not a prerequisite for a GIS Geographic Information Systems the software used to create, store, and manage spatial data Data that deals with location, such as lists of addresses, the footprint of a building, the boundaries of cities and counties, etc. , analyze spatial problems, and display the data in cartographic layouts Geographic Information Sciences course, there is a certain amount of expectation that a GIS Geographic Information Systems the software used to create, store, and manage spatial data Data that deals with location, such as lists of addresses, the footprint of a building, the boundaries of cities and counties, etc. , analyze spatial problems, and display the data in cartographic layouts Geographic Information Sciences technician understands some basic principles of how shapes are defined and expressed, as well as the understanding of basic shapes such as circles, squares, lines, points, and abstract shapes without any specific names. Beyond that, the rest can be explained as we go.
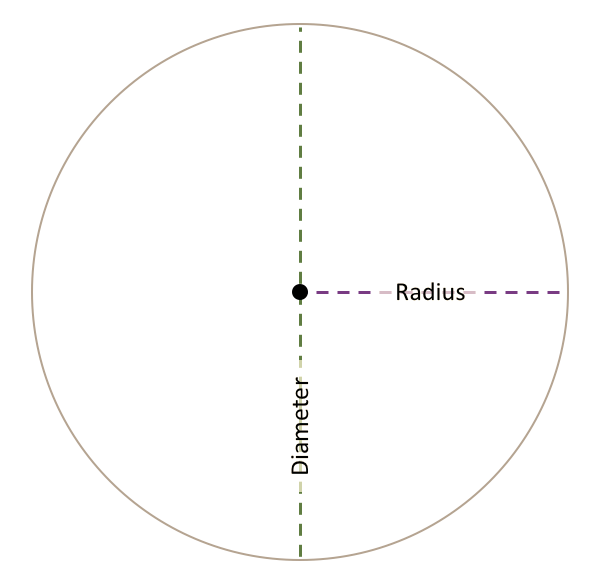
At this point A GIS vector data in any sort of digital science or art, is simply denoting a type of graphical representation using straight lines to construct the outlines of objects geometry type which is made up of just one vertex pl. vertices One of a set of ordered x,y coordinate pairs that defines the shape of a line or polygon feature. , marking a single XY location in any given geographic or projected coordinate system. , there is an expectation that you understand that a circle is a two dimensional shape defined by a line which creates a closed loop where any point A GIS vector data in any sort of digital science or art, is simply denoting a type of graphical representation using straight lines to construct the outlines of objects geometry type which is made up of just one vertex pl. vertices One of a set of ordered x,y coordinate pairs that defines the shape of a line or polygon feature. , marking a single XY location in any given geographic or projected coordinate system. along the edge is an equal measurement from the center along a straight line (the radius) and that a sphere is the three dimensional version of a circle, where that radius measurement is equal for not just the XY plane, but also the Z. The circle and the sphere is where we will start the discussion of ellipsoids and spheroids, the shapes we use to represent a simplified version of the Earth upon which we draw the geographic coordinate system.
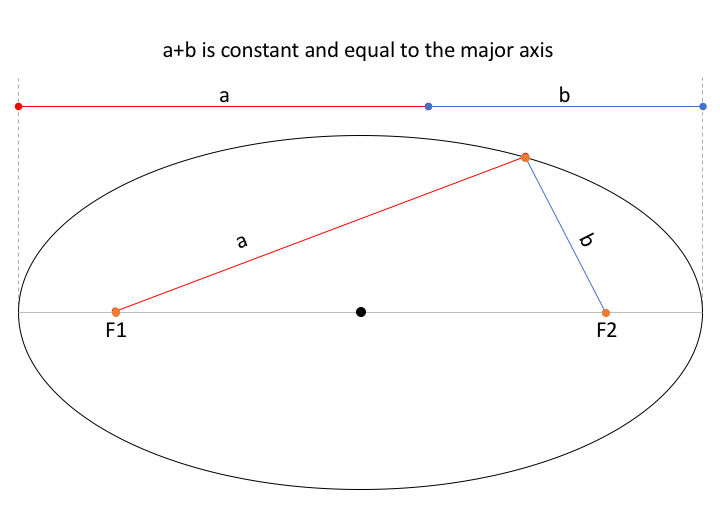
An ellipse is a two dimensional shape (existing only in the X and Y planes, which are planes which are perpendicular to each other at a 90° angle) defined by a curved line forming a closed loop, where the sum of the distances from two points (foci) located on the major axis to every point A GIS vector data in any sort of digital science or art, is simply denoting a type of graphical representation using straight lines to construct the outlines of objects geometry type which is made up of just one vertex pl. vertices One of a set of ordered x,y coordinate pairs that defines the shape of a line or polygon feature. , marking a single XY location in any given geographic or projected coordinate system. on the line is constant. Okay, let's break that down so we better understand what in the heck was just said, but before that, let's define the parts of the ellipse so when we look at the breakdown of the ellipse definition, we know what we are looking at. An ellipse is going to be longer in one direction than the other, meaning if you bisect the shape at the widest part, you've bisected it along the major axis. If the ellipse is bisected along the shortest side, you've bisected it along the minor axis. When each axis is bisected, they reach only from the center to the edge of the ellipse, resulting in the semi-major axis and semi-minor axis, respective to the major and minor axis.
| FIGURE 2.11: Parts of the Ellipse |
|---|
|
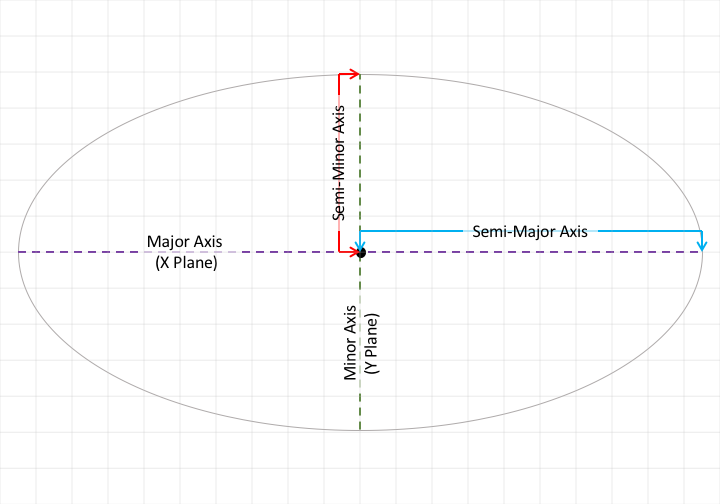
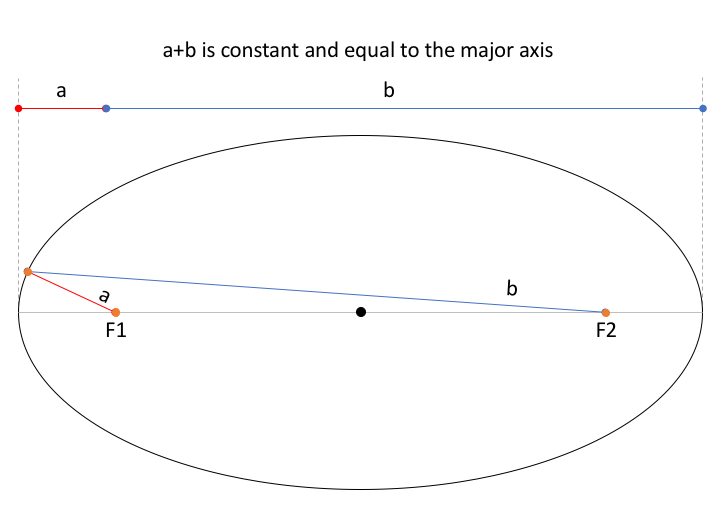
To examine the definition as a whole, bisect the ellipse along the major axis, and draw two focus points (as seen in the Figure 2.11 below - the major axis has points F1 and F2 marked). Second, draw a single point A GIS vector data in any sort of digital science or art, is simply denoting a type of graphical representation using straight lines to construct the outlines of objects geometry type which is made up of just one vertex pl. vertices One of a set of ordered x,y coordinate pairs that defines the shape of a line or polygon feature. , marking a single XY location in any given geographic or projected coordinate system. anywhere along the edge of and draw a straight line from each foci to that single point A GIS vector data in any sort of digital science or art, is simply denoting a type of graphical representation using straight lines to construct the outlines of objects geometry type which is made up of just one vertex pl. vertices One of a set of ordered x,y coordinate pairs that defines the shape of a line or polygon feature. , marking a single XY location in any given geographic or projected coordinate system. (as seen with the orange point A GIS vector data in any sort of digital science or art, is simply denoting a type of graphical representation using straight lines to construct the outlines of objects geometry type which is made up of just one vertex pl. vertices One of a set of ordered x,y coordinate pairs that defines the shape of a line or polygon feature. , marking a single XY location in any given geographic or projected coordinate system. on the edge of the ellipse and red line A and blue line B). Then we can observe two things: one - the length of red line A plus blue line B are equal to the length of the major axis; and two - if you move the orange dot around the edge of the ellipse, as we see in the second and third images in Figure 2.11, the only thing that changes is the lengths of red line A and blue line B, the total length of A+B remains the same, which in turn means that the length of A+B still is equal to the length of the major axis. Alright, there we go. an ellipse is defined by a curved line forming a closed loop, where the sum of the distanced from two points (foci) located on the major axis to every point A GIS vector data in any sort of digital science or art, is simply denoting a type of graphical representation using straight lines to construct the outlines of objects geometry type which is made up of just one vertex pl. vertices One of a set of ordered x,y coordinate pairs that defines the shape of a line or polygon feature. , marking a single XY location in any given geographic or projected coordinate system. on the line is constant.
| FIGURE 2.12: Ellipse | ||
|---|---|---|
|
|
|
| No matter where the orange dot is along the edge of an ellipse, the length of line a and line b are equal the the length of the major axis | ||

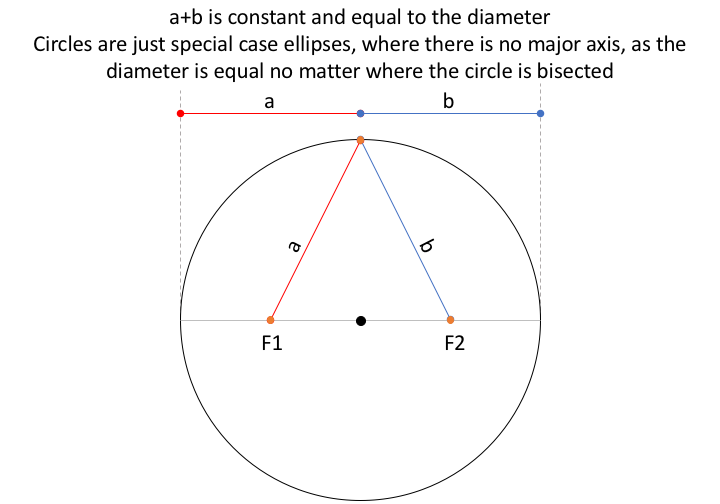
By this definition, technically a circles are a just special case of ellipse where there are equal major and minor axis, meaning there is no major nor minor axis. Instead, there exists a diameter and radius, representing the line which bisects the circle and measures from the center to the edge, respectively, as seen in Figure 2.3.A. The distance between two foci and any point A GIS vector data in any sort of digital science or art, is simply denoting a type of graphical representation using straight lines to construct the outlines of objects geometry type which is made up of just one vertex pl. vertices One of a set of ordered x,y coordinate pairs that defines the shape of a line or polygon feature. , marking a single XY location in any given geographic or projected coordinate system. along the edge of the circle still equal the diameter, regardless of where the point A GIS vector data in any sort of digital science or art, is simply denoting a type of graphical representation using straight lines to construct the outlines of objects geometry type which is made up of just one vertex pl. vertices One of a set of ordered x,y coordinate pairs that defines the shape of a line or polygon feature. , marking a single XY location in any given geographic or projected coordinate system. along the edge sits. In Figure 2.13.B, the foci F1 and F2 each bisect the radius, meaning that lines a and b are each equal to the radius, and per the definition of a circle, twice the radius equals the diameter.
| FIGURE 2.13: Circles are Just Special Case Ellipses | |
|---|---|
|
|
Concept Quiz
2.3.6: Spheres, Ellipsoids, and Ellipsoids of Revolution (Spheroids)
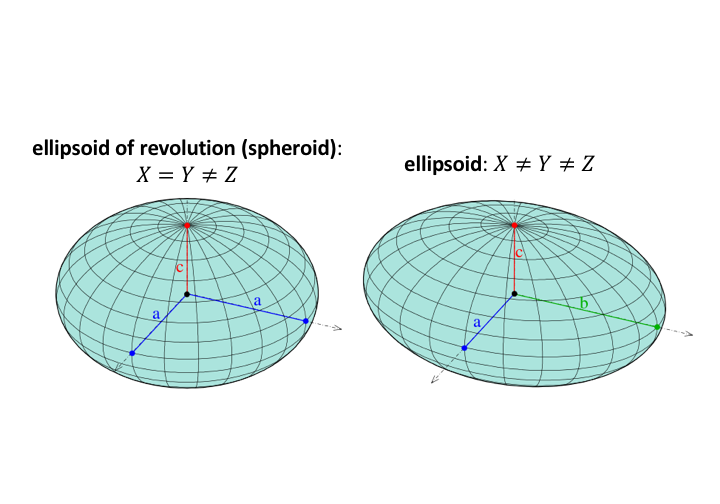
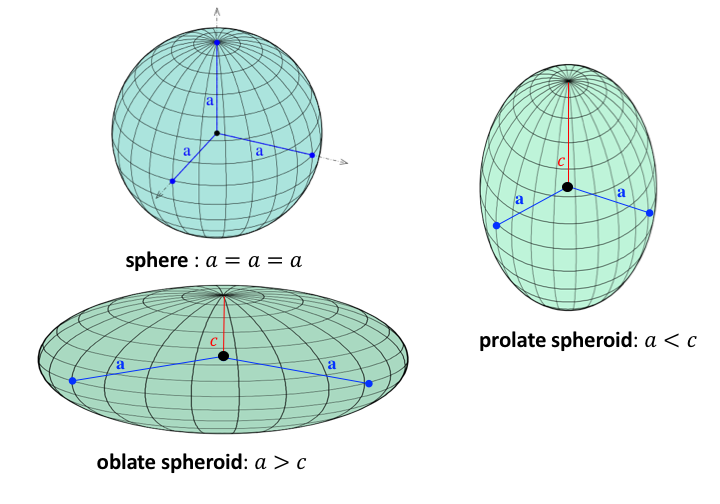
Two dimensional shapes become three dimensional when a measurement in the Z plane (the plane perpendicular to the X and Y planes) is added and in the case of ellipsoids, the relationship between the lengths of the axes along the X, Y, and Z planes defines the resulting shape. In cases where all three axes are all different lengths, the resulting shape is an ellipsoid, while cases where two of the three axes are equal results in a ellipsoid of revolution, also known as spheroids, as seen in Figure 2.14 A. Ellipsoids of revolution are called such due to the fact that two of the three axes remain invariant, or unchanging, when the object is rotated along the third axis. How the length of the third axis varies in comparison to the other two (which, remember, are equal to each other) is what gives each spheroid it's specific name. As seen in Figure 2.14B, when the third axis is equal to the other two, the resulting shape is a sphere, when the third axis is shorter than the other two, the resulting shape is a oblate spheroid a sphere-like object which is wider than it is tall , and when the third axis is longer than the other two, the resulting shape is a prolate spheroid a sphere-like object which is taller than it is wide .
| FIGURE 2.14 A: A Model of a Sphere and an Ellipsoid | FIGURE 2.14 B: Ellipsoids of Revolution (Spheroids) |
|---|---|
|
|
| The Main Point... |
|---|
| Using an ellipsoid over a spheroid when drawing a shape to best represent the planet takes into account the potato-like shape of the geoid a model of the variation between global mean (average) sea level and local mean sea level the measurement above or below the global average at a single point A GIS vector data in any sort of digital science or art, is simply denoting a type of graphical representation using straight lines to construct the outlines of objects geometry type which is made up of just one vertex pl. vertices One of a set of ordered x,y coordinate pairs that defines the shape of a line or polygon feature. , marking a single XY location in any given geographic or projected coordinate system. on the Earth's surface used for recording the elevation of topographic surface a detailed map of the surface features of land. It includes the mountains, hills, creeks, and other bumps and lumps on a particular hunk of earth. The word is a Greek-rooted combo of topos meaning "place" and graphein "to write." 's relief the difference between the highest and lowest point within a particular area while landforms are the descriptive words for individual features , which is used to measure precise elevations on the topographic surface a detailed map of the surface features of land. It includes the mountains, hills, creeks, and other bumps and lumps on a particular hunk of earth. The word is a Greek-rooted combo of topos meaning "place" and graphein "to write." , a necessary part of a geographic coordinate system. |
2.3.7: The Earth as a Spheroid
Through years of history and ever-increasing accuracy of world measurements, the idea the Earth is a sphere was held as truth for thousands of years (Aristotle was recorded in 350 BCE stating the Earth must be a sphere based on the movement of constellations and we learned in the last section that Eratosthenes came up with his really close estimate around 200 BCE). In 1687, Isaac Newton's, whom we know was really into all things gravity, published Principia in which he stated the spinning mass of the Earth could not be a true sphere due to the fact the Earth was not completely solid, but closer viscous liquid on the inside, thus the true shape must instead be an ellipsoid of revolution, or a spheroid. While French mathematicians associated with the French Royal Academy of Sciences agreed with Newton that the Earth was indeed a spheroid and not a true sphere, their argument was the Earth must be a prolate spheroid a sphere-like object which is taller than it is wide (bulging at the poles, like a football) due to the physical property regarding the Conservation of Angular Momentum (the reason an ice skater is able to spin faster and faster with less effort the closer to their center they draw their arms). Newton argued based upon the semi-viscous core and the principle of centrifugal force (objects will fly away from a central point A GIS vector data in any sort of digital science or art, is simply denoting a type of graphical representation using straight lines to construct the outlines of objects geometry type which is made up of just one vertex pl. vertices One of a set of ordered x,y coordinate pairs that defines the shape of a line or polygon feature. , marking a single XY location in any given geographic or projected coordinate system. when force is placed upon them in a circular motion), the Earth must be a oblate spheroid a sphere-like object which is wider than it is tall (bugling at Equator, like a fitness ball someone is sitting on).
The French Royal Academy of Sciences was eager to settle the score and set out two expeditions, one to the Arctic Circle and one to the Equator to measure the length of a degree of latitude also known as 'parallels' the east-west portion of a geographic grid measured with angles between 0 and 90° (French Geodesic Mission, 1735) . The expedition and subsequent calculations determined the length of a degree of latitude also known as 'parallels' the east-west portion of a geographic grid measured with angles between 0 and 90° at the Equator is 68.703 miles, while the length near the poles is 69.407 miles, proving the Earth is an oblate spheroid a sphere-like object which is wider than it is tall , slightly flattened at the poles an bulging at the equator.
| The Main Point... |
|---|
| The Earth is better represented not with a sphere, but an oblate spheroid a sphere-like object which is wider than it is tall ; the rotation of the planet plus the semi-viscous state of core result in a shape where the diameter along the equator is longer then the diameter between the poles. |
2.3.8: Reference Ellipsoids
Geographic coordinate systems exclude the topographic surface a detailed map of the surface features of land. It includes the mountains, hills, creeks, and other bumps and lumps on a particular hunk of earth. The word is a Greek-rooted combo of topos meaning "place" and graphein "to write." in an effort to simplify the labeling process. If we were to take the effort to create maps which perfectly mimicked the topographic surface a detailed map of the surface features of land. It includes the mountains, hills, creeks, and other bumps and lumps on a particular hunk of earth. The word is a Greek-rooted combo of topos meaning "place" and graphein "to write." , every time there was a change to the topographic surface a detailed map of the surface features of land. It includes the mountains, hills, creeks, and other bumps and lumps on a particular hunk of earth. The word is a Greek-rooted combo of topos meaning "place" and graphein "to write." , we would need to re-draw and re-calculate all of the completed systems. As an answer to re-doing a ton of work after every earthquake or wind event in the Sahara Desert, geographic coordinate systems use the most simplified version of the Earth which still takes elevation the vertical distance between local mean sea level the measurement above or below the global average at a single point A GIS vector data in any sort of digital science or art, is simply denoting a type of graphical representation using straight lines to construct the outlines of objects geometry type which is made up of just one vertex pl. vertices One of a set of ordered x,y coordinate pairs that defines the shape of a line or polygon feature. , marking a single XY location in any given geographic or projected coordinate system. on the Earth's surface used for recording the elevation of topographic surface a detailed map of the surface features of land. It includes the mountains, hills, creeks, and other bumps and lumps on a particular hunk of earth. The word is a Greek-rooted combo of topos meaning "place" and graphein "to write." 's relief the difference between the highest and lowest point within a particular area while landforms are the descriptive words for individual features and a single point A GIS vector data in any sort of digital science or art, is simply denoting a type of graphical representation using straight lines to construct the outlines of objects geometry type which is made up of just one vertex pl. vertices One of a set of ordered x,y coordinate pairs that defines the shape of a line or polygon feature. , marking a single XY location in any given geographic or projected coordinate system. on the Earth's surface into account. Even though the Earth is indeed best represented by an oblate spheroid a sphere-like object which is wider than it is tall (which we know is a special case ellipsoid where the Z axis measurement is less than the measurements along the X and Y axes, which equal), our goal, instead, is to create a system which uses a geoid a model of the variation between global mean (average) sea level and local mean sea level the measurement above or below the global average at a single point A GIS vector data in any sort of digital science or art, is simply denoting a type of graphical representation using straight lines to construct the outlines of objects geometry type which is made up of just one vertex pl. vertices One of a set of ordered x,y coordinate pairs that defines the shape of a line or polygon feature. , marking a single XY location in any given geographic or projected coordinate system. on the Earth's surface used for recording the elevation of topographic surface a detailed map of the surface features of land. It includes the mountains, hills, creeks, and other bumps and lumps on a particular hunk of earth. The word is a Greek-rooted combo of topos meaning "place" and graphein "to write." 's relief the difference between the highest and lowest point within a particular area while landforms are the descriptive words for individual features , which is used to measure precise elevations on the topographic surface a detailed map of the surface features of land. It includes the mountains, hills, creeks, and other bumps and lumps on a particular hunk of earth. The word is a Greek-rooted combo of topos meaning "place" and graphein "to write." as a base measurement for the elevation the vertical distance between local mean sea level the measurement above or below the global average at a single point A GIS vector data in any sort of digital science or art, is simply denoting a type of graphical representation using straight lines to construct the outlines of objects geometry type which is made up of just one vertex pl. vertices One of a set of ordered x,y coordinate pairs that defines the shape of a line or polygon feature. , marking a single XY location in any given geographic or projected coordinate system. on the Earth's surface used for recording the elevation of topographic surface a detailed map of the surface features of land. It includes the mountains, hills, creeks, and other bumps and lumps on a particular hunk of earth. The word is a Greek-rooted combo of topos meaning "place" and graphein "to write." 's relief the difference between the highest and lowest point within a particular area while landforms are the descriptive words for individual features and a single point A GIS vector data in any sort of digital science or art, is simply denoting a type of graphical representation using straight lines to construct the outlines of objects geometry type which is made up of just one vertex pl. vertices One of a set of ordered x,y coordinate pairs that defines the shape of a line or polygon feature. , marking a single XY location in any given geographic or projected coordinate system. on the Earth's surface . Since the geoid a model of the variation between global mean (average) sea level and local mean sea level the measurement above or below the global average at a single point A GIS vector data in any sort of digital science or art, is simply denoting a type of graphical representation using straight lines to construct the outlines of objects geometry type which is made up of just one vertex pl. vertices One of a set of ordered x,y coordinate pairs that defines the shape of a line or polygon feature. , marking a single XY location in any given geographic or projected coordinate system. on the Earth's surface used for recording the elevation of topographic surface a detailed map of the surface features of land. It includes the mountains, hills, creeks, and other bumps and lumps on a particular hunk of earth. The word is a Greek-rooted combo of topos meaning "place" and graphein "to write." 's relief the difference between the highest and lowest point within a particular area while landforms are the descriptive words for individual features , which is used to measure precise elevations on the topographic surface a detailed map of the surface features of land. It includes the mountains, hills, creeks, and other bumps and lumps on a particular hunk of earth. The word is a Greek-rooted combo of topos meaning "place" and graphein "to write." is closer in shape to a Russet potato than an exercise ball with your little brother is sitting on it, it is a better idea to use an ellipsoid instead of a spheroid. In the Section Four, we are going to start to build a geographic coordinate system, which starts with an ellipsoid and a geoid a model of the variation between global mean (average) sea level and local mean sea level the measurement above or below the global average at a single point A GIS vector data in any sort of digital science or art, is simply denoting a type of graphical representation using straight lines to construct the outlines of objects geometry type which is made up of just one vertex pl. vertices One of a set of ordered x,y coordinate pairs that defines the shape of a line or polygon feature. , marking a single XY location in any given geographic or projected coordinate system. on the Earth's surface used for recording the elevation of topographic surface a detailed map of the surface features of land. It includes the mountains, hills, creeks, and other bumps and lumps on a particular hunk of earth. The word is a Greek-rooted combo of topos meaning "place" and graphein "to write." 's relief the difference between the highest and lowest point within a particular area while landforms are the descriptive words for individual features , which is used to measure precise elevations on the topographic surface a detailed map of the surface features of land. It includes the mountains, hills, creeks, and other bumps and lumps on a particular hunk of earth. The word is a Greek-rooted combo of topos meaning "place" and graphein "to write." before combining them with other factors to create the entire system.
Yet, since this a compromise projections attempt to balance all of the distortions in one map. This means that none of the six are "perfect", but each one is is balance with the others, the idea being that no one place is grossly distorted in comparison to any other place on the map situation, using a smooth shape (an ellipsoid) to represent a lumpy shape (the geoid a model of the variation between global mean (average) sea level and local mean sea level the measurement above or below the global average at a single point A GIS vector data in any sort of digital science or art, is simply denoting a type of graphical representation using straight lines to construct the outlines of objects geometry type which is made up of just one vertex pl. vertices One of a set of ordered x,y coordinate pairs that defines the shape of a line or polygon feature. , marking a single XY location in any given geographic or projected coordinate system. on the Earth's surface used for recording the elevation of topographic surface a detailed map of the surface features of land. It includes the mountains, hills, creeks, and other bumps and lumps on a particular hunk of earth. The word is a Greek-rooted combo of topos meaning "place" and graphein "to write." 's relief the difference between the highest and lowest point within a particular area while landforms are the descriptive words for individual features , which is used to measure precise elevations on the topographic surface a detailed map of the surface features of land. It includes the mountains, hills, creeks, and other bumps and lumps on a particular hunk of earth. The word is a Greek-rooted combo of topos meaning "place" and graphein "to write." ) will lead to situations where the two are not perfectly matched everywhere. To solve this problem, several local reference ellipsoids which may be an excellent or almost excellent fit in one area but not even touch the geoid a model of the variation between global mean (average) sea level and local mean sea level the measurement above or below the global average at a single point A GIS vector data in any sort of digital science or art, is simply denoting a type of graphical representation using straight lines to construct the outlines of objects geometry type which is made up of just one vertex pl. vertices One of a set of ordered x,y coordinate pairs that defines the shape of a line or polygon feature. , marking a single XY location in any given geographic or projected coordinate system. on the Earth's surface used for recording the elevation of topographic surface a detailed map of the surface features of land. It includes the mountains, hills, creeks, and other bumps and lumps on a particular hunk of earth. The word is a Greek-rooted combo of topos meaning "place" and graphein "to write." 's relief the difference between the highest and lowest point within a particular area while landforms are the descriptive words for individual features , which is used to measure precise elevations on the topographic surface a detailed map of the surface features of land. It includes the mountains, hills, creeks, and other bumps and lumps on a particular hunk of earth. The word is a Greek-rooted combo of topos meaning "place" and graphein "to write." in another. Local reference ellipsoids can be considered local when applied to a region, continent, country, or state. Depending on the degree of accuracy and precision desired in regards to the fit, the proper reference ellipsoid an ellipsoid that is drawn to best-fit an area. World reference ellipsoids are drawn to best-fit the entire geoid; local ellipsoids are best fit on one side to a single place of the geoid must be chosen. The purpose of multiple reference ellipsoids is one of perfect fit based on the size of an area, trying to align as much of the geoid a model of the variation between global mean (average) sea level and local mean sea level the measurement above or below the global average at a single point A GIS vector data in any sort of digital science or art, is simply denoting a type of graphical representation using straight lines to construct the outlines of objects geometry type which is made up of just one vertex pl. vertices One of a set of ordered x,y coordinate pairs that defines the shape of a line or polygon feature. , marking a single XY location in any given geographic or projected coordinate system. on the Earth's surface used for recording the elevation of topographic surface a detailed map of the surface features of land. It includes the mountains, hills, creeks, and other bumps and lumps on a particular hunk of earth. The word is a Greek-rooted combo of topos meaning "place" and graphein "to write." 's relief the difference between the highest and lowest point within a particular area while landforms are the descriptive words for individual features , which is used to measure precise elevations on the topographic surface a detailed map of the surface features of land. It includes the mountains, hills, creeks, and other bumps and lumps on a particular hunk of earth. The word is a Greek-rooted combo of topos meaning "place" and graphein "to write." as possible without variation or distortion. As you can imagine, the smaller the ellipsoid, the better the fit to a single, focused area of the geoid a model of the variation between global mean (average) sea level and local mean sea level the measurement above or below the global average at a single point A GIS vector data in any sort of digital science or art, is simply denoting a type of graphical representation using straight lines to construct the outlines of objects geometry type which is made up of just one vertex pl. vertices One of a set of ordered x,y coordinate pairs that defines the shape of a line or polygon feature. , marking a single XY location in any given geographic or projected coordinate system. on the Earth's surface used for recording the elevation of topographic surface a detailed map of the surface features of land. It includes the mountains, hills, creeks, and other bumps and lumps on a particular hunk of earth. The word is a Greek-rooted combo of topos meaning "place" and graphein "to write." 's relief the difference between the highest and lowest point within a particular area while landforms are the descriptive words for individual features , which is used to measure precise elevations on the topographic surface a detailed map of the surface features of land. It includes the mountains, hills, creeks, and other bumps and lumps on a particular hunk of earth. The word is a Greek-rooted combo of topos meaning "place" and graphein "to write." .
| FIGURE 2.15. An Example of Local and Global Reference Ellipsoids |
|---|
|
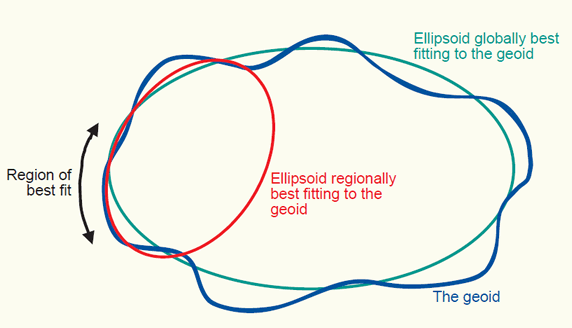
NOTE: While we draw reference ellipsoids as what appears to be two dimensional shape, it must be kept in mind that reference ellipsoids are actually three-dimensional and fit inside the three-dimensional geoid a model of the variation between global mean (average) sea level and local mean sea level the measurement above or below the global average at a single point A GIS vector data in any sort of digital science or art, is simply denoting a type of graphical representation using straight lines to construct the outlines of objects geometry type which is made up of just one vertex pl. vertices One of a set of ordered x,y coordinate pairs that defines the shape of a line or polygon feature. , marking a single XY location in any given geographic or projected coordinate system. on the Earth's surface used for recording the elevation of topographic surface a detailed map of the surface features of land. It includes the mountains, hills, creeks, and other bumps and lumps on a particular hunk of earth. The word is a Greek-rooted combo of topos meaning "place" and graphein "to write." 's relief the difference between the highest and lowest point within a particular area while landforms are the descriptive words for individual features , which is used to measure precise elevations on the topographic surface a detailed map of the surface features of land. It includes the mountains, hills, creeks, and other bumps and lumps on a particular hunk of earth. The word is a Greek-rooted combo of topos meaning "place" and graphein "to write." .
Supported Spheroids
Open in a Separate Page| Spheroid Name | WKID | Semimajor Axis | Semiminor Axis | Inverse Flattening | Eccentricity squared (e2) |
|---|---|---|---|---|---|
| 1_Ceres_2015 | 107972 | 470000 | 470000 | 0 | 0 |
| 4_Vesta_2015 | 107973 | 255000 | 255000 | 0 | 0 |
| Adrastea_2000_IAU_IAG | 107909 | 8200 | 8200 | 0 | 0 |
| Airy_1830 | 7001 | 6377563.396 | 6356256.909 | 299.3249646 | 0.00667054 |
| Airy_Modified | 7002 | 6377340.189 | 6356034.448 | 299.3249646 | 0.00667054 |
| Amalthea_2000_IAU_IAG | 107910 | 83500 | 83500 | 0 | 0 |
| Ananke_2000_IAU_IAG | 107911 | 10000 | 10000 | 0 | 0 |
| Ariel_2000_IAU_IAG | 107945 | 578900 | 578900 | 0 | 0 |
| Atlas_2000_IAU_IAG | 107926 | 16000 | 16000 | 0 | 0 |
| ATS_1977 | 7041 | 6378135 | 6356750.305 | 298.257 | 0.00669438 |
| Australian | 7003 | 6378160 | 6356774.719 | 298.25 | 0.00669454 |
| Belinda_2000_IAU_IAG | 107946 | 33000 | 33000 | 0 | 0 |
| Bessel_1841 | 7004 | 6377397.155 | 6356078.963 | 299.1528128 | 0.00667437 |
| Bessel_Modified | 7005 | 6377492.018 | 6356173.509 | 299.1528128 | 0.00667437 |
| Bessel_Namibia | 7006 | 6377483.865 | 6356165.383 | 299.1528128 | 0.00667437 |
| Bianca_2000_IAU_IAG | 107947 | 21000 | 21000 | 0 | 0 |
| Callisto_2000_IAU_IAG | 107912 | 2409300 | 2409300 | 0 | 0 |
| Calypso_2000_IAU_IAG | 107927 | 9500 | 9500 | 0 | 0 |
| Carme_2000_IAU_IAG | 107913 | 15000 | 15000 | 0 | 0 |
| CGCS2000 | 1024 | 6378137 | 6356752.314 | 298.2572221 | 0.00669438 |
| Charon_2000_IAU_IAG | 107970 | 593000 | 593000 | 0 | 0 |
| Clarke_1858 | 7007 | 6378293.645 | 6356617.988 | 294.2606764 | 0.00678515 |
| Clarke_1866 | 7008 | 6378206.4 | 6356583.8 | 294.9786982 | 0.00676866 |
| Clarke_1866_Michigan | 7009 | 6378450.047 | 6356826.62 | 294.9786847 | 0.00676866 |
| Clarke_1880 | 7034 | 6378249.145 | 6356514.966 | 293.4663077 | 0.00680348 |
| Clarke_1880_Arc | 7013 | 6378249.145 | 6356514.966 | 293.4663077 | 0.00680348 |
| Clarke_1880_Benoit | 7010 | 6378300.789 | 6356566.435 | 293.4663155 | 0.00680348 |
| Clarke_1880_IGN | 7011 | 6378249.2 | 6356515 | 293.4660213 | 0.00680349 |
| Clarke_1880_Intl_Ft | 7055 | 6378306.37 | 6356571.996 | 293.4663077 | 0.00680348 |
| Clarke_1880_RGS | 7012 | 6378249.145 | 6356514.87 | 293.465 | 0.00680351 |
| Clarke_1880_SGA | 7014 | 6378249.2 | 6356514.997 | 293.46598 | 0.00680349 |
| Cordelia_2000_IAU_IAG | 107948 | 13000 | 13000 | 0 | 0 |
| Cressida_2000_IAU_IAG | 107949 | 31000 | 31000 | 0 | 0 |
| Danish_1876 | 7051 | 6377019.27 | 6355762.539 | 300 | 0.00665556 |
| Deimos_2000_IAU_IAG | 107906 | 6200 | 6200 | 0 | 0 |
| Desdemona_2000_IAU_IAG | 107950 | 27000 | 27000 | 0 | 0 |
| Despina_2000_IAU_IAG | 107961 | 74000 | 74000 | 0 | 0 |
| Dione_2000_IAU_IAG | 107928 | 560000 | 560000 | 0 | 0 |
| Elara_2000_IAU_IAG | 107914 | 40000 | 40000 | 0 | 0 |
| Enceladus_2000_IAU_IAG | 107929 | 249400 | 249400 | 0 | 0 |
| Epimetheus_2000_IAU_IAG | 107930 | 59500 | 59500 | 0 | 0 |
| Europa_2000_IAU_IAG | 107915 | 1562090 | 1562090 | 0 | 0 |
| Everest_1830 | 7042 | 6377299.36 | 6356098.352 | 300.8017 | 0.00663785 |
| Everest_1830_Modified | 7018 | 6377304.063 | 6356103.039 | 300.8017 | 0.00663785 |
| Everest_Adjustment_1937 | 7015 | 6377276.345 | 6356075.413 | 300.8017 | 0.00663785 |
| Everest_Definition_1962 | 7044 | 6377301.243 | 6356100.23 | 300.8017255 | 0.00663785 |
| Everest_Definition_1967 | 7016 | 6377298.556 | 6356097.55 | 300.8017 | 0.00663785 |
| Everest_Definition_1975 | 7045 | 6377299.151 | 6356098.145 | 300.8017255 | 0.00663785 |
| Everest_Modified_1969 | 7056 | 6377295.664 | 6356094.668 | 300.8017 | 0.00663785 |
| Fischer_1960 | 107002 | 6378166 | 6356784.284 | 298.3 | 0.00669342 |
| Fischer_1968 | 107003 | 6378150 | 6356768.337 | 298.3 | 0.00669342 |
| Fischer_Modified | 107004 | 6378155 | 6356773.32 | 298.3 | 0.00669342 |
| Galatea_2000_IAU_IAG | 107962 | 79000 | 79000 | 0 | 0 |
| Ganymede_2000_IAU_IAG | 107916 | 2632345 | 2632345 | 0 | 0 |
| GEM_10C | 7031 | 6378137 | 6356752.314 | 298.2572236 | 0.00669438 |
| GRS_1967 | 7036 | 6378160 | 6356774.516 | 298.2471674 | 0.00669461 |
| GRS_1967_Truncated | 7050 | 6378160 | 6356774.719 | 298.25 | 0.00669454 |
| GRS_1980 | 7019 | 6378137 | 6356752.314 | 298.2572221 | 0.00669438 |
| GRS_1980_Adj_WI_CP | 107806 | 6378412.542 | 6357027.856 | 298.2701071 | 0.00669409 |
| GSK-2011 | 1025 | 6378136.5 | 6356751.758 | 298.2564151 | 0.0066944 |
| Helene_2000_IAU_IAG | 107931 | 16000 | 16000 | 0 | 0 |
| Helmert_1906 | 7020 | 6378200 | 6356818.17 | 298.3 | 0.00669342 |
| Himalia_2000_IAU_IAG | 107917 | 85000 | 85000 | 0 | 0 |
| Hough_1960 | 7053 | 6378270 | 6356794.343 | 297 | 0.00672267 |
| Hughes_1980 | 7058 | 6378273 | 6356889.449 | 298.2794111 | 0.00669388 |
| Hyperion_2000_IAU_IAG | 107932 | 133000 | 133000 | 0 | 0 |
| Iapetus_2000_IAU_IAG | 107933 | 718000 | 718000 | 0 | 0 |
| Indonesian | 7021 | 6378160 | 6356774.504 | 298.247 | 0.00669461 |
| International_1924 | 7022 | 6378388 | 6356911.946 | 297 | 0.00672267 |
| International_1967 | 7023 | 6378160 | 6356774.719 | 298.25 | 0.00669454 |
| Io_2000_IAU_IAG | 107918 | 1821460 | 1821460 | 0 | 0 |
| Janus_2000_IAU_IAG 1 | 107934 | 88800 | 88800 | 0 | 0 |
| Juliet_2000_IAU_IAG | 107951 | 42000 | 42000 | 0 | 0 |
| Jupiter_2000_IAU_IAG | 107908 | 71492000 | 66854000 | 15.41440276 | 0.1255401 |
| Krasovsky_1940 | 7024 | 6378245 | 6356863.019 | 298.3 | 0.00669342 |
| Larissa_2000_IAU_IAG | 107963 | 104000 | 89000 | 6.93333333 | 0.26765902 |
| Leda_2000_IAU_IAG | 107919 | 5000 | 5000 | 0 | 0 |
| Lysithea_2000_IAU_IAG | 107920 | 12000 | 12000 | 0 | 0 |
| Mars_1979_IAU_IAG | 107904 | 3393400 | 3375730 | 192.0430108 | 0.01038722 |
| Mars_2000_IAU_IAG | 107905 | 3396190 | 3376200 | 169.8944472 | 0.01173737 |
| Mars_2000_(Sphere) | 107971 | 3396190 | 3396190 | 0 | 0 |
| Mercury_2000_IAU_IAG | 107900 | 2439700 | 2439700 | 0 | 0 |
| Mercury_2015 | 107974 | 2439400 | 2439400 | 0 | 0 |
| Metis_2000_IAU_IAG | 107921 | 30000 | 20000 | 3 | 0.55555556 |
| Mimas_2000_IAU_IAG 2 | 107935 | 198630 | 198630 | 0 | 0 |
| Miranda_2000_IAU_IAG | 107952 | 235800 | 235800 | 0 | 0 |
| Moon_2000_IAU_IAG | 107903 | 1737400 | 1737400 | 0 | 0 |
| Naiad_2000_IAU_IAG | 107964 | 29000 | 29000 | 0 | 0 |
| Neptune_2000_IAU_IAG | 107960 | 24764000 | 24341000 | 58.54373522 | 0.03387072 |
| Nereid_2000_IAU_IAG | 107965 | 170000 | 170000 | 0 | 0 |
| NWL_10D | 7026 | 6378135 | 6356750.52 | 298.26 | 0.00669432 |
| NWL_9D | 7025 | 6378145 | 6356759.769 | 298.25 | 0.00669454 |
| Oberon_2000_IAU_IAG | 107953 | 761400 | 761400 | 0 | 0 |
| Ophelia_2000_IAU_IAG | 107954 | 15000 | 15000 | 0 | 0 |
| OSU_86F | 7032 | 6378136.2 | 6356751.517 | 298.2572236 | 0.00669438 |
| OSU_91A | 7033 | 6378136.3 | 6356751.617 | 298.2572236 | 0.00669438 |
| Pan_2000_IAU_IAG | 107936 | 10000 | 10000 | 0 | 0 |
| Pandora_2000_IAU_IAG | 107937 | 41900 | 41900 | 0 | 0 |
| Pasiphae_2000_IAU_IAG | 107922 | 18000 | 18000 | 0 | 0 |
| Phobos_2000_IAU_IAG | 107907 | 11100 | 11100 | 0 | 0 |
| Phoebe_2000_IAU_IAG | 107938 | 110000 | 110000 | 0 | 0 |
| Plessis_1817 | 7027 | 6376523 | 6355862.933 | 308.64 | 0.00646954 |
| Pluto_2000_IAU_IAG | 107969 | 1195000 | 1195000 | 0 | 0 |
| Portia_2000_IAU_IAG | 107955 | 54000 | 54000 | 0 | 0 |
| Prometheus_2000_IAU_IAG | 107939 | 50100 | 50100 | 0 | 0 |
| Proteus_2000_IAU_IAG | 107966 | 208000 | 208000 | 0 | 0 |
| Puck_2000_IAU_IAG | 107956 | 77000 | 77000 | 0 | 0 |
| PZ_1990 | 7054 | 6378136 | 6356751.362 | 298.2578393 | 0.00669437 |
| Rhea_2000_IAU_IAG | 107940 | 764000 | 764000 | 0 | 0 |
| Rosalind_2000_IAU_IAG | 107957 | 27000 | 27000 | 0 | 0 |
| Saturn_2000_IAU_IAG | 107925 | 60268000 | 54364000 | 10.20799458 | 0.18632823 |
| S_GRS_1980_Adj_MN_Anoka | 107700 | 6378418.941 | 6357033.31 | 298.2572221 | 0.00669438 |
| S_GRS_1980_Adj_MN_Becker | 107701 | 6378586.581 | 6357200.388 | 298.2572221 | 0.00669438 |
| S_GRS_1980_Adj_MN_Beltrami_Nort h | 107702 | 6378505.809 | 6357119.887 | 298.2572221 | 0.00669438 |
| S_GRS_1980_Adj_MN_Beltrami_ South | 107703 | 6378544.823 | 6357158.77 | 298.2572221 | 0.00669438 |
| S_GRS_1980_Adj_MN_Benton | 107704 | 6378490.569 | 6357104.698 | 298.2572221 | 0.00669438 |
| S_GRS_1980_Adj_MN_Big_Stone | 107705 | 6378470.757 | 6357084.952 | 298.2572221 | 0.00669438 |
| S_GRS_1980_Adj_MN_Blue_Earth | 107706 | 6378403.701 | 6357018.121 | 298.2572221 | 0.00669438 |
| S_GRS_1980_Adj_MN_Brown | 107707 | 6378434.181 | 6357048.499 | 298.2572221 | 0.00669438 |
| S_GRS_1980_Adj_MN_Carlton | 107708 | 6378454.907 | 6357069.155 | 298.2572221 | 0.00669438 |
| S_GRS_1980_Adj_MN_Carver | 107709 | 6378400.653 | 6357015.083 | 298.2572221 | 0.00669438 |
| S_GRS_1980_Adj_MN_Cass_North | 107710 | 6378567.378 | 6357181.249 | 298.2572221 | 0.00669438 |
| S_GRS_1980_Adj_MN_Cass_South | 107711 | 6378546.957 | 6357160.897 | 298.2572221 | 0.00669438 |
| S_GRS_1980_Adj_MN_Chippewa | 107712 | 6378476.853 | 6357091.028 | 298.2572221 | 0.00669438 |
| S_GRS_1980_Adj_MN_Chisago | 107713 | 6378411.321 | 6357025.715 | 298.2572221 | 0.00669438 |
| S_GRS_1980_Adj_MN_Cook_North | 107714 | 6378647.541 | 6357261.143 | 298.2572221 | 0.00669438 |
| S_GRS_1980_Adj_MN_Cook_South | 107715 | 6378647.541 | 6357261.143 | 298.2572221 | 0.00669438 |
| S_GRS_1980_Adj_MN_Cottonwood | 107716 | 6378514.953 | 6357129 | 298.2572221 | 0.00669438 |
| S_GRS_1980_Adj_MN_Crow_Wing | 107717 | 6378546.957 | 6357160.897 | 298.2572221 | 0.00669438 |
| S_GRS_1980_Adj_MN_Dakota | 107718 | 6378421.989 | 6357036.348 | 298.2572221 | 0.00669438 |
| S_GRS_1980_Adj_MN_Dodge | 107719 | 6378481.425 | 6357095.584 | 298.2572221 | 0.00669438 |
| S_GRS_1980_Adj_MN_Douglas | 107720 | 6378518.001 | 6357132.038 | 298.2572221 | 0.00669438 |
| S_GRS_1980_Adj_MN_Faribault | 107721 | 6378521.049 | 6357135.075 | 298.2572221 | 0.00669438 |
| S_GRS_1980_Adj_MN_Fillmore | 107722 | 6378464.661 | 6357078.877 | 298.2572221 | 0.00669438 |
| S_GRS_1980_Adj_MN_Freeborn | 107723 | 6378521.049 | 6357135.075 | 298.2572221 | 0.00669438 |
| S_GRS_1980_Adj_MN_Goodhue | 107724 | 6378434.181 | 6357048.499 | 298.2572221 | 0.00669438 |
| S_GRS_1980_Adj_MN_Grant | 107725 | 6378518.001 | 6357132.038 | 298.2572221 | 0.00669438 |
| S_GRS_1980_Adj_MN_Hennepin | 107726 | 6378418.941 | 6357033.31 | 298.2572221 | 0.00669438 |
| S_GRS_1980_Adj_MN_Houston | 107727 | 6378436.619 | 6357050.929 | 298.2572221 | 0.00669438 |
| S_GRS_1980_Adj_MN_Isanti | 107728 | 6378411.321 | 6357025.715 | 298.2572221 | 0.00669438 |
| S_GRS_1980_Adj_MN_Itasca_North | 107729 | 6378574.389 | 6357188.237 | 298.2572221 | 0.00669438 |
| S_GRS_1980_Adj_MN_Itasca_South | 107730 | 6378574.389 | 6357188.237 | 298.2572221 | 0.00669438 |
| S_GRS_1980_Adj_MN_Jackson | 107731 | 6378521.049 | 6357135.075 | 298.2572221 | 0.00669438 |
| S_GRS_1980_Adj_MN_Kanabec | 107732 | 6378472.281 | 6357086.471 | 298.2572221 | 0.00669438 |
| S_GRS_1980_Adj_MN_Kandiyohi | 107733 | 6378498.189 | 6357112.292 | 298.2572221 | 0.00669438 |
| S_GRS_1980_Adj_MN_Kittson | 107734 | 6378449.421 | 6357063.688 | 298.2572221 | 0.00669438 |
| S_GRS_1980_Adj_MN_Koochiching | 107735 | 6378525.621 | 6357139.632 | 298.2572221 | 0.00669438 |
| S_GRS_1980_Adj_MN_Lac_Qui_Parle | 107736 | 6378476.853 | 6357091.028 | 298.2572221 | 0.00669438 |
| S_GRS_1980_Adj_MN_Lake_of_the_ Woods_North | 107737 | 6378466.185 | 6357080.395 | 298.2572221 | 0.00669438 |
| S_GRS_1980_Adj_MN_Lake_of_the_ Woods_South | 107738 | 6378496.665 | 6357110.773 | 298.2572221 | 0.00669438 |
| S_GRS_1980_Adj_MN_Le_Sueur | 107739 | 6378434.181 | 6357048.499 | 298.2572221 | 0.00669438 |
| S_GRS_1980_Adj_MN_Lincoln | 107740 | 6378643.579 | 6357257.195 | 298.2572221 | 0.00669438 |
| S_GRS_1980_Adj_MN_Lyon | 107741 | 6378559.758 | 6357173.655 | 298.2572221 | 0.00669438 |
| S_GRS_1980_Adj_MN_Mahnomen | 107743 | 6378586.581 | 6357200.388 | 298.2572221 | 0.00669438 |
| S_GRS_1980_Adj_MN_Marshall | 107744 | 6378441.801 | 6357056.093 | 298.2572221 | 0.00669438 |
| S_GRS_1980_Adj_MN_Martin | 107745 | 6378521.049 | 6357135.075 | 298.2572221 | 0.00669438 |
| S_GRS_1980_Adj_MN_McLeod | 107742 | 6378414.369 | 6357028.753 | 298.2572221 | 0.00669438 |
| S_GRS_1980_Adj_MN_Meeker | 107746 | 6378498.189 | 6357112.292 | 298.2572221 | 0.00669438 |
| S_GRS_1980_Adj_MN_Morrison | 107747 | 6378502.761 | 6357116.849 | 298.2572221 | 0.00669438 |
| S_GRS_1980_Adj_MN_Mower | 107748 | 6378521.049 | 6357135.075 | 298.2572221 | 0.00669438 |
| S_GRS_1980_Adj_MN_Murray | 107749 | 6378617.061 | 6357230.766 | 298.2572221 | 0.00669438 |
| S_GRS_1980_Adj_MN_Nicollet | 107750 | 6378403.701 | 6357018.121 | 298.2572221 | 0.00669438 |
| S_GRS_1980_Adj_MN_Nobles | 107751 | 6378624.681 | 6357238.36 | 298.2572221 | 0.00669438 |
| S_GRS_1980_Adj_MN_Norman | 107752 | 6378468.623 | 6357082.825 | 298.2572221 | 0.00669438 |
| S_GRS_1980_Adj_MN_Olmsted | 107753 | 6378481.425 | 6357095.584 | 298.2572221 | 0.00669438 |
| S_GRS_1980_Adj_MN_Ottertail | 107754 | 6378525.621 | 6357139.632 | 298.2572221 | 0.00669438 |
| S_GRS_1980_Adj_MN_Pennington | 107755 | 6378445.763 | 6357060.042 | 298.2572221 | 0.00669438 |
| S_GRS_1980_Adj_MN_Pine | 107756 | 6378472.281 | 6357086.471 | 298.2572221 | 0.00669438 |
| S_GRS_1980_Adj_MN_Pipestone | 107757 | 6378670.401 | 6357283.927 | 298.2572221 | 0.00669438 |
| S_GRS_1980_Adj_MN_Polk | 107758 | 6378445.763 | 6357060.042 | 298.2572221 | 0.00669438 |
| S_GRS_1980_Adj_MN_Pope | 107759 | 6378502.761 | 6357116.849 | 298.2572221 | 0.00669438 |
| S_GRS_1980_Adj_MN_Ramsey | 107760 | 6378418.941 | 6357033.31 | 298.2572221 | 0.00669438 |
| S_GRS_1980_Adj_MN_Red_Lake | 107761 | 6378445.763 | 6357060.042 | 298.2572221 | 0.00669438 |
| S_GRS_1980_Adj_MN_Redwood | 107762 | 6378438.753 | 6357053.055 | 298.2572221 | 0.00669438 |
| S_GRS_1980_Adj_MN_Renville | 107763 | 6378414.369 | 6357028.753 | 298.2572221 | 0.00669438 |
| S_GRS_1980_Adj_MN_Rice | 107764 | 6378434.181 | 6357048.499 | 298.2572221 | 0.00669438 |
| S_GRS_1980_Adj_MN_Rock | 107765 | 6378624.681 | 6357238.36 | 298.2572221 | 0.00669438 |
| S_GRS_1980_Adj_MN_Roseau | 107766 | 6378449.421 | 6357063.688 | 298.2572221 | 0.00669438 |
| S_GRS_1980_Adj_MN_Scott | 107770 | 6378421.989 | 6357036.348 | 298.2572221 | 0.00669438 |
| S_GRS_1980_Adj_MN_Sherburne | 107771 | 6378443.325 | 6357057.612 | 298.2572221 | 0.00669438 |
| S_GRS_1980_Adj_MN_Sibley | 107772 | 6378414.369 | 6357028.753 | 298.2572221 | 0.00669438 |
| S_GRS_1980_Adj_MN_Stearns | 107773 | 6378502.761 | 6357116.849 | 298.2572221 | 0.00669438 |
| S_GRS_1980_Adj_MN_Steele | 107774 | 6378481.425 | 6357095.584 | 298.2572221 | 0.00669438 |
| S_GRS_1980_Adj_MN_Stevens | 107775 | 6378502.761 | 6357116.849 | 298.2572221 | 0.00669438 |
| S_GRS_1980_Adj_MN_St_Louis | 107786 | 6378523 | 6357138.314 | 298.2752724 | 0.00669398 |
| S_GRS_1980_Adj_MN_St_Louis_ Central | 107768 | 6378605.783 | 6357219.525 | 298.2572221 | 0.00669438 |
| S_GRS_1980_Adj_MN_St_Louis_North | 107767 | 6378543.909 | 6357157.859 | 298.2572221 | 0.00669438 |
| S_GRS_1980_Adj_MN_St_Louis_South | 107769 | 6378540.861 | 6357154.821 | 298.2572221 | 0.00669438 |
| S_GRS_1980_Adj_MN_Swift | 107776 | 6378470.757 | 6357084.952 | 298.2572221 | 0.00669438 |
| S_GRS_1980_Adj_MN_Todd | 107777 | 6378548.481 | 6357162.416 | 298.2572221 | 0.00669438 |
| S_GRS_1980_Adj_MN_Traverse | 107778 | 6378463.746 | 6357077.965 | 298.2572221 | 0.00669438 |
| S_GRS_1980_Adj_MN_Wabasha | 107779 | 6378426.561 | 6357040.904 | 298.2572221 | 0.00669438 |
| S_GRS_1980_Adj_MN_Wadena | 107780 | 6378546.957 | 6357160.897 | 298.2572221 | 0.00669438 |
| S_GRS_1980_Adj_MN_Waseca | 107781 | 6378481.425 | 6357095.584 | 298.2572221 | 0.00669438 |
| S_GRS_1980_Adj_MN_Watonwan | 107782 | 6378514.953 | 6357129 | 298.2572221 | 0.00669438 |
| S_GRS_1980_Adj_MN_Winona | 107783 | 6378453.688 | 6357067.94 | 298.2572221 | 0.00669438 |
| S_GRS_1980_Adj_MN_Wright | 107784 | 6378443.325 | 6357057.612 | 298.2572221 | 0.00669438 |
| S_GRS_1980_Adj_MN_Yellow_ Medicine | 107785 | 6378530.193 | 6357144.189 | 298.2572221 | 0.00669438 |
| Sinope_2000_IAU_IAG | 107923 | 14000 | 14000 | 0 | 0 |
| Sphere | 7035 | 6371000 | 6371000 | 0 | 0 |
| Sphere_ARC_INFO | 107008 | 6370997 | 6370997 | 0 | 0 |
| Sphere_Clarke_1866_Authalic | 7052 | 6370997 | 6370997 | 0 | 0 |
| Sphere_EMEP | 107009 | 6370000 | 6370000 | 0 | 0 |
| Sphere_GRS_1980_Authalic | 7048 | 6371007 | 6371007 | 0 | 0 |
| Sphere_GRS_1980_Mean_Radius | 107047 | 6371008.771 | 6371008.771 | 0 | 0 |
| Sphere_International_1924_Authalic | 7057 | 6371228 | 6371228 | 0 | 0 |
| Struve_1860 | 7028 | 6378298.3 | 6356657.143 | 294.73 | 0.00677436 |
| Sun_2015 | 107975 | 695700000 | 695700000 | 0 | 0 |
| Telesto_2000_IAU_IAG | 107941 | 11000 | 11000 | 0 | 0 |
| Tethys_2000_IAU_IAG | 107942 | 529800 | 529800 | 0 | 0 |
| Thalassa_2000_IAU_IAG | 107967 | 40000 | 40000 | 0 | 0 |
| Thebe_2000_IAU_IAG | 107924 | 49300 | 49300 | 0 | 0 |
| Titan_2000_IAU_IAG | 107943 | 2575000 | 2575000 | 0 | 0 |
| Titania_2000_IAU_IAG | 107958 | 788900 | 788900 | 0 | 0 |
| Triton_2000_IAU_IAG | 107968 | 1352600 | 1352600 | 0 | 0 |
| Umbriel_2000_IAU_IAG | 107959 | 584700 | 584700 | 0 | 0 |
| Uranus_2000_IAU_IAG | 107944 | 25559000 | 24973000 | 43.61604096 | 0.04532903 |
| Venus_1985_IAU_IAG_COSPAR | 107901 | 6051000 | 6051000 | 0 | 0 |
| Venus_2000_IAU_IAG | 107902 | 6051800 | 6051800 | 0 | 0 |
| Walbeck | 107007 | 6376896 | 6355834.847 | 302.78 | 0.00659455 |
| War_Office | 7029 | 6378300 | 6356751.689 | 296 | 0.00674534 |
| WGS_1966 | 107001 | 6378145 | 6356759.769 | 298.25 | 0.00669454 |
| WGS_1972 | 7043 | 6378135 | 6356750.52 | 298.26 | 0.00669432 |
| WGS_1984 | 7030 | 6378137 | 6356752.314 | 298.2572236 | 0.00669438 |
| Xian_1980 | 7049 | 6378140 | 6356755.288 | 298.257 | 0.00669438 |
| Zach_1812 | 1026 | 6376045 | 6355477.113 | 310 | 0.00644121 |