In this section, we will take a closer look at ArcGIS Pro, the modern GIS application that replaces ArcMap from previous versions of ArcGIS. ArcGIS Pro is a streamlined, project-based application designed for data visualization, analysis, and cartography. Unlike ArcMap, which relied on separate applications like ArcCatalog, ArcGIS Pro integrates all functions—data management, analysis, and mapping—within a single interface.
By the end of the semester, you should be familiar with the layout and tools of ArcGIS Pro, allowing you to efficiently navigate and work with GIS data. If you ever need a refresher, you can return to this section for reference.
4.4.2: The ArcGIS Pro Interface
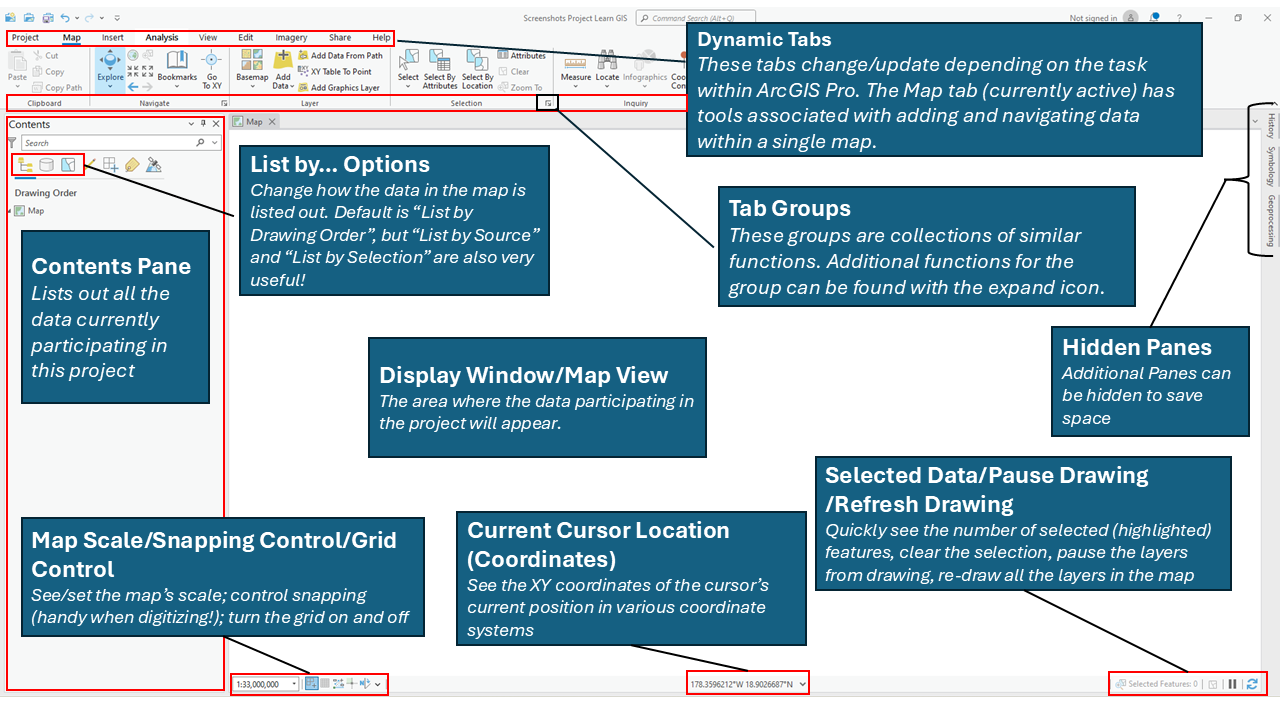
ArcGIS Pro follows a ribbon-based interface similar to other modern software like Microsoft Office. Instead of static toolbars, ArcGIS Pro uses dynamic tabs that change based on the selected tool or dataset. The main components of the interface include:
- The Ribbon – Located at the top, this replaces traditional menus and toolbars, grouping tools into contextual tabs.
- The Catalog Pane – Replacing ArcCatalog, this pane provides direct access to folder connections, databases, toolboxes, and project resources.
- The Contents Pane – Displays the layers currently loaded in your project, similar to the Table of Contents in ArcMap.
- The Map View – The primary workspace where you visualize, edit, and analyze data. This area updates dynamically depending on the active map or layout.
- The Geoprocessing Pane – Provides access to spatial analysis and data management tools, replacing ArcToolbox.
- The Layout View – Used for creating cartographic map layouts, allowing for advanced customization of map elements.
Unlike ArcMap, ArcGIS Pro supports multiple maps, layouts, and 3D scenes within a single project, providing a more efficient and organized workflow.
Next, we will explore the various views in ArcGIS Pro, including maps, layouts, scenes, and tables, and how they help you interact with your GIS Geographic Information Systems the software used to create, store, and manage spatial data Data that deals with location, such as lists of addresses, the footprint of a building, the boundaries of cities and counties, etc. , analyze spatial problems, and display the data in cartographic layouts Geographic Information Sciences data.
| Figure 4.5: ArcGIS Pro's Basic Layout |
|---|
 |
4.4.3: Views and Areas of ArcGIS Pro
This first section will look at the major areas inside the ArcGIS Pro map view, where we list and interact with the data participating in the current project. Understanding the basic layout of ArcGIS Pro will help familiarize you with what to expect the first time you turn the software on instead of a surprise.
Map View vs Layout View
Since ArcGIS Pro is used to analyze and display our data, we have two distinct views in the software: map view and layout view. Map view is where we spent the majority of our time (compared to Catalog view and layout view), as the majority of our work is done creating and manipulating spatial data Data that deals with location, such as lists of addresses, the footprint of a building, the boundaries of cities and counties, etc. . Once we've taken the time to examine the data in great detail, both in the way the features, or the shapes representing real world objects, and the attributes in the attribute table, we switch over to layout view to complete the cartographic layout. Layouts can be created via the Insert menu > New Layout.
| Figure 4.6: Map View vs Layout View in ArcGIS Pro | |
|---|---|
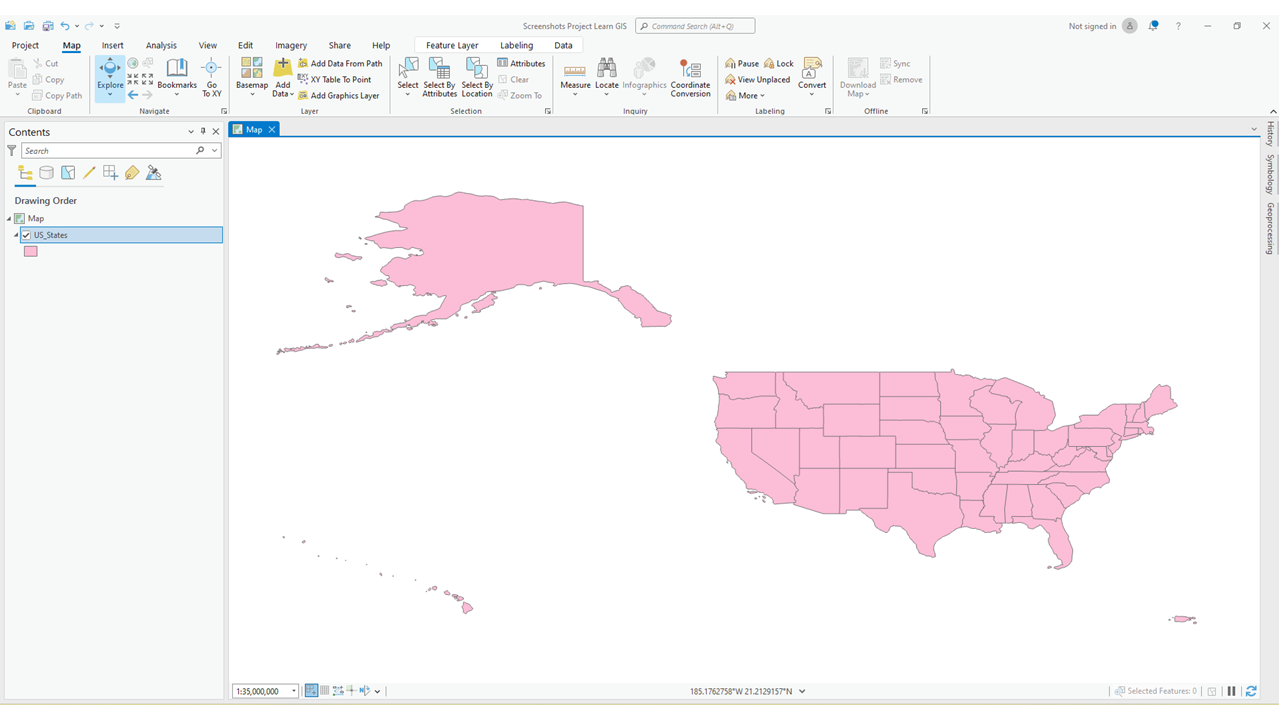 |  |
| Map View is where you will spend most of your time interacting with your data, running geoprocessing analysis tools, and exploring attribute table information | Layout View is where you will create and share final products (maps) for print and digital uses |
Display Window and Maps in ArcGIS Pro
The Display Window in ArcGIS Pro is the central workspace where you interact with, analyze, and visualize spatial data Data that deals with location, such as lists of addresses, the footprint of a building, the boundaries of cities and counties, etc. . This is where layers are drawn, geoprocessing tools are run, and relationships between datasets are explored. Unlike software that limits users to a single map view at a time, ArcGIS Pro allows you to work with multiple maps simultaneously, making it easier to compare geographic patterns, analyze spatial relationships, and create detailed map layouts.
Maps in ArcGIS Pro
Each map in ArcGIS Pro is an independent workspace where you can load and interact with spatial data Data that deals with location, such as lists of addresses, the footprint of a building, the boundaries of cities and counties, etc. . A map contains layers of different data types, such as vector layers (points, lines, and polygons) or raster layers (aerial imagery or elevation the vertical distance between local mean sea level the measurement above or below the global average at a single point A GIS vector data in any sort of digital science or art, is simply denoting a type of graphical representation using straight lines to construct the outlines of objects geometry type which is made up of just one vertex pl. vertices One of a set of ordered x,y coordinate pairs that defines the shape of a line or polygon feature. , marking a single XY location in any given geographic or projected coordinate system. on the Earth's surface used for recording the elevation of topographic surface a detailed map of the surface features of land. It includes the mountains, hills, creeks, and other bumps and lumps on a particular hunk of earth. The word is a Greek-rooted combo of topos meaning "place" and graphein "to write." 's relief the difference between the highest and lowest point within a particular area while landforms are the descriptive words for individual features and a single point A GIS vector data in any sort of digital science or art, is simply denoting a type of graphical representation using straight lines to construct the outlines of objects geometry type which is made up of just one vertex pl. vertices One of a set of ordered x,y coordinate pairs that defines the shape of a line or polygon feature. , marking a single XY location in any given geographic or projected coordinate system. on the Earth's surface models). Because each map exists separately, you can apply different symbology, coordinate systems, and visualization settings without affecting other maps in the same project.
One of the biggest advantages of multiple maps is that they allow for simultaneous comparison of datasets. For example, you might have one map displaying historical land cover while another map shows current land use. Instead of toggling layers on and off within a single map, you can keep both views open and switch between them instantly or even view them side by side. This is especially useful when performing change detection analysis, environmental monitoring, or spatial planning.
Additionally, maps in ArcGIS Pro can be either 2D or 3D. While 2D maps are the standard format for most GIS Geographic Information Systems the software used to create, store, and manage spatial data Data that deals with location, such as lists of addresses, the footprint of a building, the boundaries of cities and counties, etc. , analyze spatial problems, and display the data in cartographic layouts Geographic Information Sciences tasks, 3D scenes allow for elevation the vertical distance between local mean sea level the measurement above or below the global average at a single point A GIS vector data in any sort of digital science or art, is simply denoting a type of graphical representation using straight lines to construct the outlines of objects geometry type which is made up of just one vertex pl. vertices One of a set of ordered x,y coordinate pairs that defines the shape of a line or polygon feature. , marking a single XY location in any given geographic or projected coordinate system. on the Earth's surface used for recording the elevation of topographic surface a detailed map of the surface features of land. It includes the mountains, hills, creeks, and other bumps and lumps on a particular hunk of earth. The word is a Greek-rooted combo of topos meaning "place" and graphein "to write." 's relief the difference between the highest and lowest point within a particular area while landforms are the descriptive words for individual features and a single point A GIS vector data in any sort of digital science or art, is simply denoting a type of graphical representation using straight lines to construct the outlines of objects geometry type which is made up of just one vertex pl. vertices One of a set of ordered x,y coordinate pairs that defines the shape of a line or polygon feature. , marking a single XY location in any given geographic or projected coordinate system. on the Earth's surface modeling, urban planning, and terrain analysis, adding an additional dimension to spatial data Data that deals with location, such as lists of addresses, the footprint of a building, the boundaries of cities and counties, etc. interpretation. You can work with both 2D and 3D maps within the same project, making it easy to integrate surface and elevation the vertical distance between local mean sea level the measurement above or below the global average at a single point A GIS vector data in any sort of digital science or art, is simply denoting a type of graphical representation using straight lines to construct the outlines of objects geometry type which is made up of just one vertex pl. vertices One of a set of ordered x,y coordinate pairs that defines the shape of a line or polygon feature. , marking a single XY location in any given geographic or projected coordinate system. on the Earth's surface used for recording the elevation of topographic surface a detailed map of the surface features of land. It includes the mountains, hills, creeks, and other bumps and lumps on a particular hunk of earth. The word is a Greek-rooted combo of topos meaning "place" and graphein "to write." 's relief the difference between the highest and lowest point within a particular area while landforms are the descriptive words for individual features and a single point A GIS vector data in any sort of digital science or art, is simply denoting a type of graphical representation using straight lines to construct the outlines of objects geometry type which is made up of just one vertex pl. vertices One of a set of ordered x,y coordinate pairs that defines the shape of a line or polygon feature. , marking a single XY location in any given geographic or projected coordinate system. on the Earth's surface data into your workflow.
Managing and Navigating Multiple Maps
ArcGIS Pro organizes maps into tabs, similar to how web browsers handle multiple open pages. This makes it easy to:
- Switch between maps instantly without needing to reload data.
- Compare different datasets side by side by opening multiple maps in different view panels.
- Use map linking tools to synchronize panning and zooming across multiple maps, which is particularly useful when analyzing geographic changes over time.
Maps are managed in the Catalog Pane, where you can create, rename, and organize them within a project. Because ArcGIS Pro is project-based, all maps and their associated data remain accessible within a single workspace, eliminating the need to open and close separate files.
Layouts and Inset Maps
While Map View is used for data exploration and analysis, Layout View is where you design and finalize a cartographic presentation of your map. A layout allows you to assemble multiple map elements into a polished design, including:
- Maps (main maps and inset maps)
- Legends (to describe symbols and classifications)
- North arrows (for orientation)
- Scale bars (to indicate distances)
- Titles and text annotations
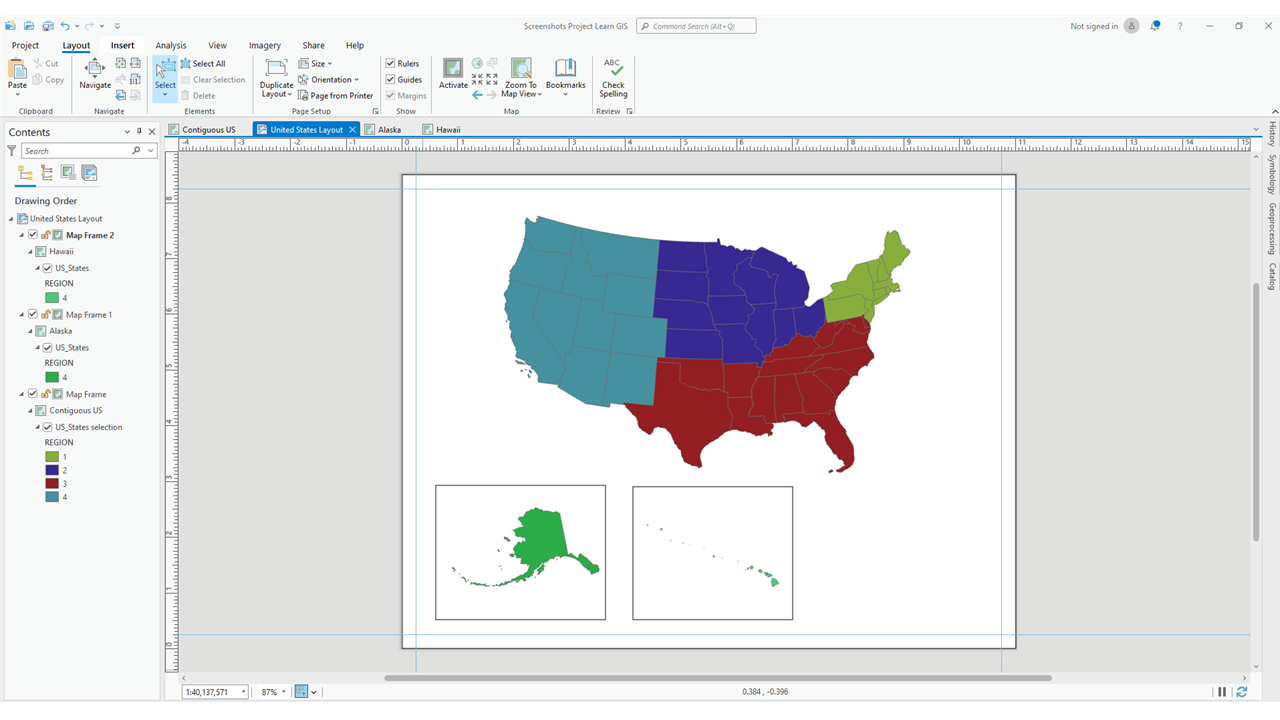
One of the most powerful features of ArcGIS Pro is the ability to insert multiple maps into a single layout. This is useful for:
- Creating inset maps, which show a zoomed-in detail of a specific area while maintaining context within a larger map.
- Comparing different datasets, such as before-and-after satellite imagery or environmental changes over time.
- Reducing empty space by incorporating multiple geographic regions, such as Alaska and Hawaii alongside the contiguous U.S. in a single map layout.
Layouts in ArcGIS Pro are dynamic, meaning that any updates made to the source maps—such as symbology changes or layer modifications—are automatically reflected in the layout. This eliminates the need to manually update each map when changes occur.
The Flexibility of Multiple Maps in ArcGIS Pro
By supporting multiple maps within a single project, ArcGIS Pro enhances efficiency and flexibility in GIS Geographic Information Systems the software used to create, store, and manage spatial data Data that deals with location, such as lists of addresses, the footprint of a building, the boundaries of cities and counties, etc. , analyze spatial problems, and display the data in cartographic layouts Geographic Information Sciences workflows. Users can seamlessly switch between maps, compare datasets, and produce high-quality cartographic layouts without the constraints of working within a single view. Whether you are performing spatial analysis, building thematic maps, or preparing professional reports, the ability to manage multiple maps in ArcGIS Pro makes it a powerful tool for GIS Geographic Information Systems the software used to create, store, and manage spatial data Data that deals with location, such as lists of addresses, the footprint of a building, the boundaries of cities and counties, etc. , analyze spatial problems, and display the data in cartographic layouts Geographic Information Sciences professionals and students alike.
| Figure 4.7a: Using Multiple Maps with Layouts in ArcGIS Pro | |
|---|---|
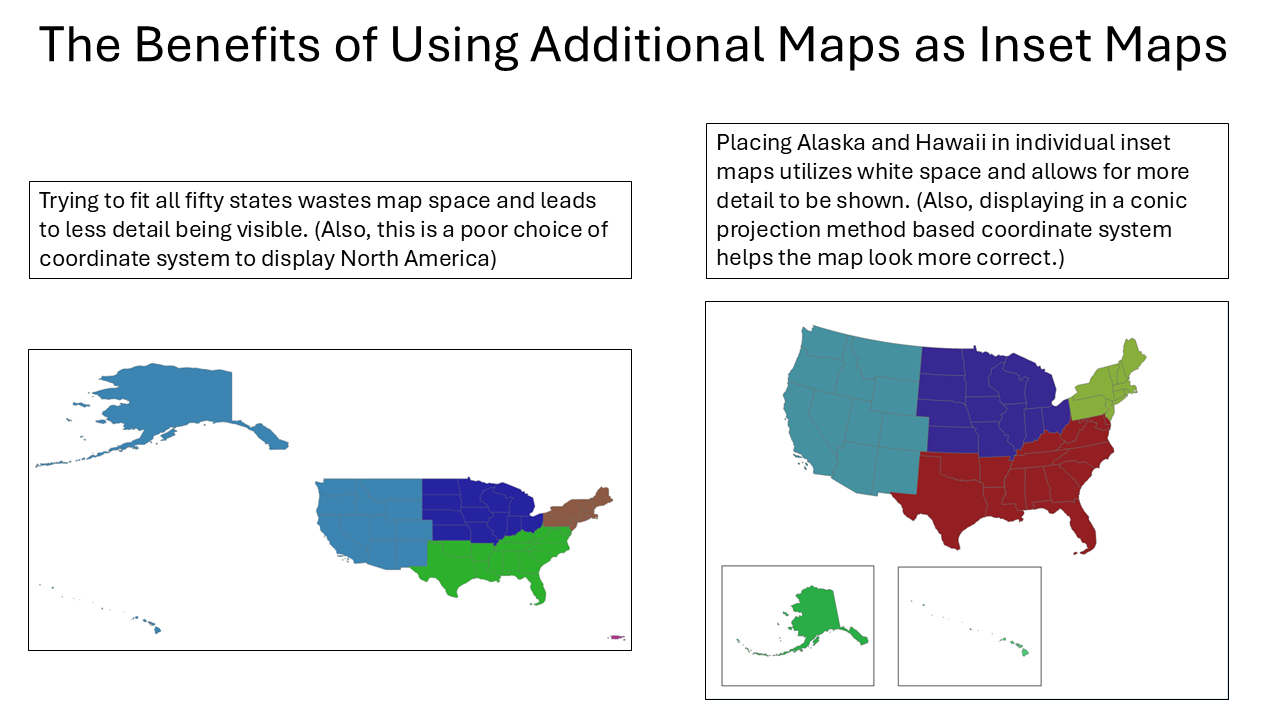 | |
Figure 4.7b: Multiple Map Tabs within ArcGIS Pro | Figure 4.7c: List of Maps and Layouts in the Catalog Pane |
 |  |
| Multiple maps can be open at one time, allowing a user to work on them simultaneously | All the maps and layouts within a single project can be found in the Catalog pane. Closed maps and layouts can be re-opened via a right-click |
Concept Quiz
4.4.4: Understanding Coordinate Systems in Spatial Data
In Chapter Two, we explored coordinate systems and the two major types used in GIS Geographic Information Systems the software used to create, store, and manage spatial data Data that deals with location, such as lists of addresses, the footprint of a building, the boundaries of cities and counties, etc. , analyze spatial problems, and display the data in cartographic layouts Geographic Information Sciences : geographic coordinate systems (GCS) and projected coordinate systems (PCS). These systems define how locations on the Earth's surface are measured and represented within GIS Geographic Information Systems the software used to create, store, and manage spatial data Data that deals with location, such as lists of addresses, the footprint of a building, the boundaries of cities and counties, etc. , analyze spatial problems, and display the data in cartographic layouts Geographic Information Sciences software. Every spatial dataset has a source coordinate system, which allows GIS Geographic Information Systems the software used to create, store, and manage spatial data Data that deals with location, such as lists of addresses, the footprint of a building, the boundaries of cities and counties, etc. , analyze spatial problems, and display the data in cartographic layouts Geographic Information Sciences to understand where the data belongs in the world. The coordinate system determines the measurement units used and provides a structured way to describe where features exist.
The source coordinate system is the original spatial reference assigned to a dataset when it is created or imported into GIS Geographic Information Systems the software used to create, store, and manage spatial data Data that deals with location, such as lists of addresses, the footprint of a building, the boundaries of cities and counties, etc. , analyze spatial problems, and display the data in cartographic layouts Geographic Information Sciences . It defines how the dataset's coordinates are measured and referenced on the Earth’s surface. This system allows GIS Geographic Information Systems the software used to create, store, and manage spatial data Data that deals with location, such as lists of addresses, the footprint of a building, the boundaries of cities and counties, etc. , analyze spatial problems, and display the data in cartographic layouts Geographic Information Sciences software to correctly place the data because it includes information about the dataset’s units of measurement and origin point A GIS vector data in any sort of digital science or art, is simply denoting a type of graphical representation using straight lines to construct the outlines of objects geometry type which is made up of just one vertex pl. vertices One of a set of ordered x,y coordinate pairs that defines the shape of a line or polygon feature. , marking a single XY location in any given geographic or projected coordinate system. . For example, in a geographic coordinate system like WGS 1984, locations are measured in degrees measurement of plane angle, representing 1⁄360 of a full rotation (circle). In full, a degree of arc or arc degree. Usually denoted by ° of latitude also known as 'parallels' the east-west portion of a geographic grid measured with angles between 0 and 90° and longitude from the system's origin at 0° latitude also known as 'parallels' the east-west portion of a geographic grid measured with angles between 0 and 90° and 0° longitude. Longmont, Colorado, is located at approximately 40° N, 105° W, meaning it is 40 degrees measurement of plane angle, representing 1⁄360 of a full rotation (circle). In full, a degree of arc or arc degree. Usually denoted by ° north and 105 degrees measurement of plane angle, representing 1⁄360 of a full rotation (circle). In full, a degree of arc or arc degree. Usually denoted by ° west of the reference point A GIS vector data in any sort of digital science or art, is simply denoting a type of graphical representation using straight lines to construct the outlines of objects geometry type which is made up of just one vertex pl. vertices One of a set of ordered x,y coordinate pairs that defines the shape of a line or polygon feature. , marking a single XY location in any given geographic or projected coordinate system. at the intersection of the equator and prime meridian.
In contrast, a projected coordinate system, such as the Universal Transverse Mercator ( UTM Universal Transverse Mercator ) system, measures locations in meters from a different origin. In UTM Universal Transverse Mercator Zone 13 North, the same location in Longmont is described by coordinates E: 491320.76, N: 4446320.79, meaning it is measured in meters from the origin of that UTM Universal Transverse Mercator zone. Because the source coordinate system tells GIS Geographic Information Systems the software used to create, store, and manage spatial data Data that deals with location, such as lists of addresses, the footprint of a building, the boundaries of cities and counties, etc. , analyze spatial problems, and display the data in cartographic layouts Geographic Information Sciences how the dataset’s features were originally measured and placed, it is critical to understand what system a dataset is using when combining multiple layers or performing spatial analysis.
Knowing the source coordinate system of a spatial dataset is important because it determines how the data is displayed and how distances are measured. If the dataset is in a geographic coordinate system, distances are in angular units ( degrees measurement of plane angle, representing 1⁄360 of a full rotation (circle). In full, a degree of arc or arc degree. Usually denoted by ° ), which are not uniform across the globe. If the dataset is in a projected coordinate system, distances are in linear units (meters or feet), allowing for direct spatial calculations without distortion. The choice of coordinate system affects how data is visualized, analyzed, and interpreted within GIS Geographic Information Systems the software used to create, store, and manage spatial data Data that deals with location, such as lists of addresses, the footprint of a building, the boundaries of cities and counties, etc. , analyze spatial problems, and display the data in cartographic layouts Geographic Information Sciences .
GIS Geographic Information Systems the software used to create, store, and manage spatial data Data that deals with location, such as lists of addresses, the footprint of a building, the boundaries of cities and counties, etc. , analyze spatial problems, and display the data in cartographic layouts Geographic Information Sciences software provides tools to convert data from one coordinate system to another. The Project tool allows us to change the source coordinate system of a dataset by recalculating where each feature belongs based on the new system's measurement rules. When we convert a dataset from WGS 1984 ( latitude also known as 'parallels' the east-west portion of a geographic grid measured with angles between 0 and 90° /longitude) to UTM Universal Transverse Mercator , the software looks at each feature’s existing coordinates, determines its equivalent position in the new system, and assigns new values accordingly. This process ensures that spatial data Data that deals with location, such as lists of addresses, the footprint of a building, the boundaries of cities and counties, etc. remains accurate and properly aligned when working with different datasets.
While the source coordinate system defines the dataset’s original spatial reference, the display coordinate system determines how the data appears in the map view. A dataset can maintain its source coordinate system while being dynamically displayed in another system without permanently altering the data. This flexibility allows GIS Geographic Information Systems the software used to create, store, and manage spatial data Data that deals with location, such as lists of addresses, the footprint of a building, the boundaries of cities and counties, etc. , analyze spatial problems, and display the data in cartographic layouts Geographic Information Sciences users to work with data from different sources without reprojecting it every time. The software performs on-the-fly transformations to align datasets with different coordinate systems in the same map view, ensuring they can be overlaid correctly.
By understanding the source coordinate system, GIS Geographic Information Systems the software used to create, store, and manage spatial data Data that deals with location, such as lists of addresses, the footprint of a building, the boundaries of cities and counties, etc. , analyze spatial problems, and display the data in cartographic layouts Geographic Information Sciences users can ensure that spatial data Data that deals with location, such as lists of addresses, the footprint of a building, the boundaries of cities and counties, etc. is properly aligned, measured accurately, and displayed correctly. Whether working with geographic or projected systems, knowing how data is positioned within GIS Geographic Information Systems the software used to create, store, and manage spatial data Data that deals with location, such as lists of addresses, the footprint of a building, the boundaries of cities and counties, etc. , analyze spatial problems, and display the data in cartographic layouts Geographic Information Sciences is essential for accurate analysis and cartographic representation.
Projecting on the Fly in ArcGIS Pro
When working with spatial data Data that deals with location, such as lists of addresses, the footprint of a building, the boundaries of cities and counties, etc. from different sources, it’s common to encounter datasets with different coordinate systems. Rather than forcing users to reproject every dataset manually, ArcGIS Pro performs “on-the-fly” projection technically: the result of using one of variety of methods to transfer the geographic locations of features from a geographic coordinate system to a developable surface everyday use: any coordinate system, geographic or projected , allowing layers with different source coordinate systems to align properly in the same map view without altering the original data.
On-the-fly projection technically: the result of using one of variety of methods to transfer the geographic locations of features from a geographic coordinate system to a developable surface everyday use: any coordinate system, geographic or projected means that the software temporarily transforms the coordinates of a dataset to match the coordinate system of the map without changing the dataset’s stored (source) coordinate system (Figure 4.8). This allows users to visualize and analyze multiple datasets together, even if they were created using different spatial references. For example, a dataset of rivers might be in UTM Universal Transverse Mercator Zone 13N, while a land cover raster is in WGS 1984 (lat/long). Instead of requiring the user to permanently convert one to match the other, ArcGIS Pro automatically adjusts the layer’s coordinate system in real time so they align correctly in the map.
This flexibility is critical for GIS Geographic Information Systems the software used to create, store, and manage spatial data Data that deals with location, such as lists of addresses, the footprint of a building, the boundaries of cities and counties, etc. , analyze spatial problems, and display the data in cartographic layouts Geographic Information Sciences workflows, as it enables users to quickly combine datasets without having to run transformation tools each time new data is added. However, while on-the-fly projection technically: the result of using one of variety of methods to transfer the geographic locations of features from a geographic coordinate system to a developable surface everyday use: any coordinate system, geographic or projected makes visualization seamless, it does not permanently change the coordinate system of the data. If a dataset with a different coordinate system is used in spatial analysis, geoprocessing, or editing, it is often recommended to officially convert it to match the coordinate system of the map or project to avoid misalignment, accuracy issues, or unexpected errors in calculations.
ArcGIS Pro determines the display coordinate system based on the first dataset added to the map. If additional datasets have different source coordinate systems, the software will apply an appropriate transformation on the fly. Users can change the display coordinate system at any time by modifying the Map Properties, ensuring that all datasets align to a preferred system.
While on-the-fly projection technically: the result of using one of variety of methods to transfer the geographic locations of features from a geographic coordinate system to a developable surface everyday use: any coordinate system, geographic or projected is a powerful feature, it is important to understand its limitations. Some coordinate system transformations, particularly between different datums (such as converting from NAD 1983 to WGS 1984), require datum transformations to ensure accuracy. ArcGIS Pro provides a list of transformation methods and will prompt the user if a more precise transformation is needed.
By leveraging on-the-fly projection technically: the result of using one of variety of methods to transfer the geographic locations of features from a geographic coordinate system to a developable surface everyday use: any coordinate system, geographic or projected , GIS Geographic Information Systems the software used to create, store, and manage spatial data Data that deals with location, such as lists of addresses, the footprint of a building, the boundaries of cities and counties, etc. , analyze spatial problems, and display the data in cartographic layouts Geographic Information Sciences users can streamline workflows, reduce the need for redundant file conversions, and work more efficiently with data from multiple sources. However, for permanent dataset storage, geoprocessing, and spatial analysis, it is best practice to project data properly to maintain consistency and accuracy across layers.
| Figure 4.8: Changing the Display Coordinate System (Projecting on the Fly) |
|---|
Click to Hide/Show Animation
|
| The display coordinate system can be changed without consequence to the source coordinate system of the data listed in the Contents pane. When the display coordinate system is changed, ArcGIS Pro projects the data on the fly, or shows what the data would look like if a tool such as Project was run. |
Current Cursor Location
Since the data frame is displayed in a single coordinate system, the display window can show you the coordinates of the cursor at any given time. These current cursor coordinates are shown at the bottom of the display window in the coordinate system of the data frame regardless of the coordinate system of each layer participating in the ArcMap session, and as you move your cursor around the window, the coordinates change. These current cursor coordinates are useful in getting a rough idea of where you are looking in the world while you are working within ArcMap. For example, if you add some data that you know is in Central Colorado and the current cursor coordinates are displaying values of 85° N, 115° E when you move your cursor over the data, you can quickly get a pretty good idea that something is wrong with the data.
| Figure 4.9: Current Cursor Coordinates in Action | |
|---|---|
Click to Hide/Show Animation
| Click to Hide/Show Animation
|
| ArcGIS Pro (map view) shows the current cursor coordinates at the bottom of the window. Notice in the animation that the coordinates scroll while the cursor is moving and pause when the cursor pauses. The units of the current cursor coordinates are initially those of the display coordinate system. | It's also possible to show the coordinates in latitude also known as 'parallels' the east-west portion of a geographic grid measured with angles between 0 and 90° /longitude, even when the map's display coordinate system (projecting on the fly) is a projected coordinate system utilizing meters as the linear unit of measure. This feature allows a technician to better understand where in the world they are, since we generally use geographic coordinates for navigation and projected coordinates for measuring and analysis. |

When you switch over to layout view in ArcMap in order to start creating your cartographic product, a second set of cursor coordinates pop up, showing you map coordinates, a positive set of coordinates referring to where your cursor is on the printed page versus where the data is in the real world. The coordinates are based on the same principles of the Cartesian Coordinate System, where the is an origin at the lower left corner of the page and positive values moving along the X and Y axis of the page itself. The concept is exactly the same a projected coordinate system, where there is some origin somewhere in the world, and to locate places on the Earth's surface, we move away from the origin until we arrive, measuring the distance in linear units.
| Figure 4.10: Map Coordinates Displayed in Inches |
|---|
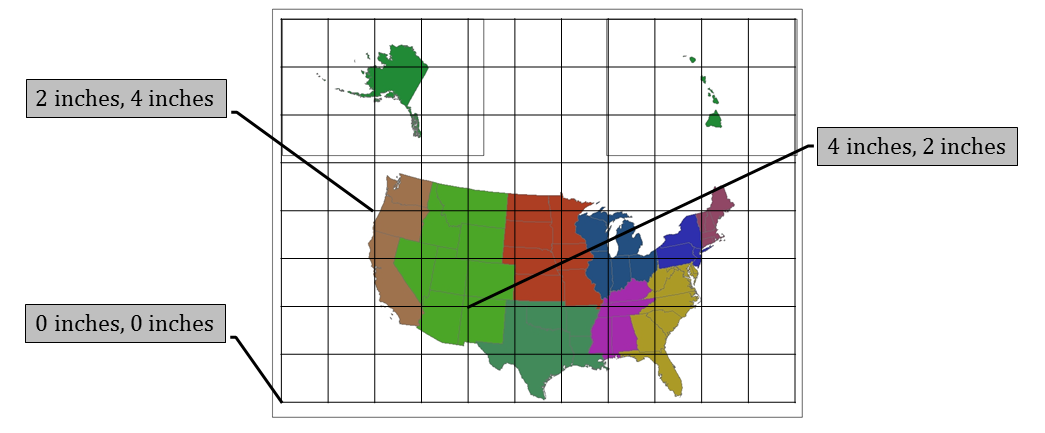 |
| To locate map elements (legend, title, north arrow, etc) for printing neatly and evenly spaced, ArcMap's Layout View uses map coordinates. Also based on the Cartesian Coordinate System, map coordinates are positive numbers starting at a 0,0 origin found at the lower left corner of the page. |
4.4.5: The Contents Pane
In ArcGIS Pro, the Contents Pane is where all layers, tables, and data elements within the active map or scene are listed. Some of these layers may be visible, while others may be turned off. Some layers may be styled with unique symbology, while others might just be data tables. Regardless of how the data is displayed on the map, all active layers are listed in the Contents Pane. From here, you can adjust the drawing order of layers, modify symbology, see where data is stored, and manage visibility settings. The Contents Pane provides quick access to layer properties, display options, and data management tools, making it a central component of working with spatial data Data that deals with location, such as lists of addresses, the footprint of a building, the boundaries of cities and counties, etc. in ArcGIS Pro.
ArcGIS Pro is designed for both data exploration and cartographic production, so the software allows you to make visual changes to the display of your layers without altering the actual data. For example, if you have a US States layer, you can choose to symbolize it in blue in one map and green in another without modifying the dataset itself. The appearance of a layer is entirely dependent on cartographic decisions made within the project. Display settings such as feature colors, labels, and layer order can be adjusted based on the needs of the specific analysis or map being created. In one project, the US States layer might be the primary focus and need bold symbology, while in another project, it may only serve as a contextual data (background reference layer).
Since ArcGIS Pro can display multiple layers and datasets at once, it offers several different ways to organize and view data within the Contents Pane. These different views help manage projects efficiently and are particularly useful when working with large datasets.
| List by Drawing Order | |
By default, ArcGIS Pro lists layers by drawing order, meaning the order in which they appear in the Contents Pane determines how they are stacked in the Map View. The top layer in the list draws above all other layers, while lower layers may be partially or fully obscured depending on transparency and symbology settings. When viewing layers by drawing order, you can:
If a layer is turned on but is not visible in the map, it may be covered by another layer. Adjusting the drawing order by moving the layer higher in the list will allow it to appear on top. | Click to Hide/Show Animation
|
| List by Source | |
The List by Data Source option groups layers based on where they are stored. This allows you to quickly see whether a dataset is coming from:
Unlike the drawing order view, layers in the List by Data Source view cannot be reordered manually, as they are grouped based on their storage location. This view is helpful when managing data sources, checking where layers are saved, or ensuring that datasets are properly linked to their original files. | 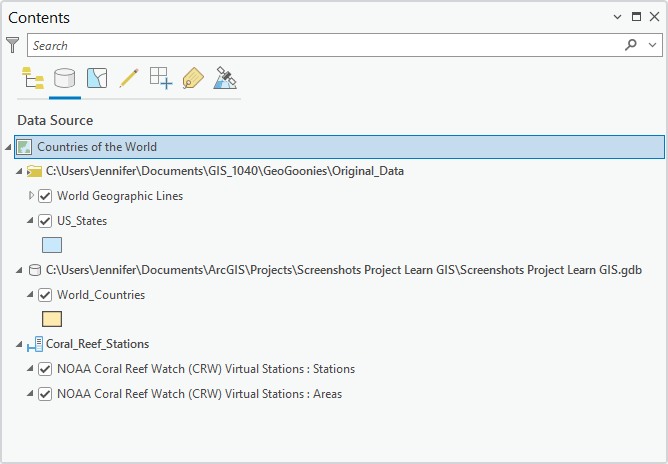 |
| List by Selection | |
The List by Selection option in the Contents Pane organizes layers based on their ability to participate in feature selection. In ArcGIS Pro, not all layers need to be selectable at all times—sometimes, you may want to select features from specific layers while keeping others unaffected. This view helps manage selection settings efficiently by grouping layers into two categories:
This option is particularly useful when working with complex maps that contain multiple datasets, such as parcel data overlaid on aerial imagery. In this case, you may want to enable selection for the parcel layer while disabling selection for the imagery, preventing accidental selections of unnecessary layers. The List by Selection view ensures that selection workflows remain streamlined by showing only the layers that can actively participate in feature selection. Users can quickly toggle a layer’s selection capability by checking or unchecking the selection box next to its name in this view. This helps refine workflows, especially when performing spatial queries, editing features, or analyzing specific datasets without interference from other layers in the map. | 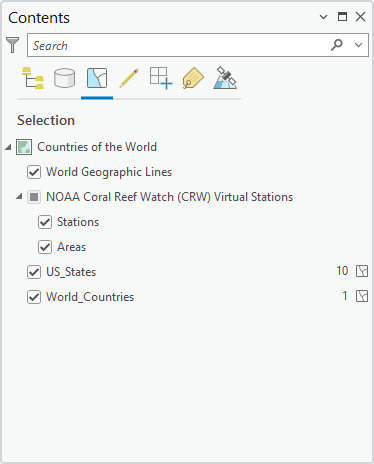 |
Turning Layers On and Off and Collapsing and Expanding Layers
Layers in ArcGIS Pro can be turned on or off by checking or unchecking the box next to the layer name in the Contents Pane. When a layer is turned on, it automatically draws in the Map View. If the map contains many layers, performance may slow down when all layers are visible. In these cases, turning off background layers or adjusting layer transparency can help optimize display speed.
Additionally, when a layer is added to the map, it appears expanded by default, displaying a small symbol preview below its name. This preview indicates how features are drawn:
- Polygons appear as colored rectangles.
- Lines appear as straight line symbols.
- Points appear as small marker symbols.
These previews function similarly to a legend, allowing users to quickly identify how a layer is symbolized. If the expanded view is unnecessary, the layer can be collapsed, hiding the symbology preview but keeping the layer active in the map.
Efficiently Managing Layers in ArcGIS Pro
The Contents Pane in ArcGIS Pro is designed to provide flexibility and efficiency when managing layers, allowing users to control layer order, visibility, and symbology easily. By understanding how to navigate different views—drawing order, data source, and visibility—users can quickly find, organize, and manipulate spatial data Data that deals with location, such as lists of addresses, the footprint of a building, the boundaries of cities and counties, etc. . Whether working on a simple project with a few layers or a large-scale GIS Geographic Information Systems the software used to create, store, and manage spatial data Data that deals with location, such as lists of addresses, the footprint of a building, the boundaries of cities and counties, etc. , analyze spatial problems, and display the data in cartographic layouts Geographic Information Sciences analysis with hundreds of datasets, mastering the Contents Pane ensures a smoother and more productive GIS Geographic Information Systems the software used to create, store, and manage spatial data Data that deals with location, such as lists of addresses, the footprint of a building, the boundaries of cities and counties, etc. , analyze spatial problems, and display the data in cartographic layouts Geographic Information Sciences workflow.
| Figure 4.11: Collapsing/Expanding and Turning On/Turning Off Layers in the Table of Contents within ArcGIS Pro | |
|---|---|
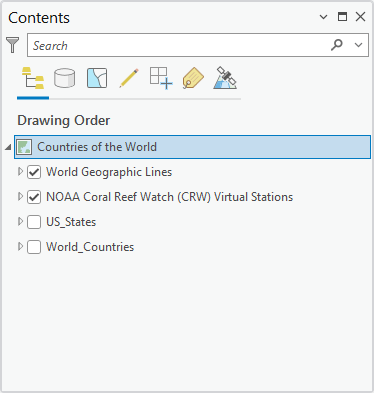 | 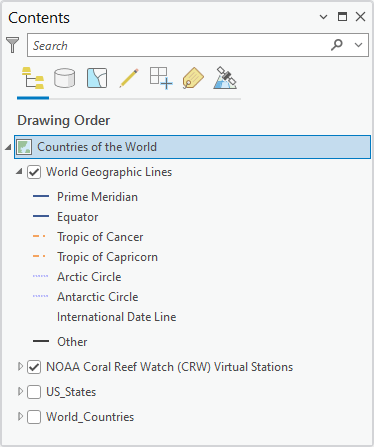 |
| Both World Geographic Lines and the NOAA Coral Reef Watch layers are checked in the Contents pane, meaning they will draw in the display window. | World Geographic Lines is expanded, showing the various symbology of the features within the feature class One of the two main types of vector data in any sort of digital science or art, is simply denoting a type of graphical representation using straight lines to construct the outlines of objects we learn in this class (there are more than two vector data in any sort of digital science or art, is simply denoting a type of graphical representation using straight lines to construct the outlines of objects types in GIS). Feature classes are each only one geometry type, either a point A GIS vector data in any sort of digital science or art, is simply denoting a type of graphical representation using straight lines to construct the outlines of objects geometry type which is made up of just one vertex pl. vertices One of a set of ordered x,y coordinate pairs that defines the shape of a line or polygon feature. , marking a single XY location in any given geographic or projected coordinate system. , a polyline A GIS vector data in any sort of digital science or art, is simply denoting a type of graphical representation using straight lines to construct the outlines of objects geometry type which is made up of two or more vertices connected by straight lines. Often used to represent objects such as roads, river, and boundaries. , or a polygon. Feature classes are stored in geodatabases and are most often used when data relationships are important. . ArcGIS Pro allows features in the same vector layer to be symbolized differently versus having to create a feature class One of the two main types of vector data in any sort of digital science or art, is simply denoting a type of graphical representation using straight lines to construct the outlines of objects we learn in this class (there are more than two vector data in any sort of digital science or art, is simply denoting a type of graphical representation using straight lines to construct the outlines of objects types in GIS). Feature classes are each only one geometry type, either a point A GIS vector data in any sort of digital science or art, is simply denoting a type of graphical representation using straight lines to construct the outlines of objects geometry type which is made up of just one vertex pl. vertices One of a set of ordered x,y coordinate pairs that defines the shape of a line or polygon feature. , marking a single XY location in any given geographic or projected coordinate system. , a polyline A GIS vector data in any sort of digital science or art, is simply denoting a type of graphical representation using straight lines to construct the outlines of objects geometry type which is made up of two or more vertices connected by straight lines. Often used to represent objects such as roads, river, and boundaries. , or a polygon. Feature classes are stored in geodatabases and are most often used when data relationships are important. for each type of line, which reduces data and keeps projects more organized. |
4.4.6: The Ribbon Tabs and Docking Panes in ArcGIS Pro
ArcGIS Pro organizes its tools and functionality using a ribbon interface at the top of the window, replacing the traditional menus and toolbars from older GIS Geographic Information Systems the software used to create, store, and manage spatial data Data that deals with location, such as lists of addresses, the footprint of a building, the boundaries of cities and counties, etc. , analyze spatial problems, and display the data in cartographic layouts Geographic Information Sciences software. The ribbon is divided into tabs, each grouping related tools and commands into a logical workflow. Some tabs, like Map and Analysis, contain commonly used tools, while others, like Manage, appear only when certain views or actions are active.
Each ribbon tab contains panels of buttons, some of which act as shortcuts for frequently used tools, while others provide access to specific workflows such as editing features, performing spatial analysis, or sharing projects. As you become more familiar with ArcGIS Pro, navigating the ribbon will become second nature, but for now, this list is meant to introduce you to its structure and the broad range of functionality available within the software.
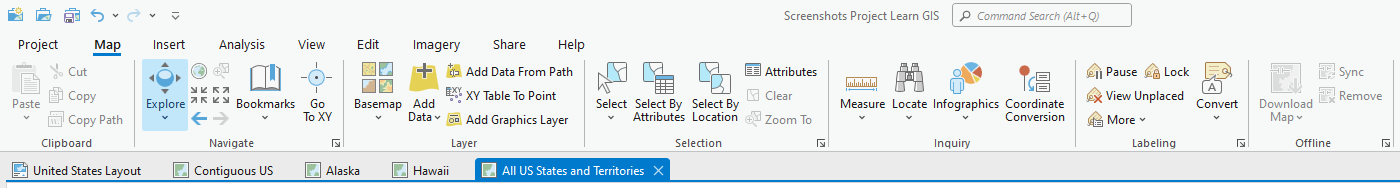
| Ribbon Tab | Highlights |
|---|---|
| Project | Provides access to project settings, including saving, opening, and managing project files, as well as configuring software preferences. |
| Map | Contains tools for interacting with map layers, including navigation, selection, labeling, and adding basemaps A foundational layer on a map that is the basis of GIS visual and geographic context. . |
| Insert | Allows users to add elements to a project, such as new maps, layouts, charts, reports, and map frames. |
| Analysis | Provides access to geoprocessing tools, spatial analysis functions, and model-building capabilities. |
| View | Controls the display of interface elements, such as panes, toolbars, and different map views, including 2D and 3D. |
| Edit | Includes tools for modifying spatial data Data that deals with location, such as lists of addresses, the footprint of a building, the boundaries of cities and counties, etc. , such as creating, deleting, and reshaping features within layers. |
| Imagery | Provides specialized tools for working with raster datasets, including image classification, enhancement, and processing. |
| Share | Facilitates exporting, publishing, and sharing maps, layers, and projects via online services or packaged files. |
| Catalog | Allows access to data management tools for browsing, organizing, and managing files, databases, and connections within a project. |
| Manage | Appears when Catalog View is active and provides tools for organizing, renaming, and managing project datasets and files. |
| Help | Provides access to documentation, tutorials, and troubleshooting resources to assist users with ArcGIS Pro functionality. |
Docking Panes in ArcGIS Pro
| Figure 4.12: Windows in ArcGIS Pro Can Be Free Floating or Attached (Docked) to the Edges of the Display Window |
|---|
Click to Hide/Show Animation
|
| Undock panes by pulling the header of the pane; Close a pane with the X; Open panes via the View ribbon tab; dock a pane by dragging on to any orange docking square (notice the cursor must touch the docking square to make the dock happen!); auto-hide the pane with the push pin on it's side; pin the pane by putting the pushpin down. |
4.4.7: Additional Panes in ArcGIS Pro
The Contents Pane is not the only interactive window in ArcGIS Pro. The software includes multiple dockable panes that provide access to essential tools, data management functions, and analytical workflows. These panes help streamline how GIS Geographic Information Systems the software used to create, store, and manage spatial data, analyze spatial problems, and display the data in cartographic layouts Geographic Information Sciences users interact with their spatial data, making it easier to find tools, manage layers, and conduct spatial analysis without searching through menus.
Each pane serves a specific function, from managing project files to running geoprocessing tools and customizing symbology. Instead of simply adding layers to a map and hoping for insights, these panes allow users to interact with their data in meaningful ways—whether that means adjusting symbology, refining selections, or sharing results.
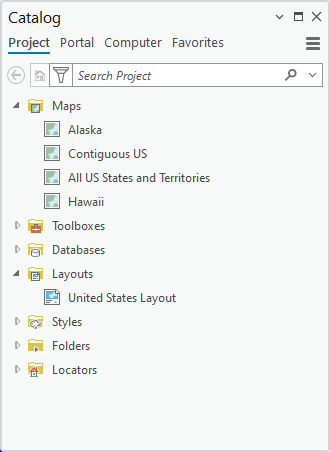
Catalog Pane and Catalog View
The Catalog Pane provides direct access to GIS Geographic Information Systems the software used to create, store, and manage spatial data, analyze spatial problems, and display the data in cartographic layouts Geographic Information Sciences data and project resources. It functions as the main organizational hub for all data within an ArcGIS Pro project, replacing the need for a separate data management application. In this pane, users can browse folders, geodatabases, and network connections without having to navigate through file explorer windows outside the software. This makes it easier to locate and add spatial datasets, as well as manage project components such as maps, layouts, reports, and geoprocessing models.
For a more detailed view, Catalog View offers an expanded interface for managing and previewing datasets. This is particularly useful when renaming, reorganizing, or reviewing metadata for files before adding them to a project. Unlike a simple file browser, the Catalog Pane and Catalog View keep GIS Geographic Information Systems the software used to create, store, and manage spatial data, analyze spatial problems, and display the data in cartographic layouts Geographic Information Sciences data structured within the project environment, ensuring a seamless workflow when managing layers, tables, and geodatabases.
Geoprocessing Pane
The Geoprocessing Pane houses all the spatial analysis and data processing tools in ArcGIS Pro. Rather than searching through long lists of tools in static menus, this pane allows users to search for tools by name, browse categorized toolboxes, and access recently used tools. It provides a structured environment for performing operations such as buffering, clipping, and spatial joins.
Each tool within the Geoprocessing Pane includes a description, required input parameters, and output settings, guiding users through complex spatial operations. Additionally, since ArcGIS Pro allows multiple geoprocessing tools to run at the same time, the pane enables users to track progress and queue additional tasks while others are still processing. This makes spatial analysis more efficient, as users can continue working on their project while waiting for results.
Symbology Pane
The Symbology Pane allows users to control how spatial data is displayed in the Map View. Since GIS Geographic Information Systems the software used to create, store, and manage spatial data, analyze spatial problems, and display the data in cartographic layouts Geographic Information Sciences data is often raw and unstyled when first loaded, this pane provides tools to customize how features appear. Users can adjust colors, symbol styles, and classification methods to ensure that maps communicate their intended message clearly.
Rather than relying on default settings, the Symbology Pane enables GIS Geographic Information Systems the software used to create, store, and manage spatial data, analyze spatial problems, and display the data in cartographic layouts Geographic Information Sciences users to apply thematic styling, such as color ramps for elevation the vertical distance between local mean sea level the measurement above or below the global average at a single point A GIS vector data in any sort of digital science or art, is simply denoting a type of graphical representation using straight lines to construct the outlines of objects geometry type which is made up of just one vertex pl. vertices One of a set of ordered x,y coordinate pairs that defines the shape of a line or polygon feature. , marking a single XY location in any given geographic or projected coordinate system. on the Earth's surface used for recording the elevation of topographic surface a detailed map of the surface features of land. It includes the mountains, hills, creeks, and other bumps and lumps on a particular hunk of earth. The word is a Greek-rooted combo of topos meaning "place" and graphein "to write." 's relief the difference between the highest and lowest point within a particular area while landforms are the descriptive words for individual features and a single point A GIS vector data in any sort of digital science or art, is simply denoting a type of graphical representation using straight lines to construct the outlines of objects geometry type which is made up of just one vertex pl. vertices One of a set of ordered x,y coordinate pairs that defines the shape of a line or polygon feature. , marking a single XY location in any given geographic or projected coordinate system. on the Earth's surface data or categorical symbols for land use classifications. Adjustments made in this pane do not alter the actual data—only how it is represented visually—allowing for flexibility in map design and analysis.
Selection Pane
The Selection Pane helps users refine and manage which layers can be interacted with during feature selection. When working with multiple datasets, it is often necessary to select features from specific layers while keeping others unaffected. For example, if a project contains roads, buildings, and zoning boundaries, users might only want to select road segments without accidentally clicking on other features.
This pane provides a clear list of layers that are currently set to be selectable. Users can toggle selection on and off for individual layers, ensuring that only relevant features are included in spatial queries, attribute table selections, or editing workflows. This is particularly useful when working with large or overlapping datasets where accidental selections could lead to errors or inefficiencies.
Table Pane (Attribute Table Management)
The Table Pane allows users to explore the attribute data associated with spatial layers. Every feature in a GIS Geographic Information Systems the software used to create, store, and manage spatial data, analyze spatial problems, and display the data in cartographic layouts Geographic Information Sciences dataset is linked to an attribute table that contains additional information—such as names, population figures, or elevation the vertical distance between local mean sea level the measurement above or below the global average at a single point A GIS vector data in any sort of digital science or art, is simply denoting a type of graphical representation using straight lines to construct the outlines of objects geometry type which is made up of just one vertex pl. vertices One of a set of ordered x,y coordinate pairs that defines the shape of a line or polygon feature. , marking a single XY location in any given geographic or projected coordinate system. on the Earth's surface used for recording the elevation of topographic surface a detailed map of the surface features of land. It includes the mountains, hills, creeks, and other bumps and lumps on a particular hunk of earth. The word is a Greek-rooted combo of topos meaning "place" and graphein "to write." 's relief the difference between the highest and lowest point within a particular area while landforms are the descriptive words for individual features and a single point A GIS vector data in any sort of digital science or art, is simply denoting a type of graphical representation using straight lines to construct the outlines of objects geometry type which is made up of just one vertex pl. vertices One of a set of ordered x,y coordinate pairs that defines the shape of a line or polygon feature. , marking a single XY location in any given geographic or projected coordinate system. on the Earth's surface values—that helps describe the spatial features.
Within the Table Pane, users can sort, filter, and query attribute data to better understand patterns within their dataset. They can also edit values, join tables, and establish relationships between datasets. Since GIS Geographic Information Systems the software used to create, store, and manage spatial data, analyze spatial problems, and display the data in cartographic layouts Geographic Information Sciences integrates spatial and non-spatial data Attributes related to a location but not describing its physical placement in space, such as information about a tree's age, type, and health. , the ability to interact with attribute tables is crucial for performing meaningful analysis.
View Pane
The View Pane provides tools for managing how maps, layouts, and tables are displayed within ArcGIS Pro. Unlike traditional GIS Geographic Information Systems the software used to create, store, and manage spatial data, analyze spatial problems, and display the data in cartographic layouts Geographic Information Sciences applications that limited users to a single map at a time, ArcGIS Pro allows multiple maps and layouts to be open simultaneously. This pane helps users efficiently switch between 2D and 3D views, compare different maps side by side, or arrange multiple datasets within a single project.
By enabling multiple views within the same interface, the View Pane makes it easier to analyze relationships between datasets, compare historical changes, or prepare multiple maps for a final report. Users can customize their workspace by rearranging maps and linking views together so that panning and zooming in one map automatically adjusts the other.
Contents Pane
The Contents Pane is the primary window for managing layers within a map or scene. Unlike a simple file list, this pane provides tools for controlling the order of layers, toggling visibility, and adjusting layer properties. Users can expand layers to see symbology settings, reorder layers by dragging them, and apply filters to control what is displayed in the Map View.
Since the way layers are organized affects how they appear in a final map, the Contents Pane is an essential tool for structuring GIS Geographic Information Systems the software used to create, store, and manage spatial data, analyze spatial problems, and display the data in cartographic layouts Geographic Information Sciences projects effectively. Whether working with just a few layers or managing complex datasets with dozens of overlapping features, this pane keeps everything accessible and organized.
Share Pane
The Share Pane is used for exporting, publishing, and distributing GIS Geographic Information Systems the software used to create, store, and manage spatial data, analyze spatial problems, and display the data in cartographic layouts Geographic Information Sciences projects. Since GIS Geographic Information Systems the software used to create, store, and manage spatial data, analyze spatial problems, and display the data in cartographic layouts Geographic Information Sciences data is often shared between teams or published as interactive web maps, this pane provides options for saving and sharing work in various formats. Users can export maps and layouts as images or PDFs, publish layers to ArcGIS Online or an enterprise portal, and package GIS Geographic Information Systems the software used to create, store, and manage spatial data, analyze spatial problems, and display the data in cartographic layouts Geographic Information Sciences projects for collaboration.
By offering multiple sharing options within a single pane, ArcGIS Pro makes it easy to distribute maps and spatial data in formats suitable for different audiences. Whether sharing a static print map or an interactive web map, the Share Pane provides the necessary tools to ensure that GIS Geographic Information Systems the software used to create, store, and manage spatial data, analyze spatial problems, and display the data in cartographic layouts Geographic Information Sciences work reaches its intended users.
Manage Pane
The Manage Pane appears when Catalog View is active and provides tools for organizing datasets, folders, and files within a project. Since GIS Geographic Information Systems the software used to create, store, and manage spatial data, analyze spatial problems, and display the data in cartographic layouts Geographic Information Sciences projects often involve large amounts of data stored in various formats, this pane allows users to efficiently rename, move, and organize files.
By providing a dedicated space for managing data, the Manage Pane helps users keep their projects structured, ensuring that datasets remain easy to access and reference throughout the GIS Geographic Information Systems the software used to create, store, and manage spatial data, analyze spatial problems, and display the data in cartographic layouts Geographic Information Sciences workflow.
Help Pane
The Help Pane connects users to documentation, tutorials, and troubleshooting resources directly within ArcGIS Pro. Instead of searching online for answers, users can look up tool descriptions, access Esri’s official documentation, and follow step-by-step tutorials.
For new GIS Geographic Information Systems the software used to create, store, and manage spatial data, analyze spatial problems, and display the data in cartographic layouts Geographic Information Sciences users, the Help Pane is an invaluable resource for learning workflows and solving problems. Whether looking for guidance on geoprocessing tools, understanding coordinate system transformations, or troubleshooting unexpected behavior, this pane provides direct access to the knowledge needed to work effectively in ArcGIS Pro.
Customizing Panes in ArcGIS Pro
One of the strengths of ArcGIS Pro is its flexible interface, allowing users to dock, resize, and rearrange panes to fit their workflow. Users can choose to keep frequently used panes open while hiding others, move panes to secondary monitors, or save custom pane layouts for different tasks.
Understanding these panes and their functions is essential for working efficiently in ArcGIS Pro. Whether managing data, running analysis, customizing symbology, or sharing final products, each pane plays a role in the broader GIS Geographic Information Systems the software used to create, store, and manage spatial data, analyze spatial problems, and display the data in cartographic layouts Geographic Information Sciences workflow. By taking advantage of the tools available in these panes, users can streamline their work, organize their projects effectively, and gain deeper insights into their spatial data.