Attribute tables are a fundamental component of GIS Geographic Information Systems the software used to create, store, and manage spatial data Data that deals with location, such as lists of addresses, the footprint of a building, the boundaries of cities and counties, etc. , analyze spatial problems, and display the data in cartographic layouts Geographic Information Sciences data, serving as the structured storage of information about spatial features. While data tables in GIS Geographic Information Systems the software used to create, store, and manage spatial data Data that deals with location, such as lists of addresses, the footprint of a building, the boundaries of cities and counties, etc. , analyze spatial problems, and display the data in cartographic layouts Geographic Information Sciences can exist independently, attribute tables are specifically linked to spatial data Data that deals with location, such as lists of addresses, the footprint of a building, the boundaries of cities and counties, etc. , providing essential details about vector features and certain types of raster data Raster data is a type of digital data that stores information about a location using a grid of pixels or cells. All spatial rasters are raster files, but not all raster files are spatial rasters. . Just as a spreadsheet contains rows and columns of information, an attribute table organizes data in a similar way, with each row representing an individual spatial feature and each column holding a specific attribute related to that feature. These attributes can include names, categories, measurements, or other descriptive data that help make spatial analysis possible.
Attribute tables are most commonly associated with vector data in any sort of digital science or art, is simply denoting a type of graphical representation using straight lines to construct the outlines of objects models, where they store information about points, lines, and polygons. Each feature in a vector dataset—whether a road, a city, or a land parcel—has a corresponding row in the attribute table, linking geographic location with meaningful descriptive information. Additionally, integer raster datasets (such as classification rasters) also use attribute tables to associate numeric values in the raster with specific categories, like different types of vegetation or soil classes. In contrast, continuous raster datasets, such as elevation the vertical distance between local mean sea level the measurement above or below the global average at a single point A GIS vector data in any sort of digital science or art, is simply denoting a type of graphical representation using straight lines to construct the outlines of objects geometry type which is made up of just one vertex pl. vertices One of a set of ordered x,y coordinate pairs that defines the shape of a line or polygon feature. , marking a single XY location in any given geographic or projected coordinate system. on the Earth's surface used for recording the elevation of topographic surface a detailed map of the surface features of land. It includes the mountains, hills, creeks, and other bumps and lumps on a particular hunk of earth. The word is a Greek-rooted combo of topos meaning "place" and graphein "to write." 's relief the difference between the highest and lowest point within a particular area while landforms are the descriptive words for individual features and a single point A GIS vector data in any sort of digital science or art, is simply denoting a type of graphical representation using straight lines to construct the outlines of objects geometry type which is made up of just one vertex pl. vertices One of a set of ordered x,y coordinate pairs that defines the shape of a line or polygon feature. , marking a single XY location in any given geographic or projected coordinate system. on the Earth's surface or temperature models, do not typically use attribute tables since their pixel The smallest unit of information in a digital image or raster map, usually square or rectangular. Often used synonymously with cell. Pixel is an abbreviation of "picture element". values represent measurements rather than categories.
Understanding how attribute tables function is essential for working with GIS Geographic Information Systems the software used to create, store, and manage spatial data Data that deals with location, such as lists of addresses, the footprint of a building, the boundaries of cities and counties, etc. , analyze spatial problems, and display the data in cartographic layouts Geographic Information Sciences data, as they enable users to filter, query, and analyze information tied to geographic features. Through attribute tables, users can perform tasks like selecting all cities with a population over a certain threshold, identifying parcels of land that fall within a designated flood zone, or symbolizing map features based on specific attributes. These operations make attribute tables a key tool in connecting raw spatial data Data that deals with location, such as lists of addresses, the footprint of a building, the boundaries of cities and counties, etc. with analytical decision-making.
While this introduction provides a general overview, Chapter Five will explore attribute tables in much greater detail. There, we will examine how to navigate, edit, and manipulate attribute data, as well as how attribute tables integrate with GIS Geographic Information Systems the software used to create, store, and manage spatial data Data that deals with location, such as lists of addresses, the footprint of a building, the boundaries of cities and counties, etc. , analyze spatial problems, and display the data in cartographic layouts Geographic Information Sciences workflows. For now, it is important to understand that attribute tables serve as the bridge between spatial features and the descriptive information that makes GIS Geographic Information Systems the software used to create, store, and manage spatial data Data that deals with location, such as lists of addresses, the footprint of a building, the boundaries of cities and counties, etc. , analyze spatial problems, and display the data in cartographic layouts Geographic Information Sciences a powerful tool for analysis.
| Figure 3.19: A Typical Attribute Table with Labels |
|---|
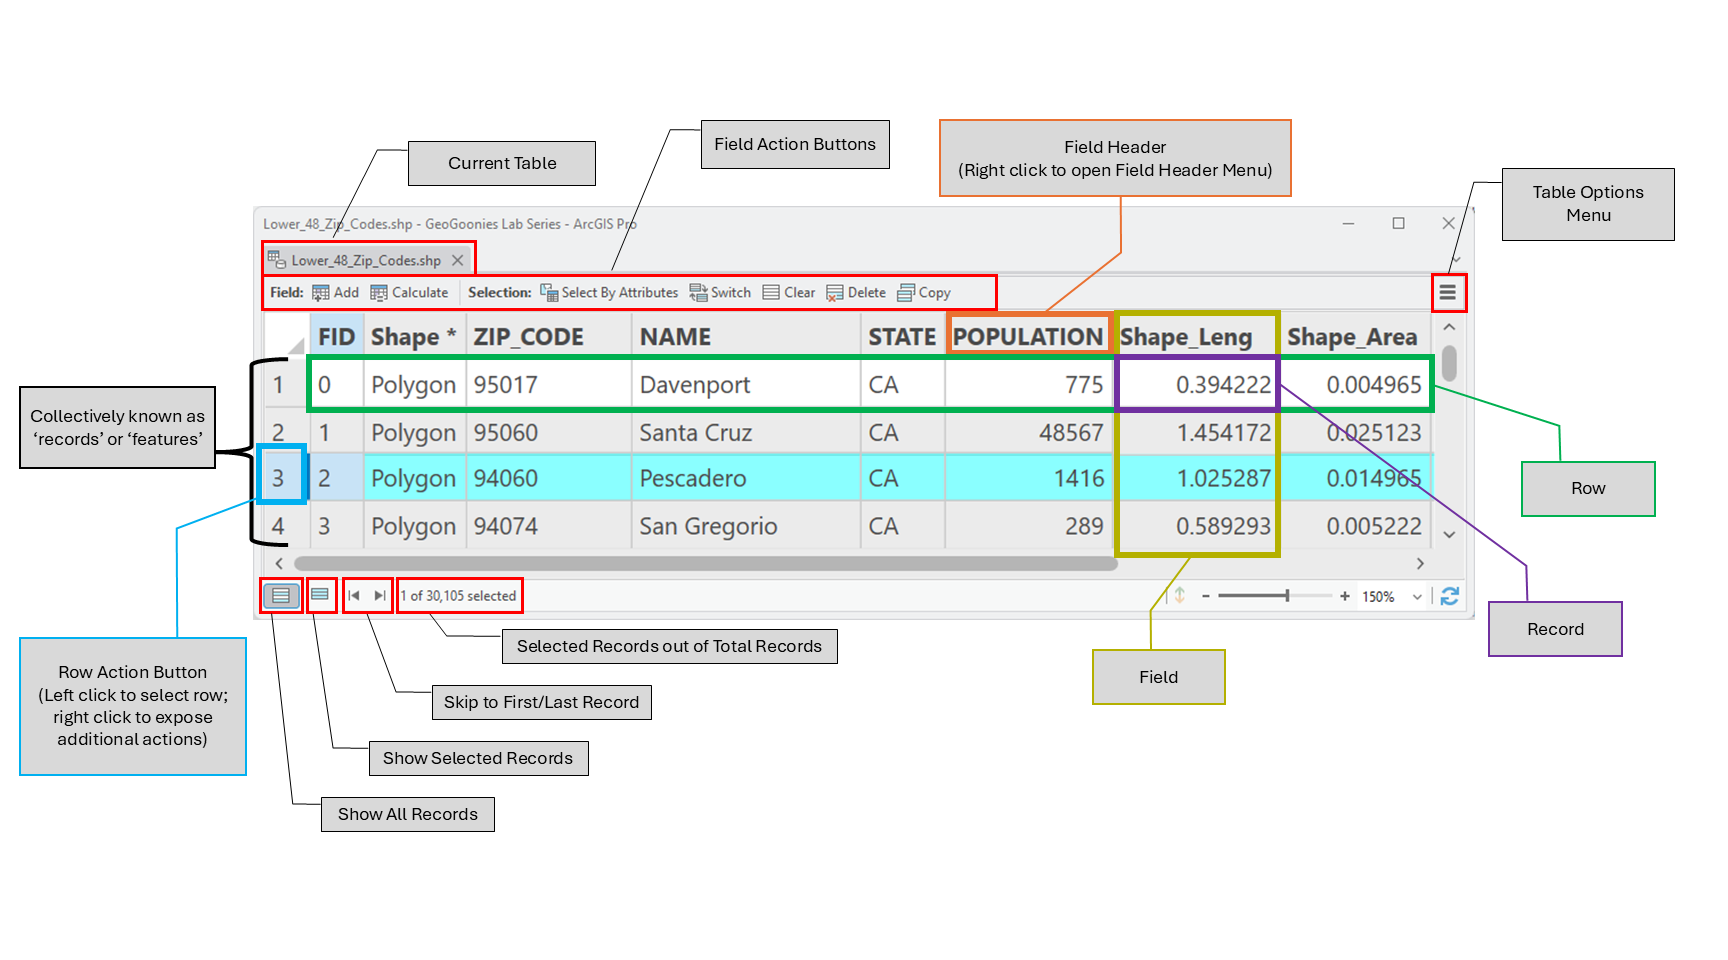 |